Graph Exploration By All MEANS With mongo2neo4j and SemSpect

Managing Director & Co-Founder, derivo GmbH
12 min read

An ETL for Visualizing and Exploring the Data Graph Behind Every MEAN Stack
Are you struggling to answer urgent questions about the data from your MEANS web service? Where is the BI that quickly answers the question “Which Asian artisan.plus users triggered orders in the past quarter?” without writing a query? With mongo2neo4j, Neo4j, and SemSpect, such questions can be answered visually, as needed, and free of charge. This post explains how to transfer your MongoDB data and object model to Neo4j and how to use SemSpect to gain insights into your business data.
This article is a collaborative effort by Marko Luther and Thorsten Liebig.
The MEAN Stack
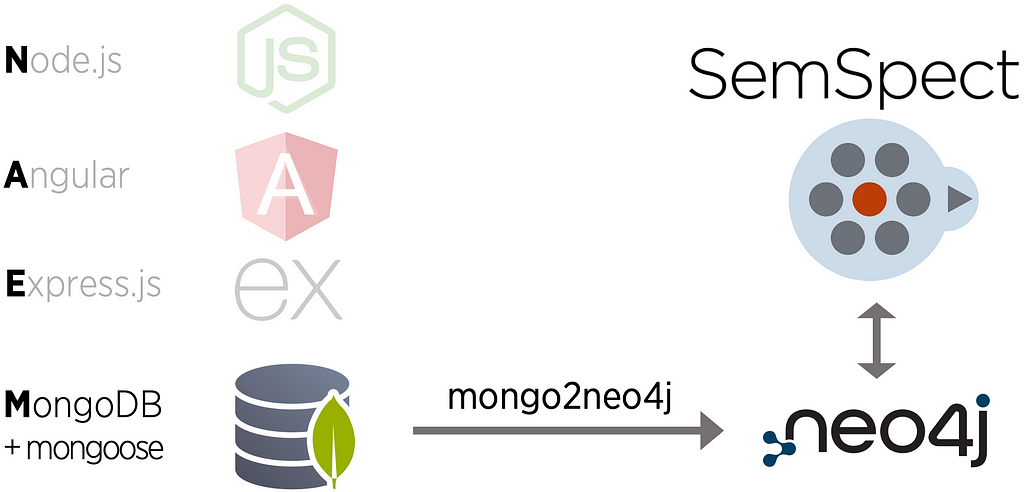
The MEAN stack (MEANS) is a popular combination of technologies built on MongoDB, Express.js, AngularJS, and Node.js for cloud applications like Netflix, PayPal, Gmail, LinkedIn, YouTube, and more. With regard to the front end, there are variants of this stack, such as MERN (with React instead of Angular) or MEVN (with Vue.js). No matter how, MongoDB always serves as the data back end as a database that manages nested JSON objects in collections. A collection contains JSON objects, called documents in MongoDB, with a similar structure (e.g., a collection for users, one for products, one for orders, etc.).
This stack is often supplemented with an object data modeling (ODM) framework, such as mongoose on top of MongoDB. By incorporating mongoose, you can seamlessly define and enforce data schemas that establish links between JSON objects between or across collections. This enhances data integrity and reduces the risk of inconsistencies.
Valuable Knowledge Hidden in Collections
The MEAN stack is great, but it doesn’t allow easy insight into the underlying data to answer even simple business questions. This is because collections of JSON data aren’t easy to explore. There is a query API for MongoDB, including aggregation and projection, but the result is always JSON. Furthermore, the API is a bit cumbersome, requires programming knowledge, and sometimes you don’t know exactly what to look for in your data from the start.
This is where mongo2neo4j comes into play. With an automatic translation into a labeled property graph (LPG) for Neo4j, the resulting graph can be visualized, explored, and analyzed easily with SemSpect.
As an example, on planning a new feature for the coffee inventory management app artisan.plus, a question came up: Are any of its PRO users roasting pure Arabica coffee blends with coffees solely from Brazil? Investigating this, using a few clicks in SemSpect with the relevant artisan.plus data loaded (about 1.2 million nodes and 3.6 million relationships) revealed that 59 PRO users did about 24,000 of such blend roasts.
Turn Your MEANS Into a Graph and Explore
Mongo2neo4j, Neo4j, and the SemSpect graph visualization and exploration tool effectively solve this lack of data insight.
mongo2neo4j is the fastest and most convenient way to transfer your MEANS data into a native graph, taking into account the object-relational data model. But why should we map the data into a graph? A graph model is the most natural data model when you deal with objects and relations — exactly what you have encoded in your MongoDB when applying mongoose or any other ODM framework. The resulting graph is close to the object-relational data model. A graph shown as a network of objects and relationships is much easier to query and understand compared to the original JSON representation that is spread across various collections.
To put it simply: With mongo2neo4j, all top-level JSON objects become graph nodes. The fields of each JSON object result in properties of the respective graph node. By default, nested array elements also become nodes, linked to their origin node by a relationship.
For each object reference introduced by the ODM framework (via an object ID), mongo2neo4j creates a relationship to the respective node of the object in the graph model. As we can see later, some configurations allow us to tweak the mapping of JSON objects to Neo4j nodes if necessary.
Once our JSON collections are available as a data graph, it’s much easier to see the links between nodes, grasp indirect connections, and develop queries by interactively exploring the graph with tools like SemSpect.
A MEANS Example
For example, let’s take a simple shop application based on the MEAN stack, in which users from different countries can order various products.
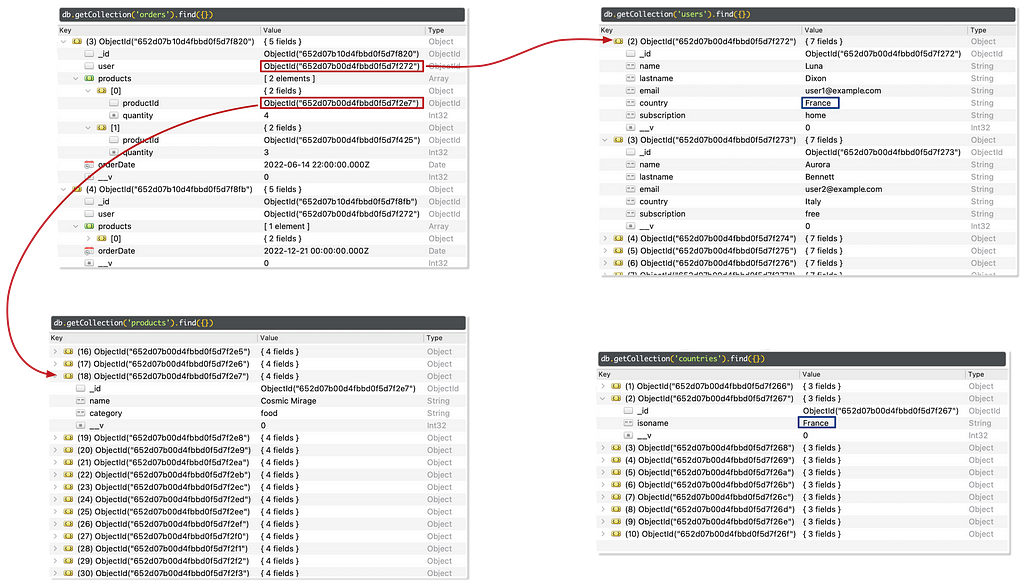
We use randomly generated sample data whose data generator is supplied with the mongo2neo4j example directory. When inspecting the sample data in MongoDB with a UI such as Robo 3T, we see four collections, which are the result of the ODM defined in models.js with the help of the mongoose framework.
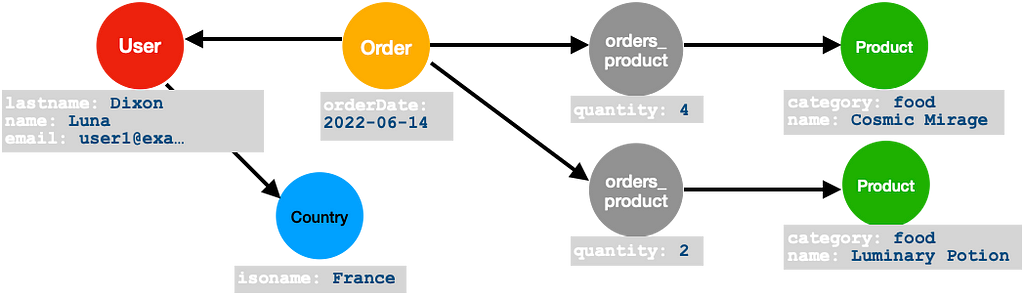
The objects representing orders have object references to a user (the orderer) and products (the purchases), shown below as red arrows for one order.
Finding out which products have been ordered by users from France is possible with the MongoDB query language using cascades of $lookup and $project. However, it’s overly complicated and definitely not suited for ad-hoc data analysis.
Therefore, let’s extract the data collections with mongo2neo4j and load them into Neo4j to see how the data shows up in a graph database. We simply install the Python package mongo2neo4j and run the data transformation:
> pip3 install mongo2neo4j
> mongo2neo4j --neo4j_password=<your-neo4j-password> <your-mongodb-database>
For successful execution, a Neo4j database must be set up and accepting remote Cypher commands (the latter is the default for local connections).
From the person example in the beginning, we expect any top-level object from each collection to become a node in the resulting graph. Nested objects should also become nodes.
When looking at the image showing the collage of collections above, the only nesting in the shop data is the “products” field in objects of the “orders” collection. The respective value of such a field is an array of objects where each array object contains a reference to a “product” object and an integer value with the quantity of the ordered amount. How is this structure translated into an LPG model by means of nodes and edges, and node/edge properties?
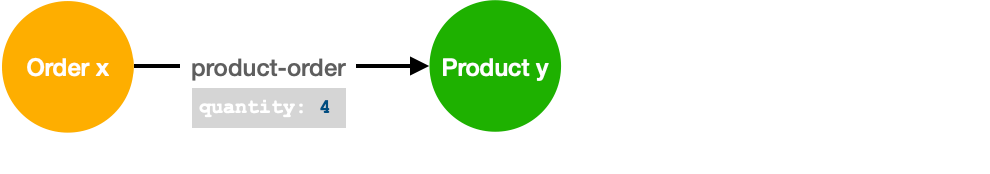
The simplest way would be an order node linked to product nodes by some product-order relationship, whereby the number of products is represented by a corresponding property of the respective relationship as illustrated below.
However, this type of mapping would cause problems if each array element contained another object reference. The LPG model behind Neo4j only allows relationships between two objects. Therefore, a more general way to model such a construct in LPGs is with the help of a dedicated new node.
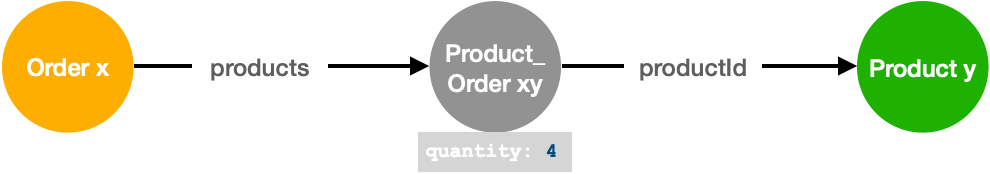
In the context of data modeling, this pattern is called reification, as it reifies a relationship by introducing a node that explicitly represents this relationship. The nodes of the originating relationship link the resulting node and can furthermore relate to multiple other nodes or store properties such as amount.
mongo2neo4j reifies all relationships originating from nested objects in favor of supporting any sort of n-ary relationships.
Fine-tune the ETL Process
The default mapping implemented in mongo2neo4j turns all object references within MongoDB into relationships of the resulting graph model in Neo4j, as described earlier. There are configuration options to convert implicitly encoded links of the ODM into relationships or to assign specific labels to nodes, depending on the field values of the originating objects.
For instance, we can see that “countries” is a collection unrelated to the other collections per design of the given ODM. However, the values of the “isoname” object field in this collection (i.e., France) seem to match the values of the “country” field of users.
To establish a link from users to their countries, we can configure mongo2neo4j to create such a relationship by providing a pair of <collection>.<field> pairs as a matching condition:
--relations "users.country,countries.isoname"
To assign nodes additional labels depending on the field values of the originating MongoDB objects, we can use the “sublabel” option. In our example, this is useful for classifying the users according to their subscription plans. The user’s subscription is encoded as a string value in the “subscription” field. To turn these values into Neo4j labels, we specify which field values should be considered labels (here, “user.subscription”), if the label should get a postfix (“_user”), and what label should be used if no value (`no subscription`):
--sublabels "users.subscription._user,`no subscription`"
Furthermore, there are more mapping options, such as to exclude collections or fields from the mapping process, as well as options to specify MongoDB and Neo4j connection details. See Script Arguments for an exhaustive description of the configuration options.
An excerpt of the MongoDB data shown in the collections above finally looks as follows.
The analysis question asked earlier about all products from users in France now corresponds to a graph traversal request from the node France (blue circle) over all related users and their orders for products. This can easily be done with the Neo4j Cypher query language:
match (:countries {isoname:’France’})<--(:users)<--(:orders)-->
      (:orders_products)-->(p:products)
return count(distinct p)
Writing such a query requires Cypher knowledge, but is at least much easier than its MongoDB query counterpart since Cypher uses a text-based visual depiction to declaratively depict nodes (written in round brackets) and relationships (written as “->”or “-[:relation-type]->”) query patterns.
However, there is an even simpler way of writing such queries — without any query language skills or knowledge of the underlying graph model: SemSpect.
SemSpect By All MEANS
SemSpect is a no-code graph exploration and visualization tool. It is available for Neo4j as well as for RDF graph data. There is a free version of SemSpect as GraphApp for Neo4j Desktop, which has some limitations but is powerful enough for serious exploration of large MongoDB datasets — for our small example anyway.
Note: Please make sure you use Neo4j Desktop 1.5.9, which you can download. The latest version (1.6.0) puts Neo4j Desktop into maintenance mode and no longer allows graph apps to be installed.
If the data from our MEANS example is already in a Neo4j DBMS using Neo4j Desktop (instructions are in the mongo2neo4j example on GitHub), then SemSpect is just around the corner. Simply install the SemSpect graph app directly from the Neo4j Developer Graph Apps Gallery.
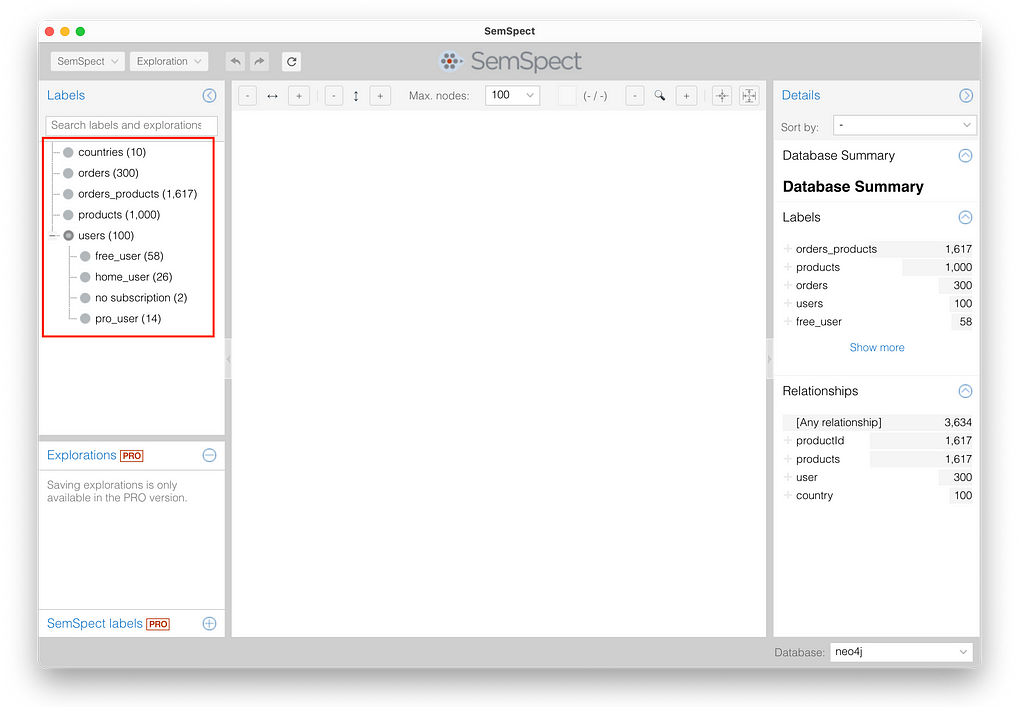
After SemSpect installation and setup, you will see the labels imported by mongo2neo4j in the list on the left, highlighted by a red box in the image below. The additional labels generated for the different subscription plans are sorted below the users label. SemSpect automatically infers sub-label inclusion between labels. Here, all users of one of the subscription labels always also carry the user label.
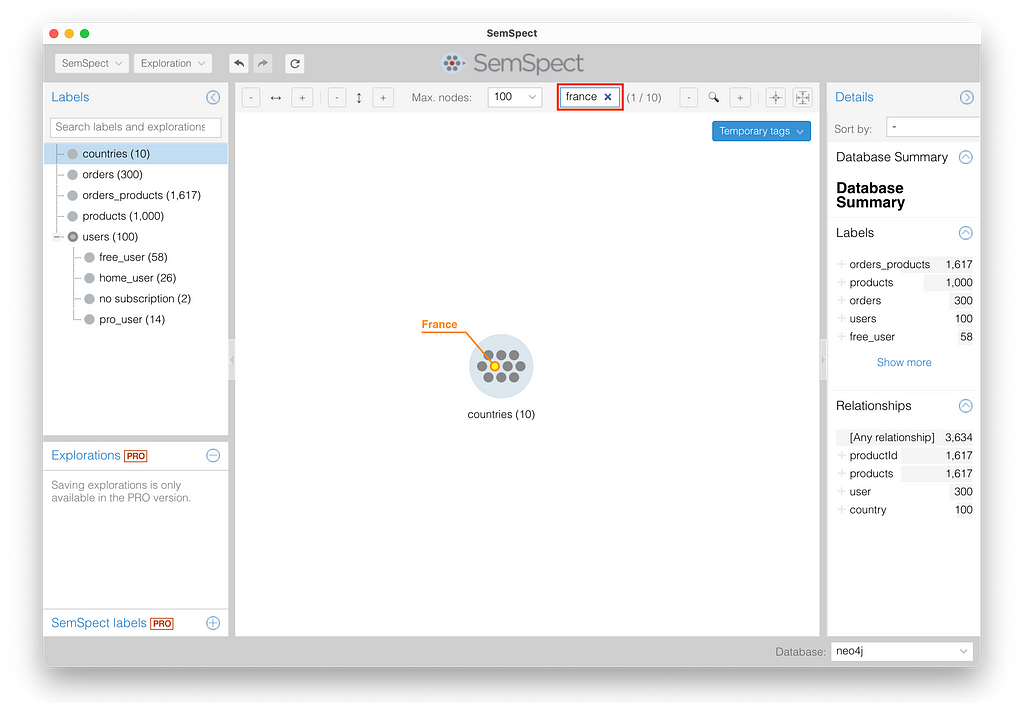
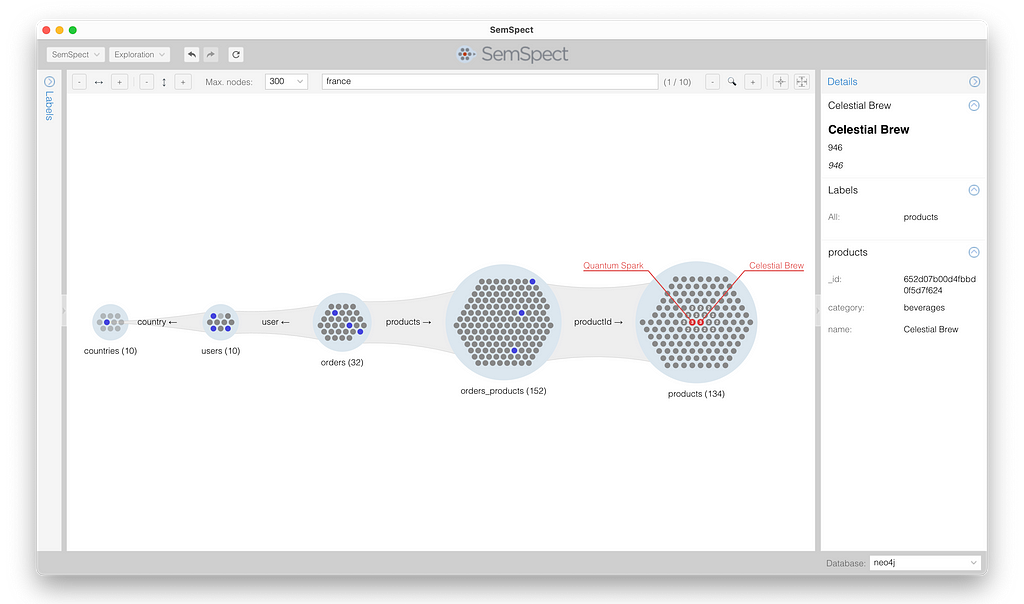
You can now simply drag and drop one of the labels onto the exploration pane in the middle canvas of the SemSpect UI. To answer our query, we start with the “countries” label. Once placed in the exploration pane, we see 10 country nodes (gray dots) within the group (blue circle). When searching for “france” in the search box and pressing Enter, we see the node representing France, highlighted with a flag showing its name.
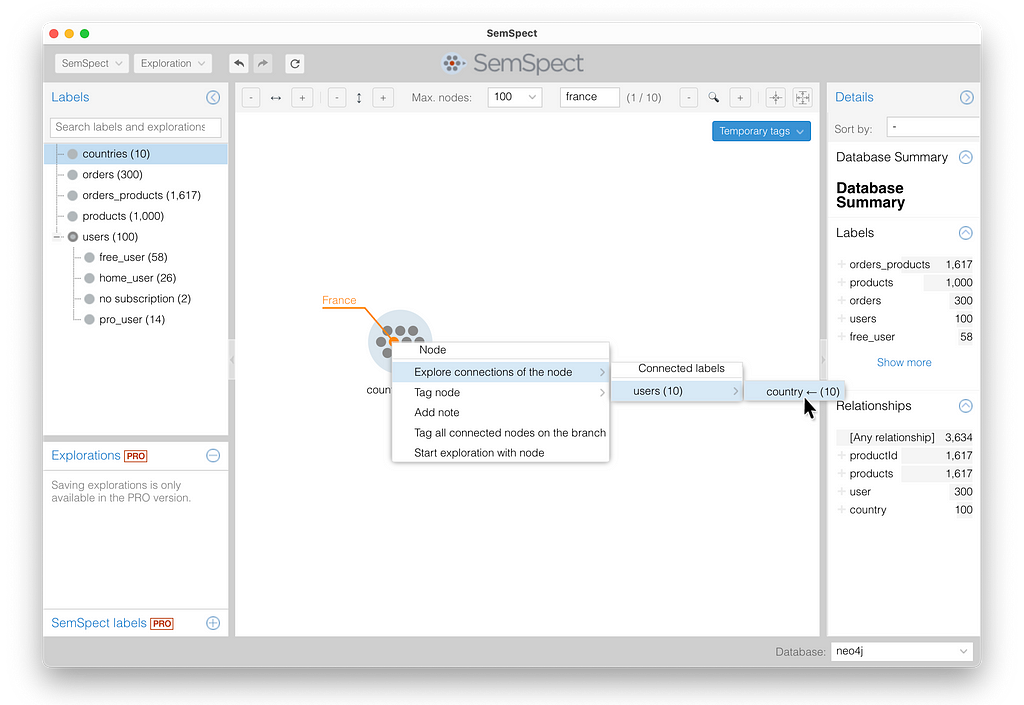
To explore the path from this node to the ordered products of users from France, we can select the node and use the context menu “Explore connections of the node.” Since this node is only connected to user nodes via the outgoing country relationship, we can only select this relationship for exploration.
By repeatedly expanding the “orders” and then “orders_products” group, as shown below, we finally end up at the “products” group. The numbers in the nodes of the 134 products of orders from France show how often this product is linked to a node from the group directly to the left. In other words, the numbers show how often these products were ordered.
We found two products that were ordered three times. One of them is the beverage Celestial Brew. Selecting this node shows its properties in the details dossier on the right.
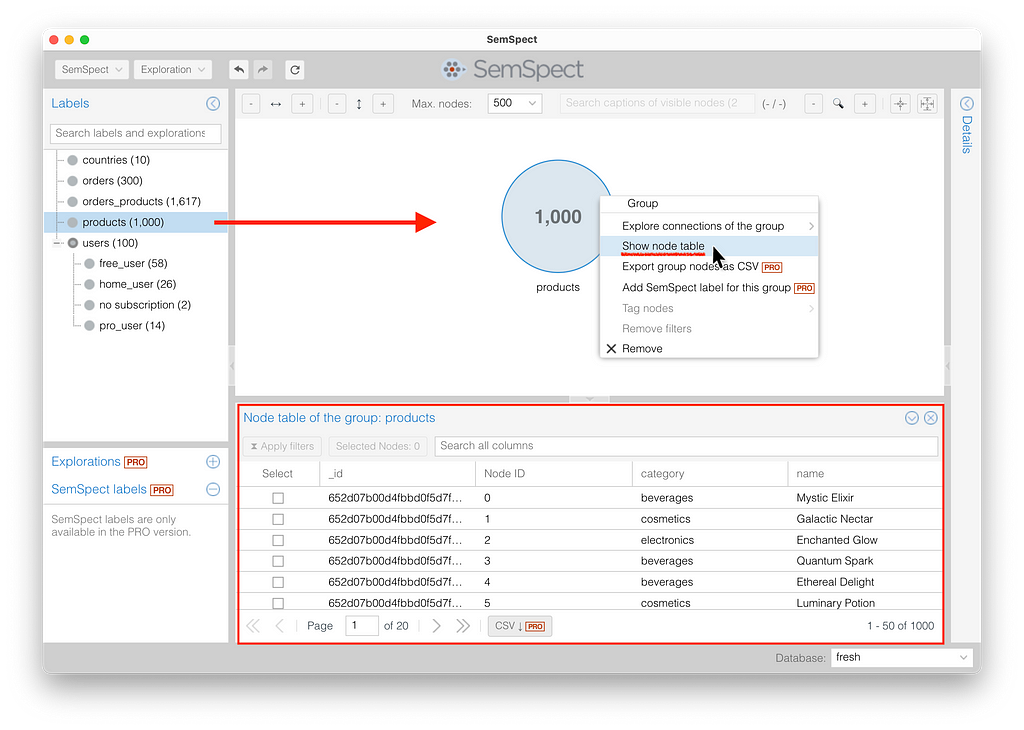
We can also examine the object details in detail and classify them according to specific node property values. Let’s start with the products objects. Upon selection of the products group in the exploration pane, we can open a tabular view that lists all the properties of the group objects row by row.
We can filter the nodes by any property with the help of string, number, or date-time restrictions. As an example, let’s filter for the products of category “beverages.” The table shows a preview of the result and with Apply filters, we can restrict the group in the exploration graph.
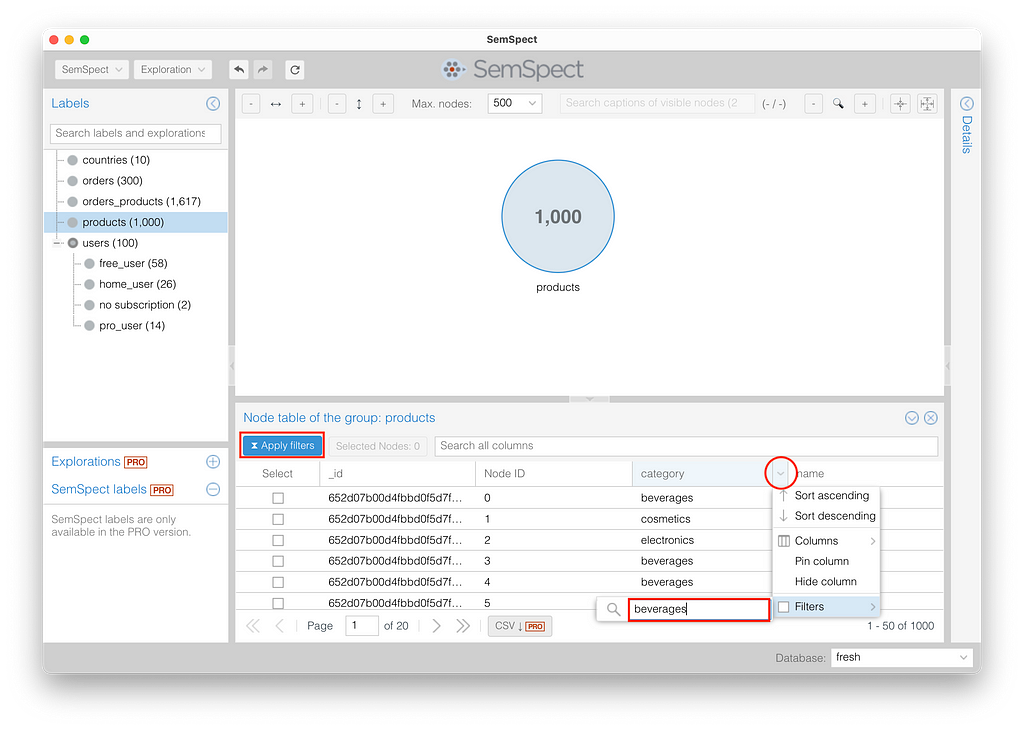
Now, the product group finally consists of only 213 beverages out of 1,000 products.
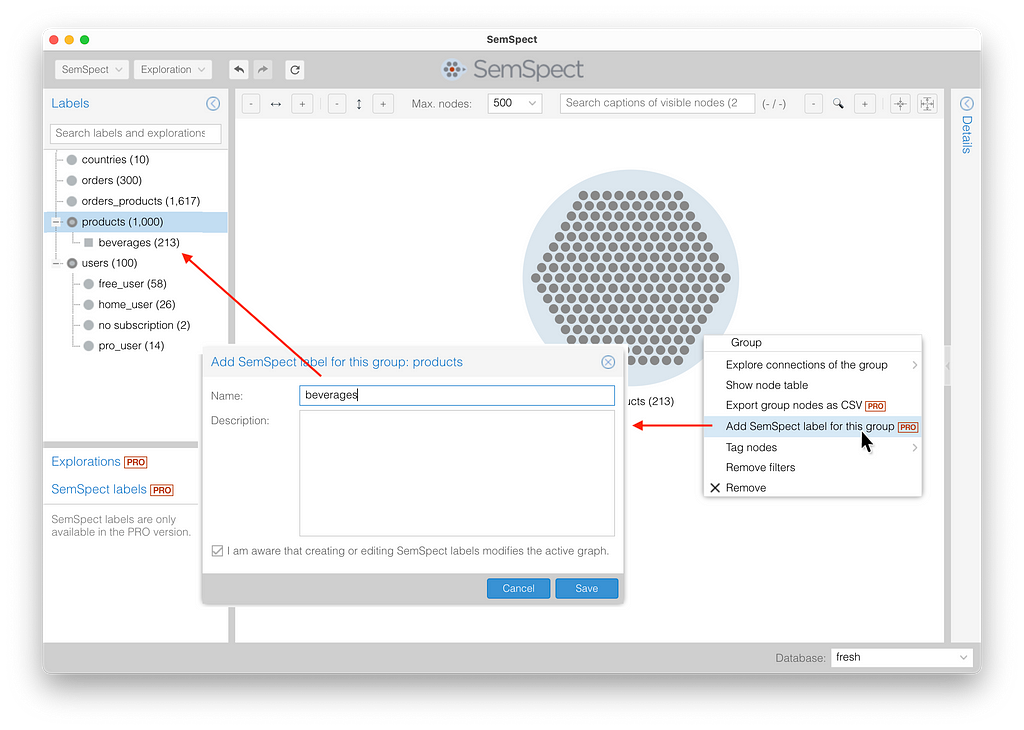
A unique feature of SemSpect allows us to define new labels from groups while exploring the graph. The newly defined label “beverages” is organized as a special kind of product in the label tree, ready to become the start of a new exploration or filter.
What Else Can We Find Out?
Let’s see what other analysis task we can solve with SemSpect. Imagine we want to answer questions like:
- What are the most prominent products ordered from users with free subscriptions in August 2022?
- Are there any users that haven’t ordered anything yet?
The first question can be answered by starting an exploration with “free_user” and expanding over “orders” to eventually “products.” Since we are interested in orders of a particular timeframe, we have to open the tabular view of “orders” and restrict the “orderDate” to before September and after July via the date filter picker.
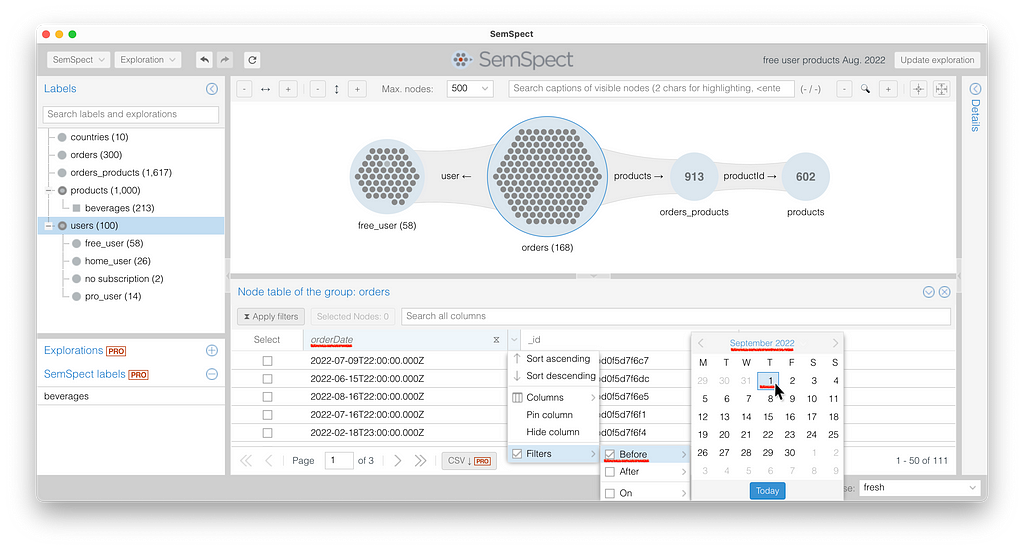
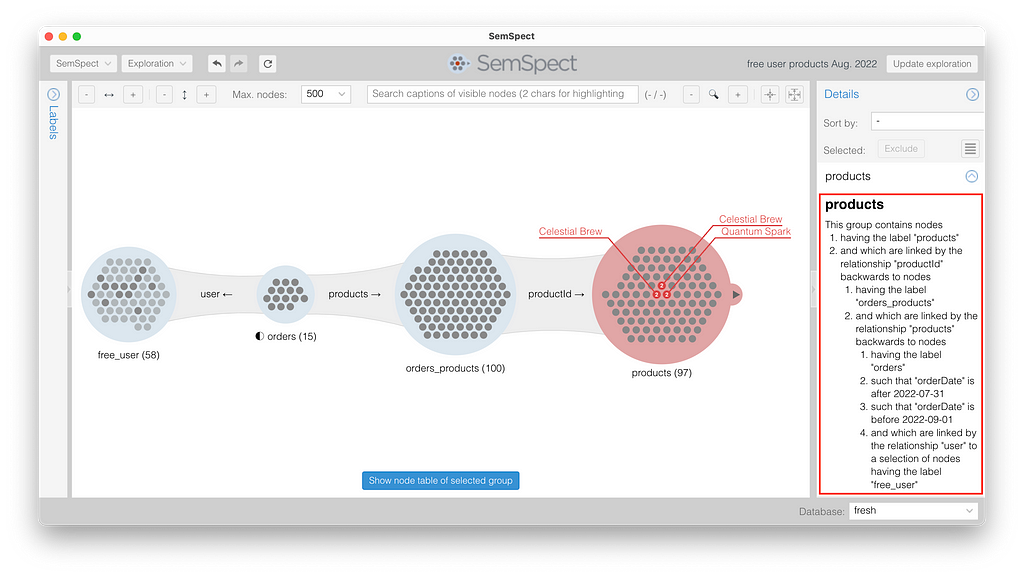
This restricts the orders to August 2022. Since the filter restrictions instantly propagate through the exploration graph, we see three products that have been ordered two times from free-subscription users in August 2022. When selecting the products group, the dossier tab on the right also provides a natural language description that characterizes the group nodes. You can also download this set of result nodes as a CSV file.
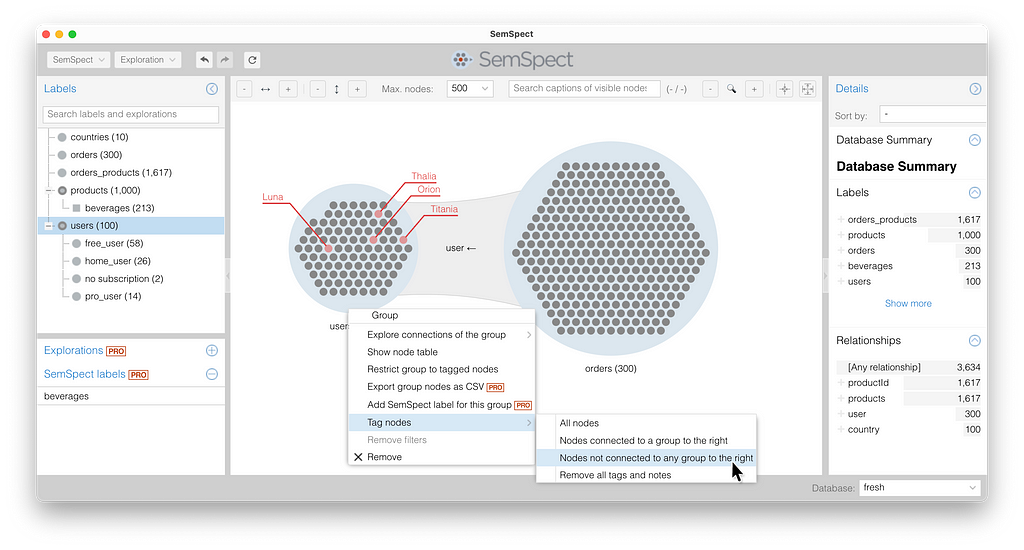
Finally, to find users who have not ordered anything, we have to start with all “users,” then expand to “orders.” The light gray user nodes in the “user” group are those that are not connected to any node in the “orders” group on the right. We can easily give them flags by using the context menu for the “users” group and selecting “Nodes not connected to any group to the right.”
Wrap-up
It is difficult to get an overview and insight into the data of services built on a MongoDB database. This applies to all applications with MongoDB data storage, especially if an object-relational model is used to establish object references between collections, as is the case when adopting the MEAN stack.
We have presented a handy tool kit with the mongo2neo4j data translator, a Neo4j database, and the graph exploration and querying app SemSpect, which establishes a configurable workflow to literally connect the dots buried in your MongoDB database of your MEAN stack. This is key to finding data flaws in your data or application as well as to answer relevant BI questions.
The good news is that the workflow presented here is free. mongo2neo4j and the Neo4j community are both GPL 3.0, and SemSpect comes with a free model. However, when your data grows over a certain size, or you would like to professionalize your workflow, or if you want to enjoy the full performance and functionality, you can switch to the enterprise versions of Neo4j and SemSpect.
Graph Exploration By All MEANS With mongo2neo4j and SemSpect was originally published in Neo4j Developer Blog on Medium, where people are continuing the conversation by highlighting and responding to this story.
Share Article


Explore
Related Articles

Hey LLM, you’re using OPTIONAL MATCH wrong. Here’s the Cypher that actually works.