Visualizing Graph Data With Neo4j Bloom

Consulting Engineer, Neo4j
11 min read

Welcome back to our series on graphs with Scooby-Doo! Turning Your Tabular Data Into a Graph Using Cypher covered how to use Cypher code to turn your CSV data into a graph. In Loading Data Into Neo4j Using pyneoinstance, I described how to take that Cypher code and incorporate it into a Python script to load data into Neo4j with code. If you followed the steps in those tutorials, you should now have a Scooby-Doo graph database. Now we can get to the fun part: data analysis and exploration.
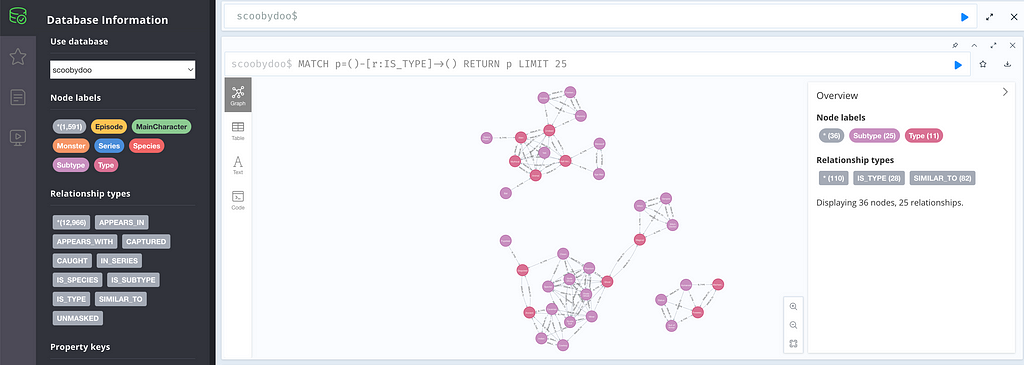
You can visualize your graph in the Neo4j browser, like the image below. This is a good way to quickly see the results of your queries when you are writing Cypher code. But there is an even better way to visualize your data: Neo4j Bloom.
Neo4j Bloom is a low-code visualization tool that allows you to visualize and understand your graph database. You can change the formatting, add custom searches, actions, and expansions, filter and animate the information, and even run graph data science algorithms. Here, we will explore how to use common Bloom features to visualize the ScoobyGraph.
Neo4j Bloom is available on Neo4j Desktop by opening the Neo4j Bloom tool, and in Neo4j Aura by going to the Explore tab.
If You Want to Start With My Perspective File
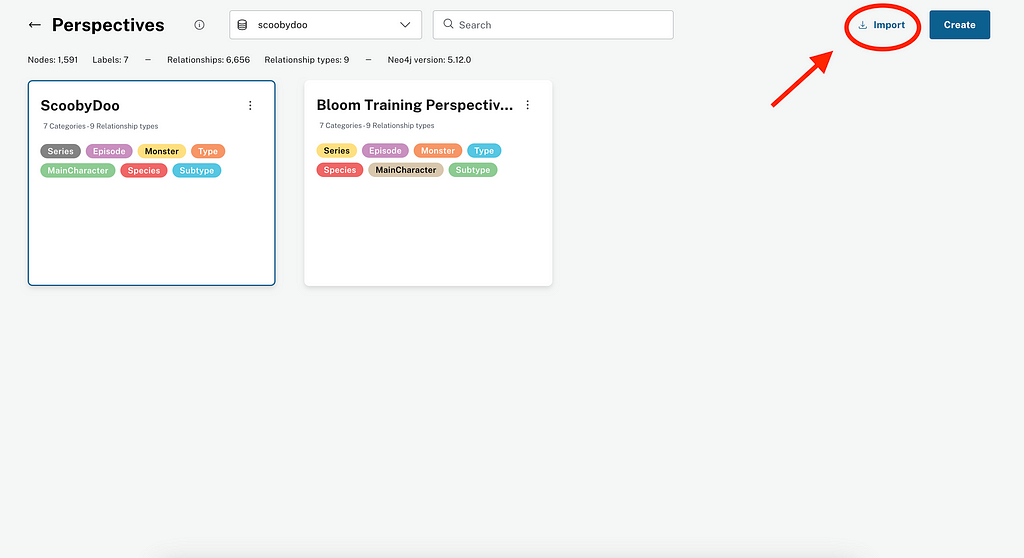
This tutorial will walk you through building aspects of your perspective from scratch, but you can use my pre-built perspective by downloading the ScoobyDoo.json file from my GitHub. Then you can upload it by going to the perspective menu and clicking Import, then importing the JSON file. The perspective JSON in my GitHub does have additional custom Cypher beyond what I cover in this article.
Creating and Formatting a Graph Visualization
Creating a Perspective
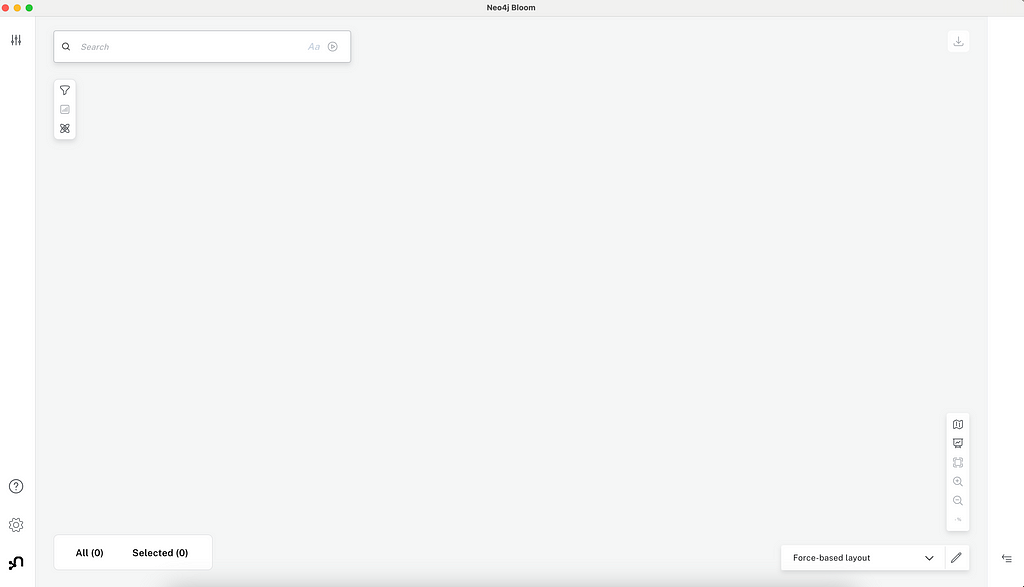
When you open Bloom, you will see a blank scene. A scene is the data in your visualization.
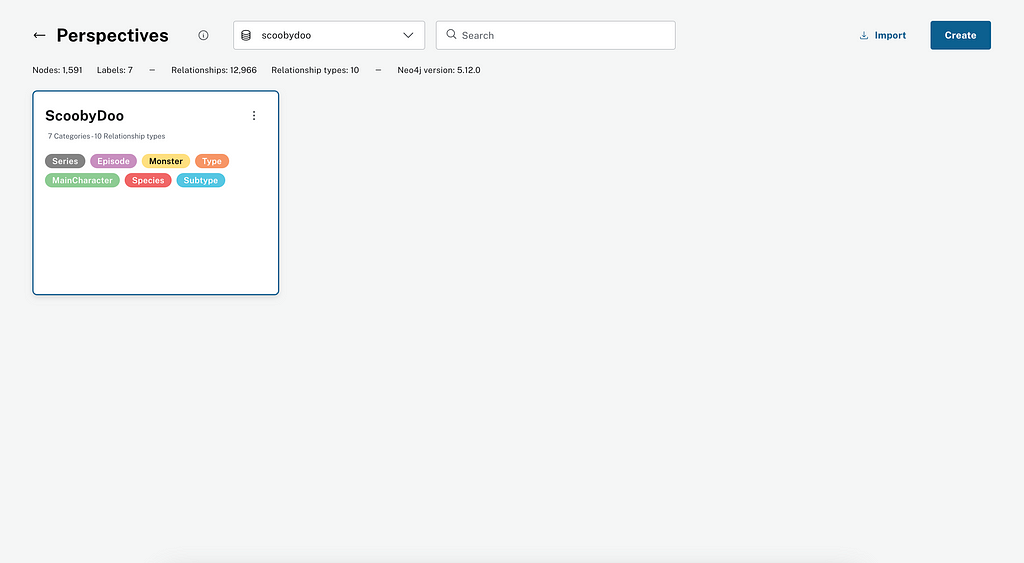
To see your perspective drawer, click on the icon in the top left of your screen, then click the link to access your perspectives.
This menu shows you what perspectives you have in Bloom. A perspective saves your visualization information, including your categories, formatting, saved searches, scene actions, and more. Click on your perspective card to return to your Neo4j visualization.
Adding Categories and Relationships
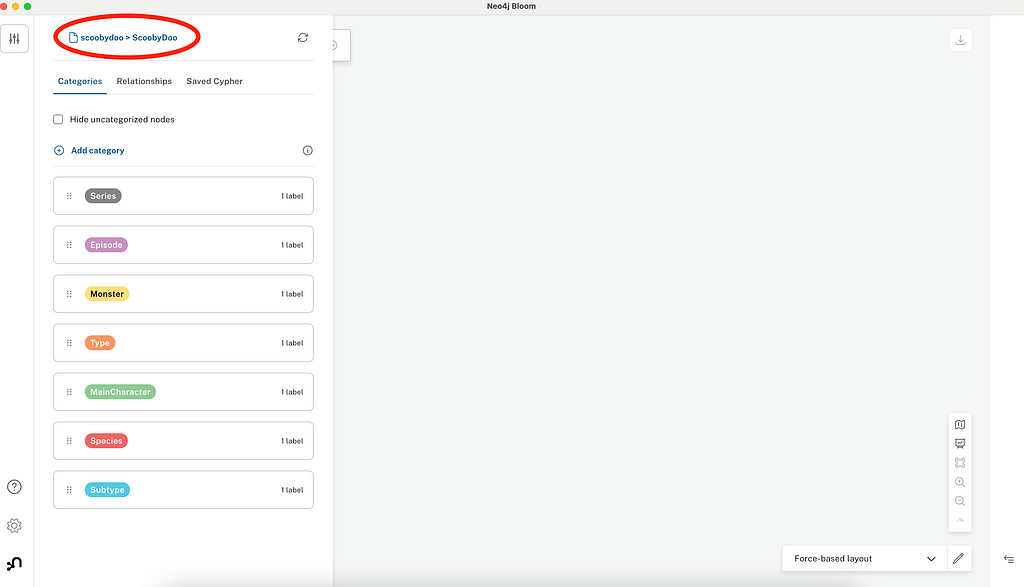
When you are in your perspective, click the top-left button again to access your perspective menu. This is where you can add or remove categories for your visualization. In this example, we have all the labels from our database in the Bloom visualization. You can choose which labels (nodes) to include (e.g., Monster, Series) and which properties of those nodes should be included in your visualization.
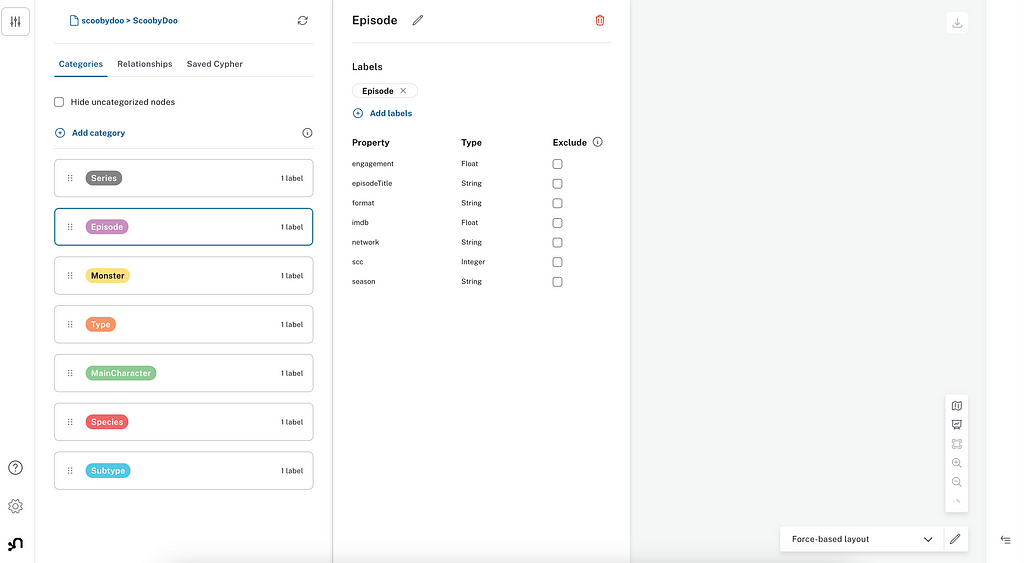
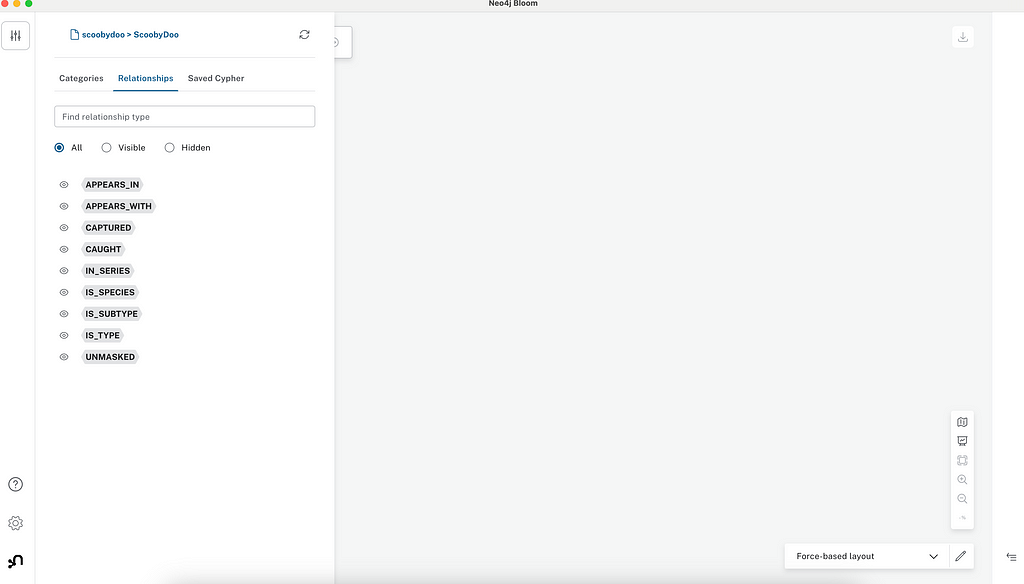
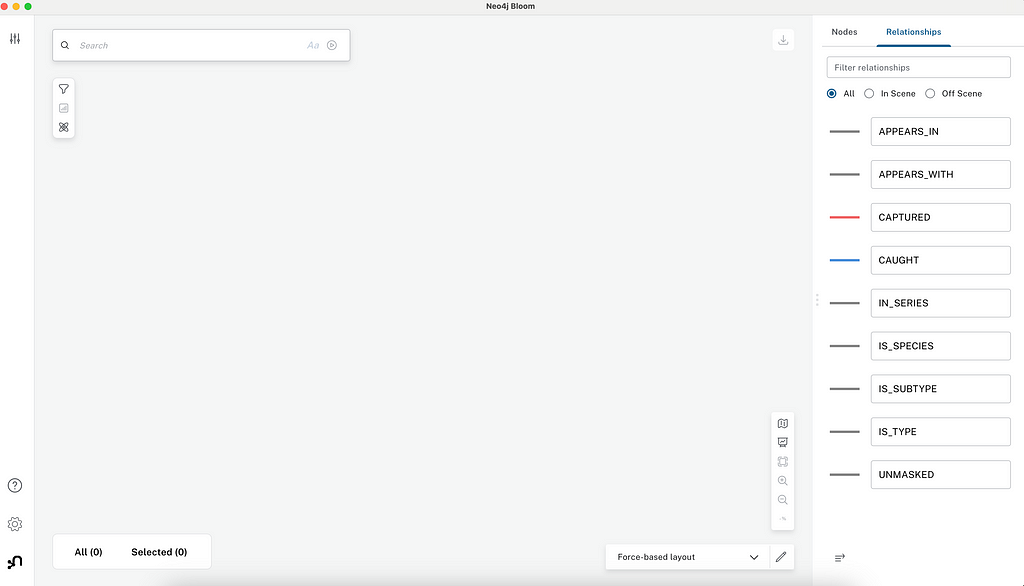
If you go to the Relationships tab in the Perspective menu, you can also choose which relationships you want to include or hide. Once you have chosen which categories and relationships to include/exclude, we can format the graph.
Formatting Your Categories and Relationships
Click on the arrow with lines on the bottom right of your scene to access the formatting menu.
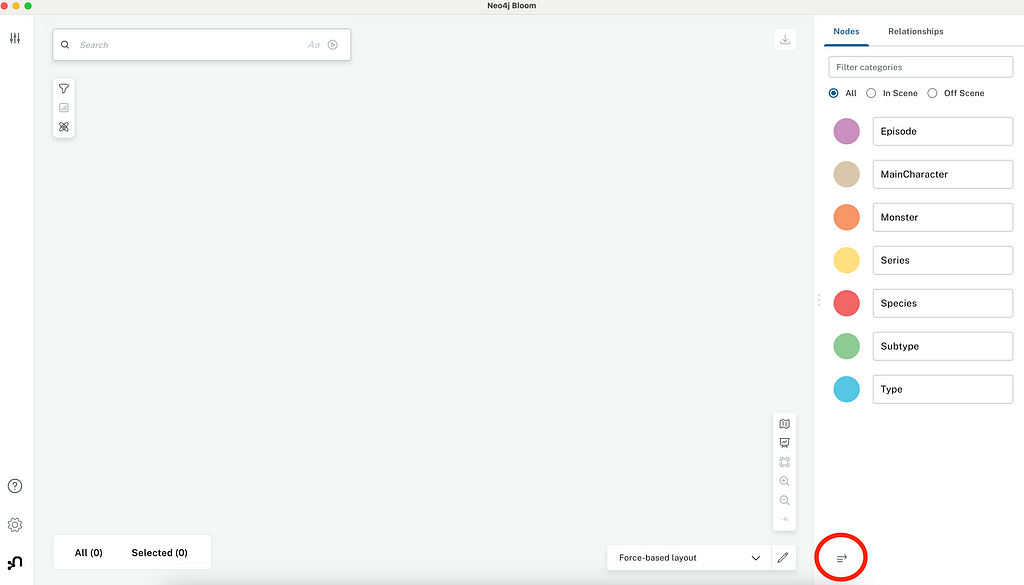
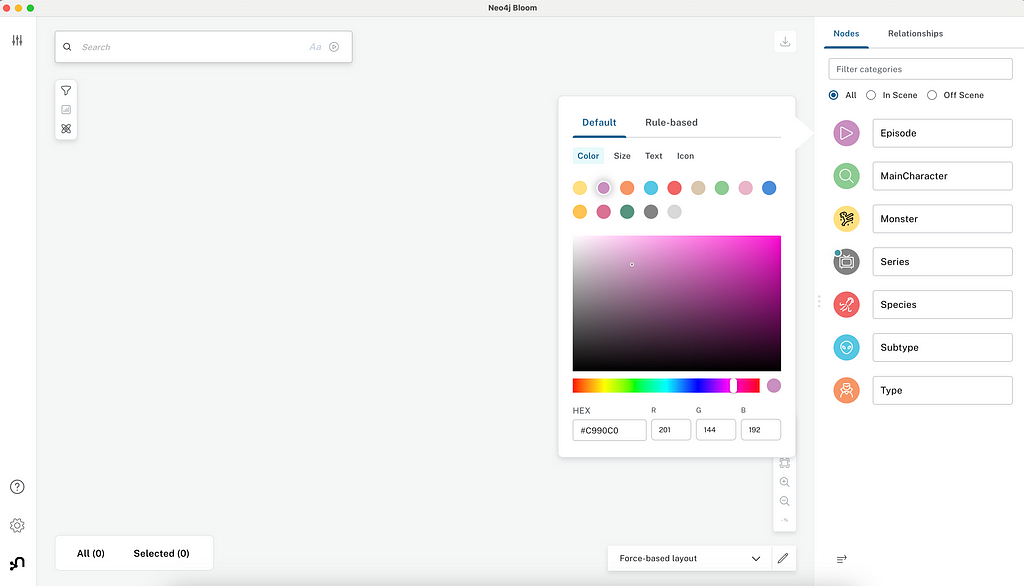
In the formatting menu, you can see all the categories on the right side. You can click on each circle to make edits to the formatting for that category. You can choose colors, what text to show on the nodes, the size of the nodes, and even icons for each category.
If you switch to the Relationships tab, you can access the formatting for relationships. Just like categories, you can choose the color, text, and size of the various relationships. In this example, I chose to make captured and caught different colors to emphasize the difference between the two: main characters are captured by monsters, while monsters are caught by main characters.
With this formatting, the graph will be easier to understand and more visually appealing. Let’s add data to the visualization.
Adding Data to the Graph
The most common way to begin adding data through the graph is through the search bar at the top left of the scene.
Graph Pattern Searches
One of the easiest ways to explore the information in your graph with Bloom is through graph pattern searches. Graph pattern searches look for patterns in your graph: for example, Episode -[:IN_SERIES] -> Series. Pattern queries are easy to run and don’t require any knowledge of Cypher code. Click inside the search bar and you will see a drop-down with multiple options that correspond to the labels in the ScoobyGraph.
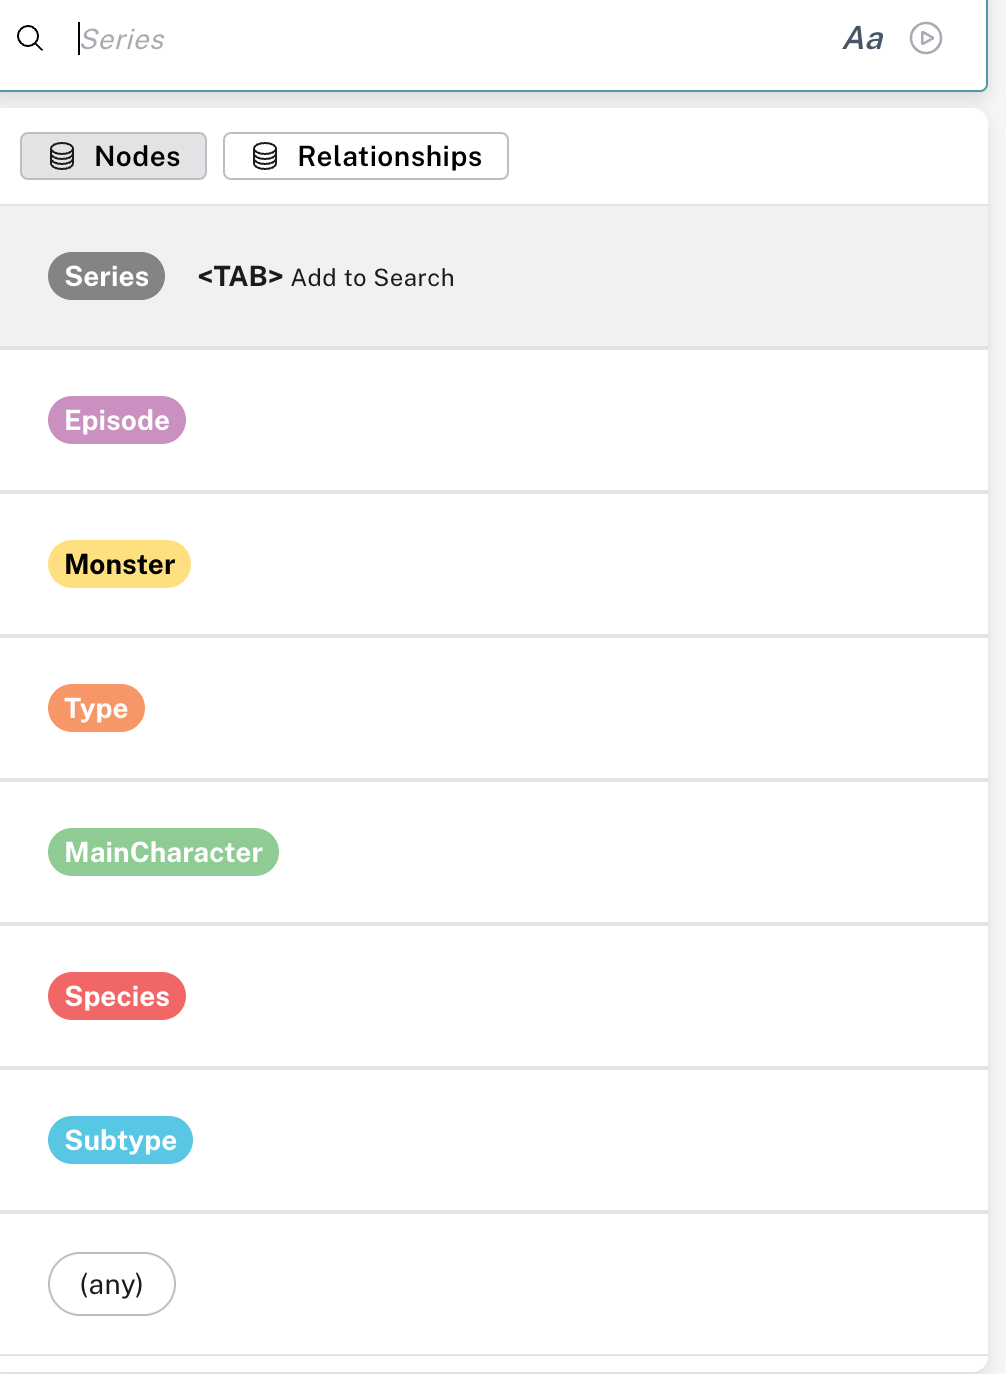
Let’s begin with a visualization of Series and Episode. If you go into the search bar and click Series, any, Episode, then press Enter, you will see Series — (any) — Episode in the bar, and you will see the series and episodes in your Bloom scene.
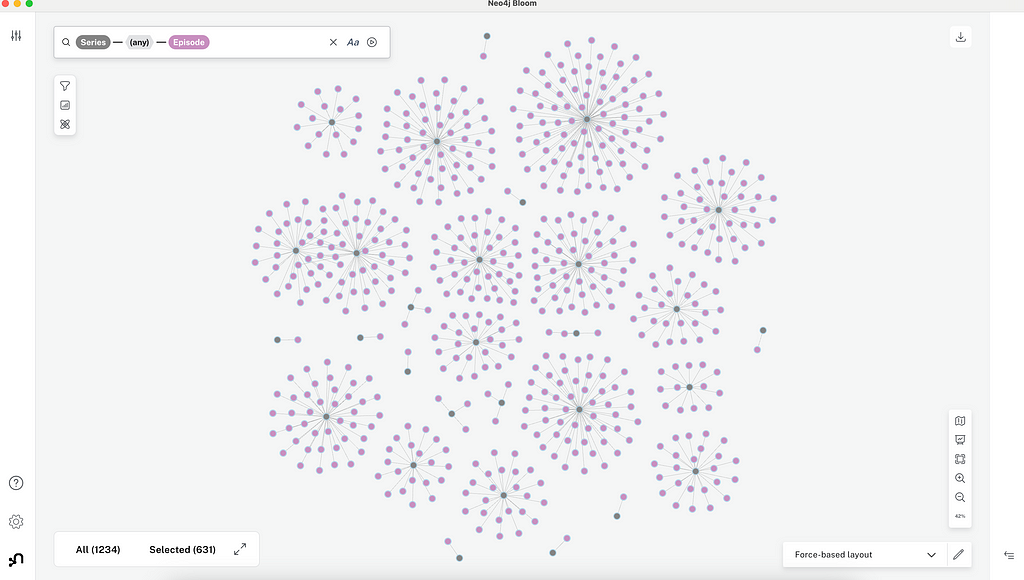
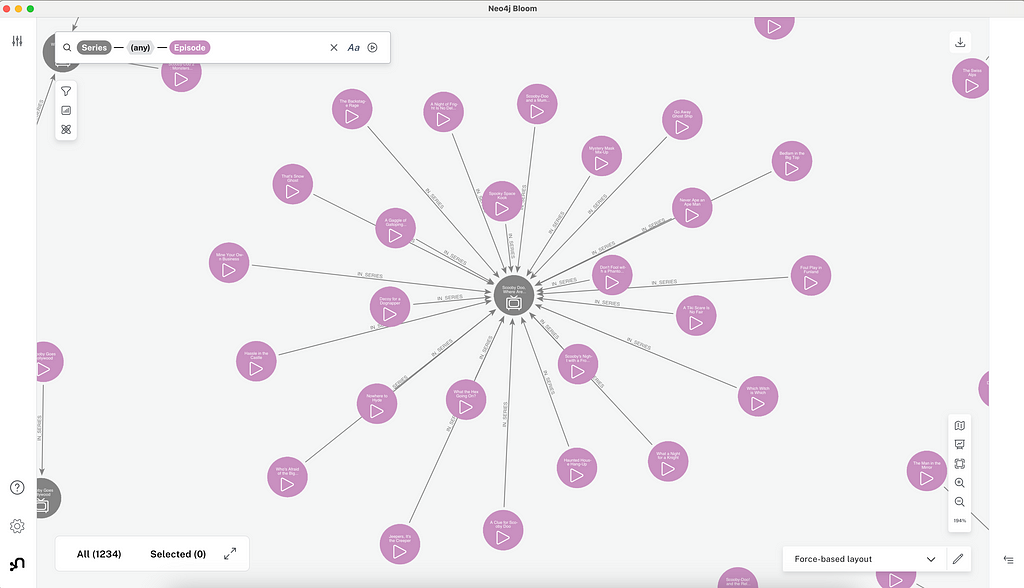
If you zoom in, you can see the series and episode names in more detail.
To clear the results in your scene, right-click on the scene and click “Clear Scene.”
You can also add parameters to your graph pattern searches. For example, we can find monsters that are part of the subtype that has a type of Ghost with the graph pattern search below. After selecting the Type category, you can select the name property and then type “Ghost” to query this pattern in the graph.

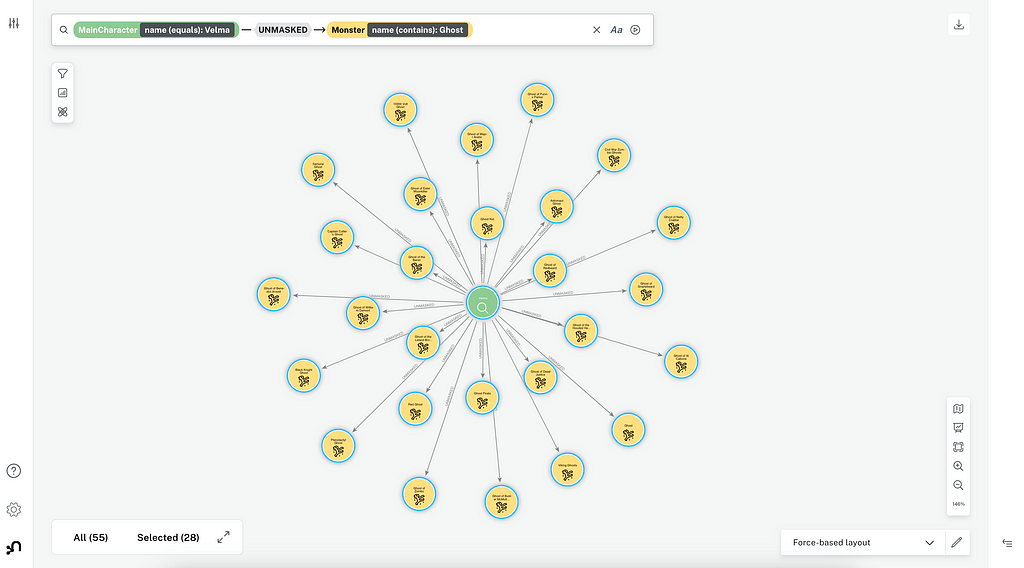
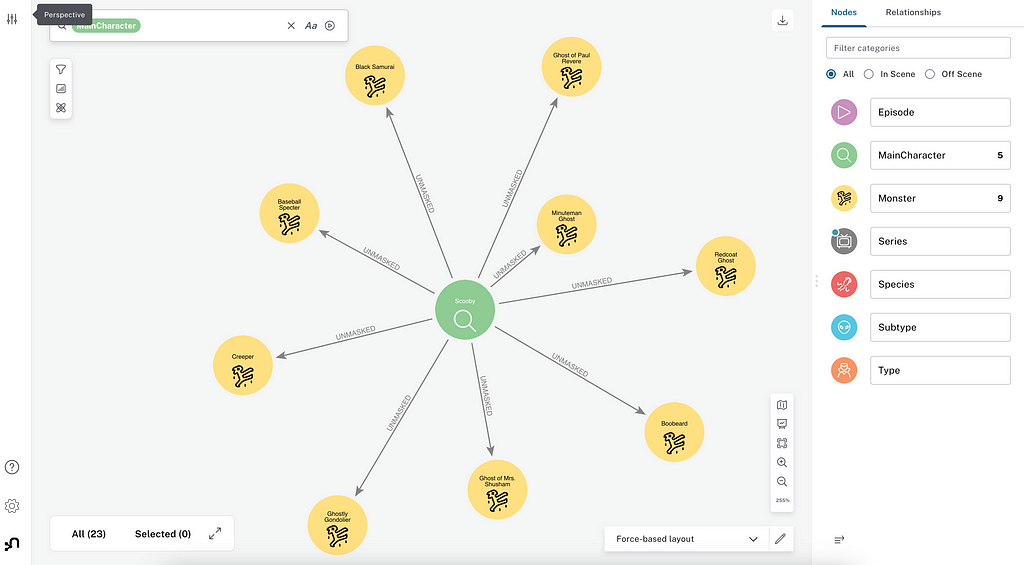
The graph pattern search parameters don’t have to be exact matches either. We can use a similar search pattern to find all the monsters that Velma unmasked where the monster has “Ghost” in its name by choosing name (contains) instead of name (equals).

This query returns the Velma node and all the monsters she unmasked whose names contain “Ghost.”
Custom Search Queries
Graph pattern queries are very useful, but sometimes you may need a different kind of search. It may not be a pattern search, or you may want to run it multiple times without writing out the pattern. You may even want to run the same query multiple times with different parameters — if you wanted to have a query where you could choose a main character to find out which monsters they unmasked, for example. This is where custom search queries come in.
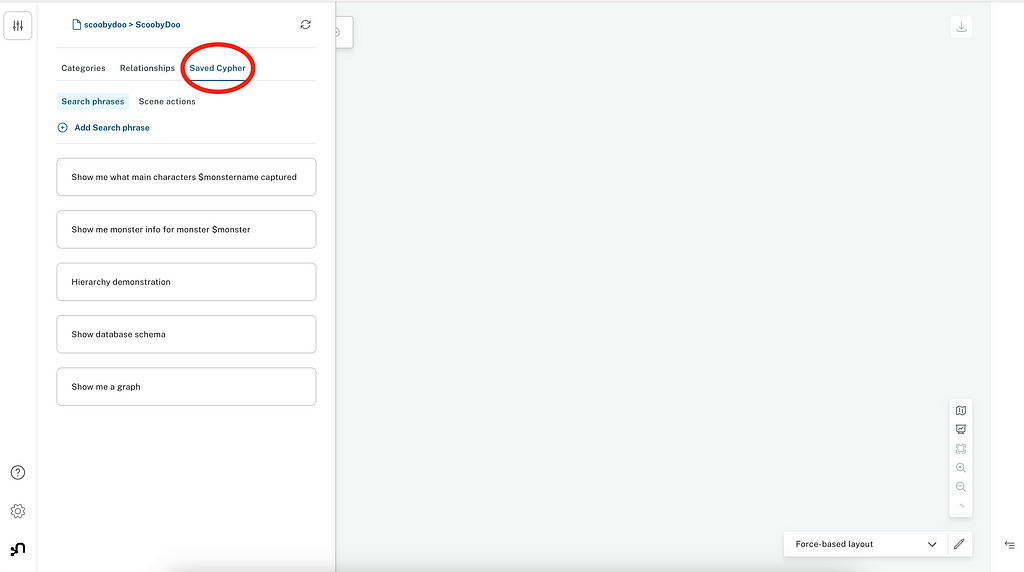
Custom search queries allow you to create a search phrase that runs Cypher code in the background. You can create saved Cypher queries by going to the Perspective menu on the left and clicking the Saved Cypher tab.
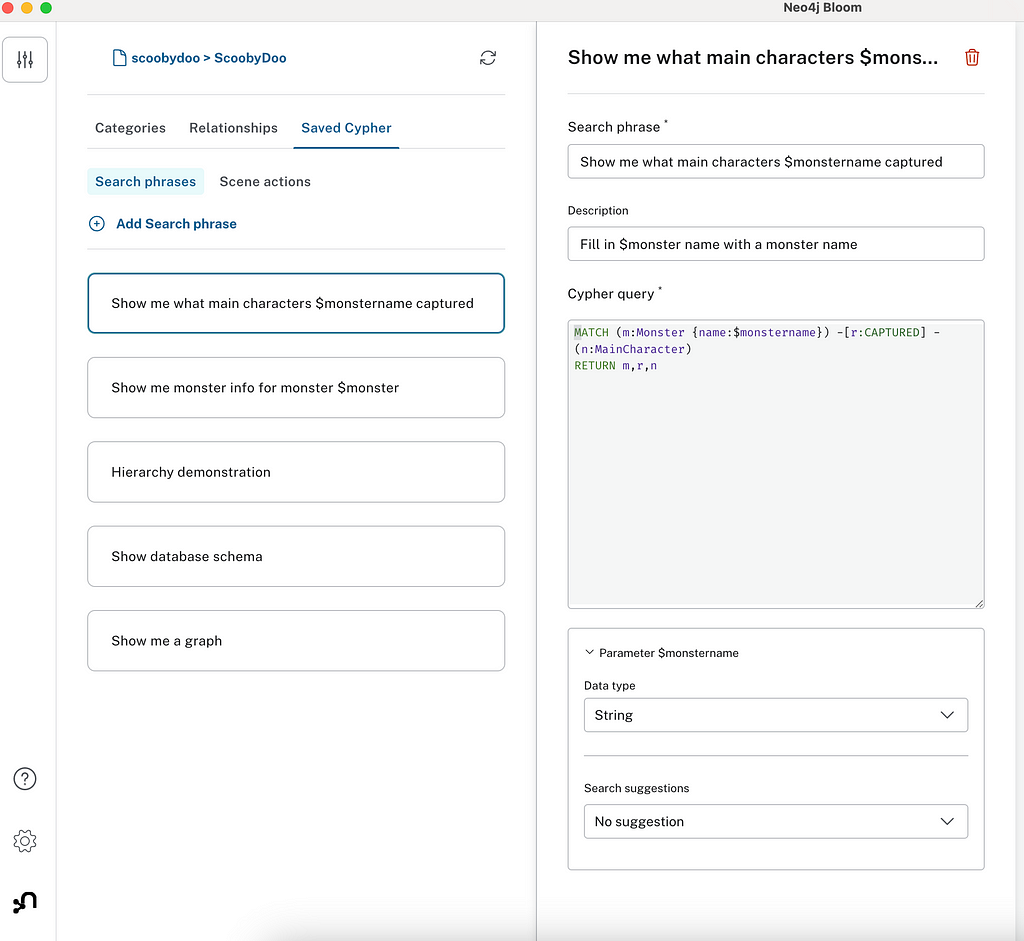
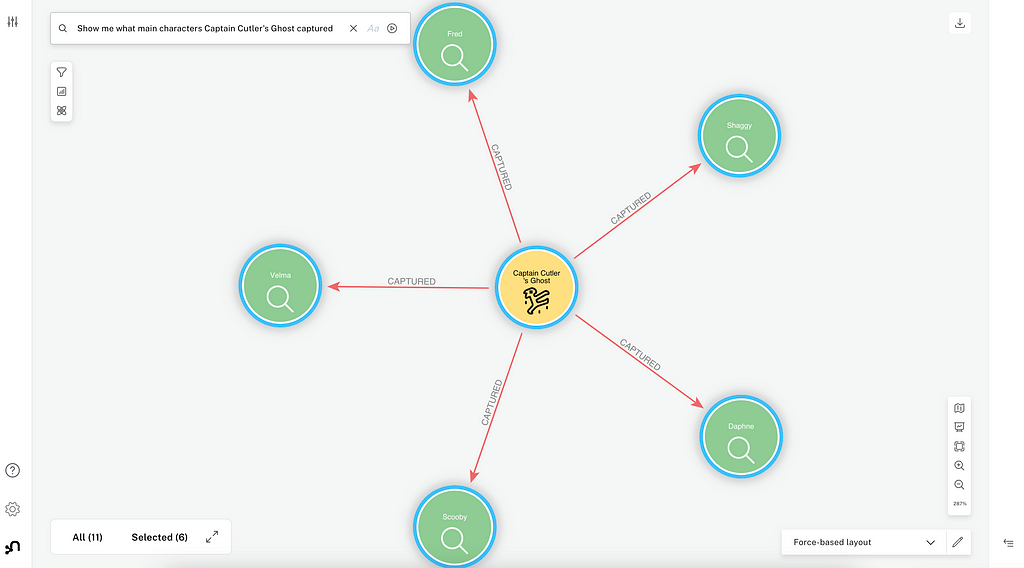
To create a saved search phrase, click Add Search Phrase under Search phrases. Put the phrase you want to show in the search bar under Search phrase. The Cypher code goes in the Cypher query box. You can indicate user input in the search phrase with a dollar sign. Below is an example for a saved search phrase that allows you to input the name of a monster, and it will return the main characters that monster captured.
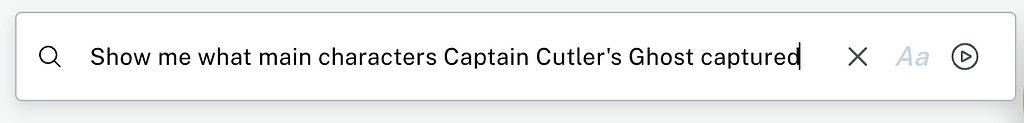
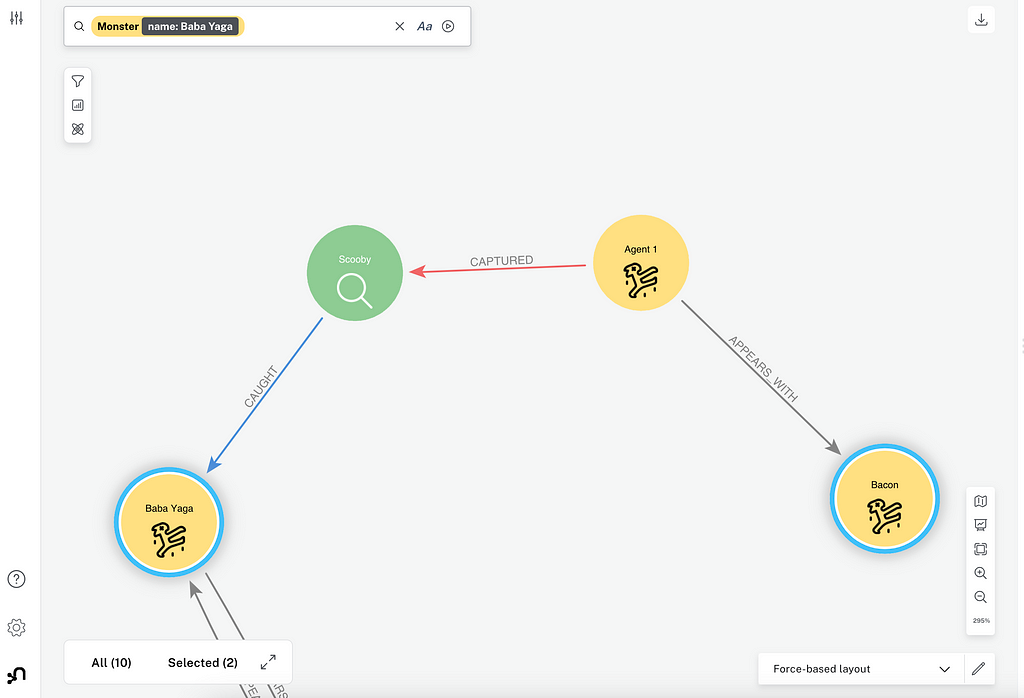
To use the search phrase, I can choose it from the search drop-down or begin typing the phrase. I put a monster name where the parameter is in the search phrase.
When I run this query, it gives me the results for the monster name I input into the search phrase.
Graph pattern searches and custom search phrases are powerful ways to add data you want to visualize to your scene. Now that you know how to identify patterns and add data, we can move onto filtering and animations.
Filtering and Animating the Graph
Just like any data visualization, once you add a large amount of complex data to your scene, it becomes more difficult to understand and harder to locate specific information. This is where filters and slicers can make understanding the graph much easier.
Filters
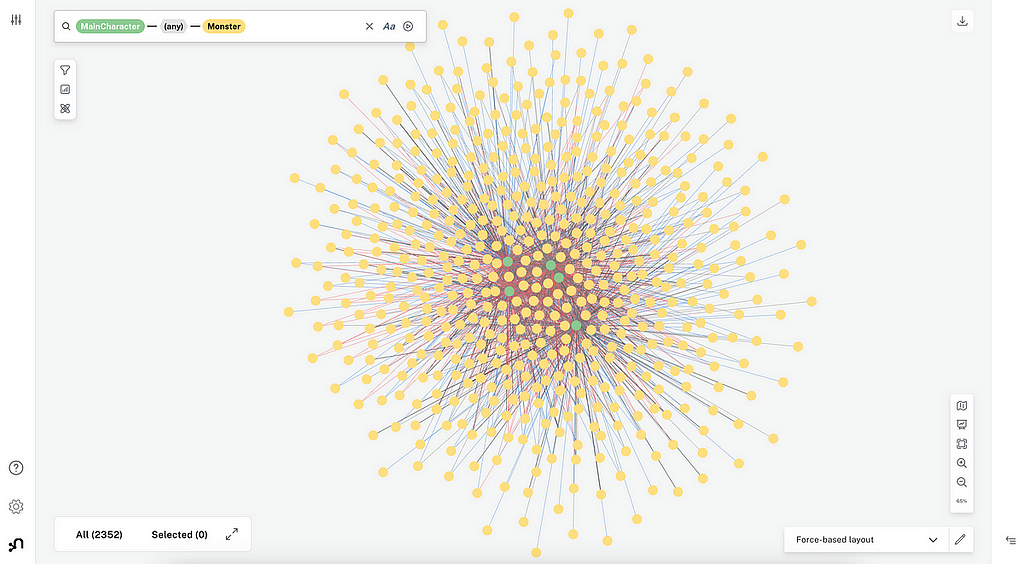
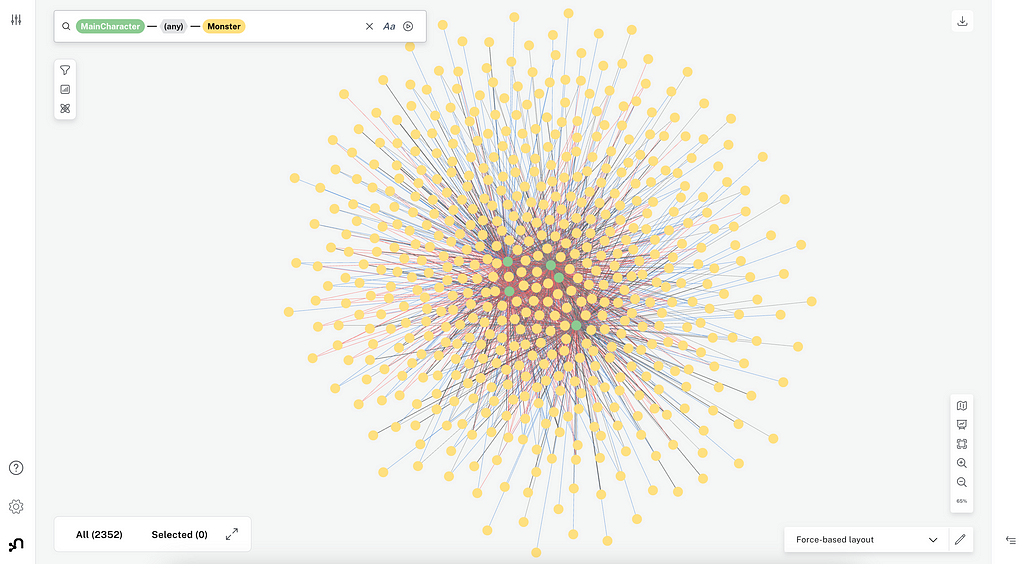
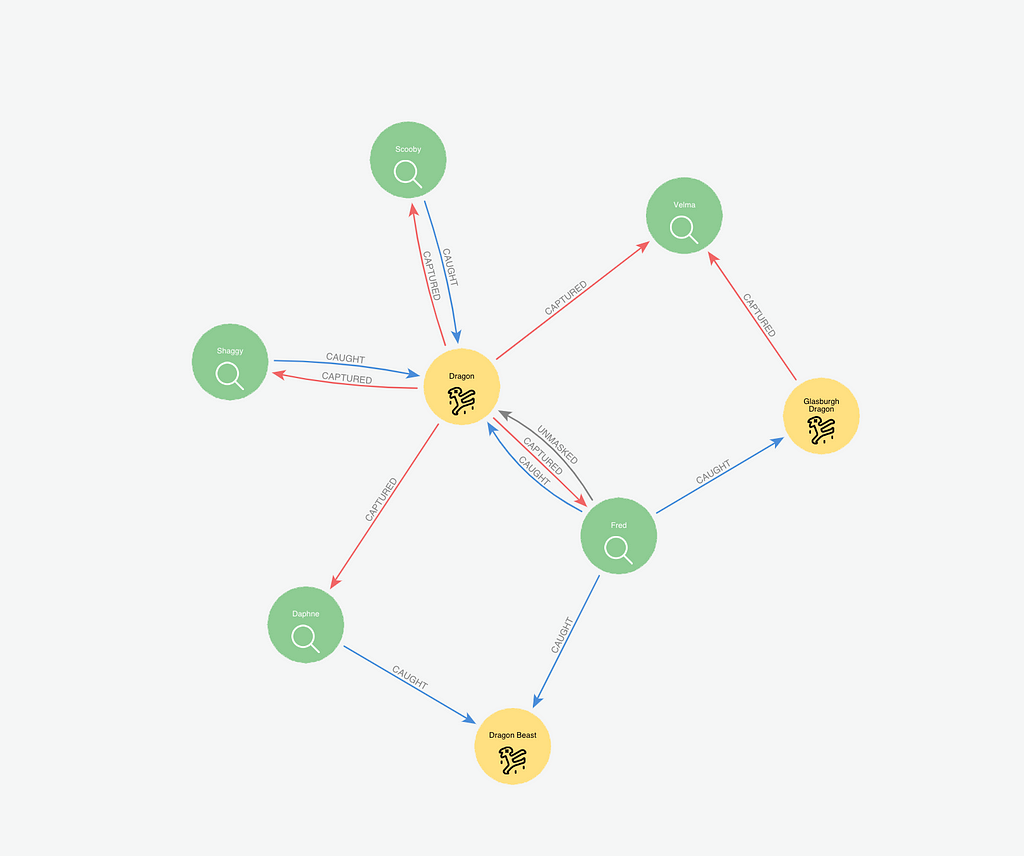
Filters help you isolate important information in your graph. Let’s start with a graph of all the interactions between the main characters and Monsters. This visualization has many nodes and relationships, and I can locate specific data using filters.
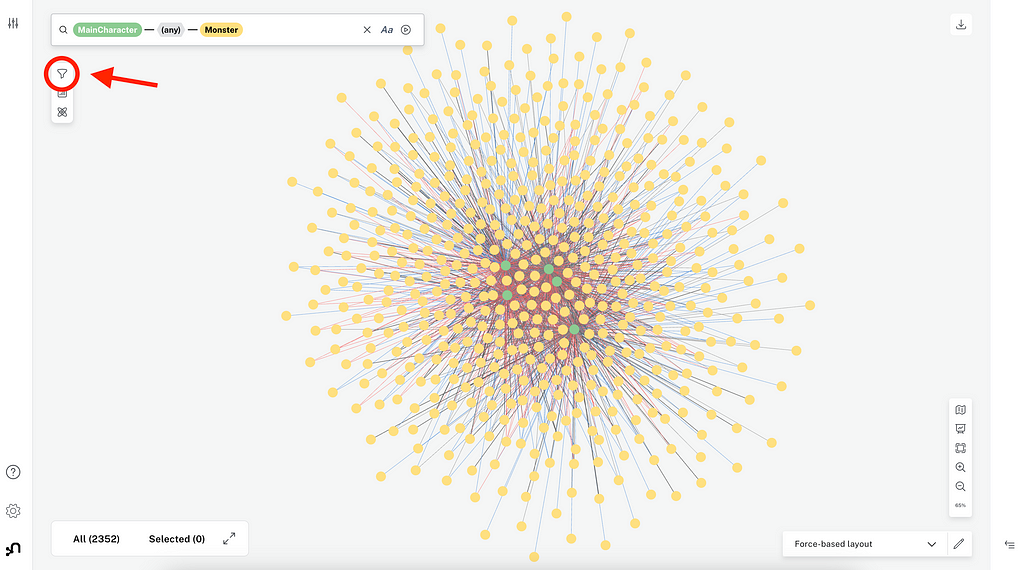
To create a filter, click on the filter icon in the small menu on the upper left-hand side of the scene.
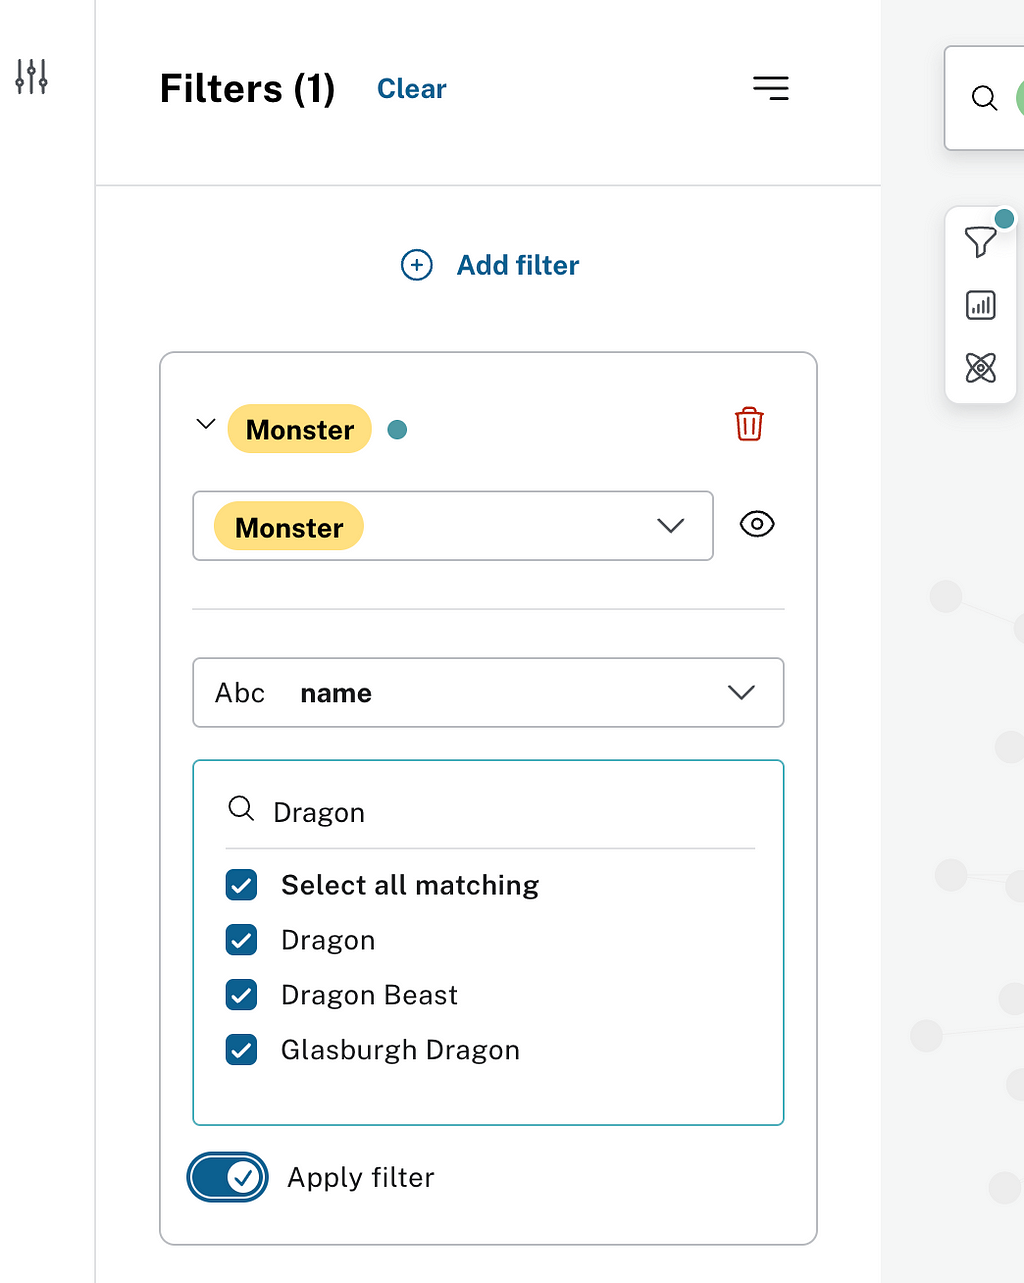
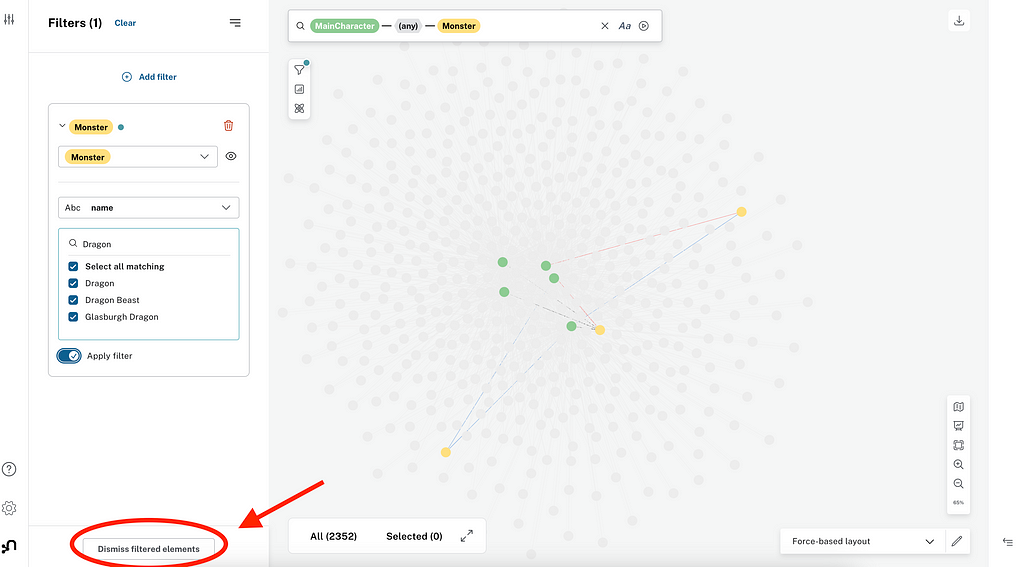
In the filter menu, you can choose a category to filter, then a property to filter on. To start, we will choose Monster and name. Because name is a string property, you will see a drop-down with all the unique monster names. I can filter this list by typing in the search box. If I want to find all monsters whose name contains the word “Dragon,” I can type “Dragon” and select all matching.
Once I check the Apply filter, the scene highlights the information I selected and grays out all the other nodes in the graph. The filtered nodes are not removed unless I click Dismiss filtered elements on the bottom left.
If I dismiss the filtered elements, I am left with the monsters I selected in the filter.
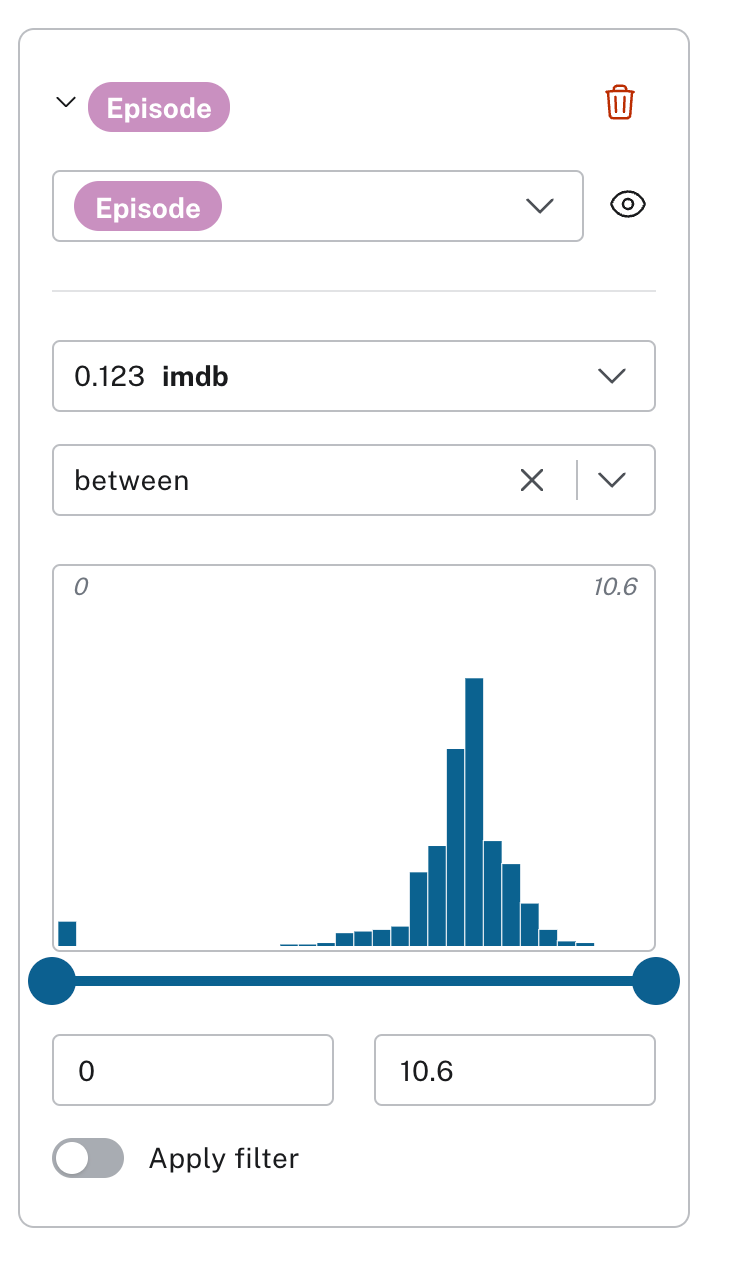
We can also use filters for other types of properties, like the IMDb property on the Episode category. If the property being filtered is numeric, the filter will also show a distribution of the values.
Animation With Slicers
In addition to filters, numeric or date variables can also be filtered with a slicer. You can find the Slicer button in the same menu as the Filter button.
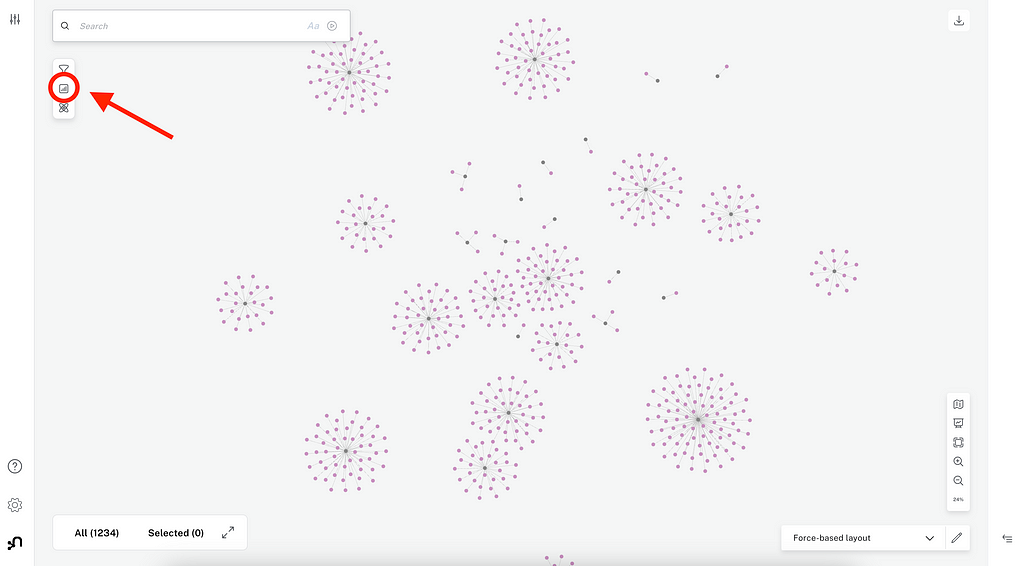
In the slicer menu, you can click Add range and choose a property for the Slicer. Once you add a property to the Slicer, you can see a histogram of the distribution just like the one available with the Filter. You can move the window to filter the nodes in the graph. However, unlike filters, Slicers also allow you to create a moving animated window that shows changes in the graph as the value of the property changes.
The slicer animation can be changed to slide from the beginning to the end, as shown above, or the window can stay the same size and slide across the histogram. You can also set the window and have the animation only scroll within that window, as opposed to the whole range of values. This is a powerful tool, especially with date properties.
Expanding the Graph
The last key graph exploration piece is expanding the graph. Often you may want to follow the relationships from the nodes in the graph to discover what nodes are connected to the nodes already in your scene. We can do this by expanding the graph with expansions, paths, and scene actions.
Expansions
The easiest way to expand a graph is through the Expand command. You can expand a node or group of nodes by right-clicking on the selected nodes and hovering over Expand.
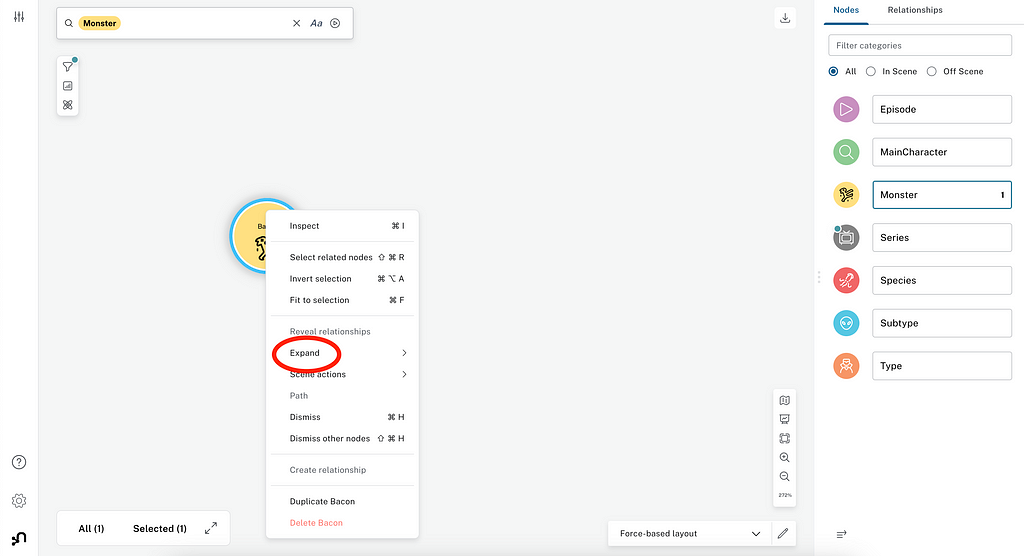
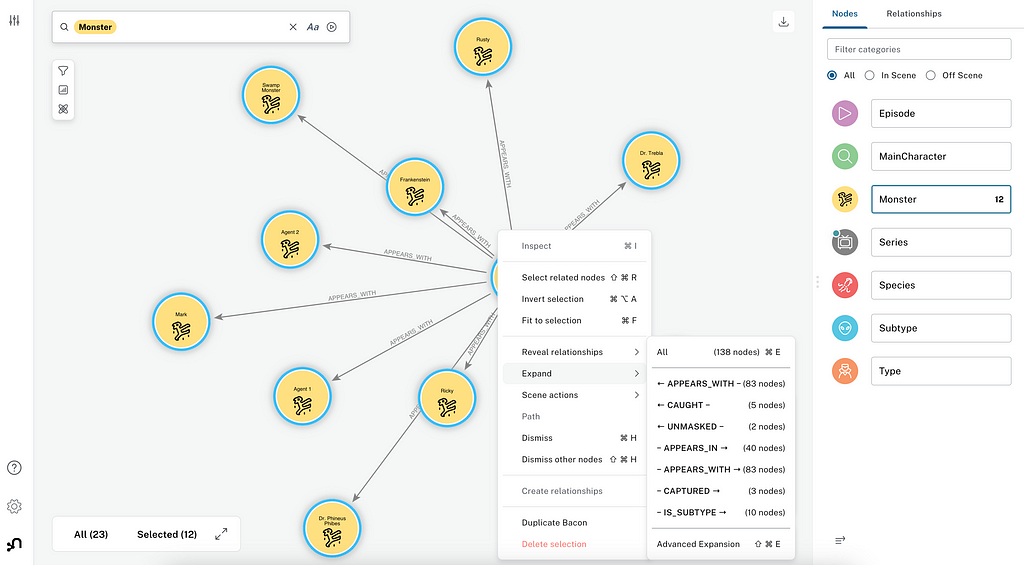
When you hover over the Expand option, you can see all the relationships the selected node(s) have. You can choose to expand all relationships or just the relationships you are interested in. You can even choose Advanced Expansion to tailor your expansion even more.
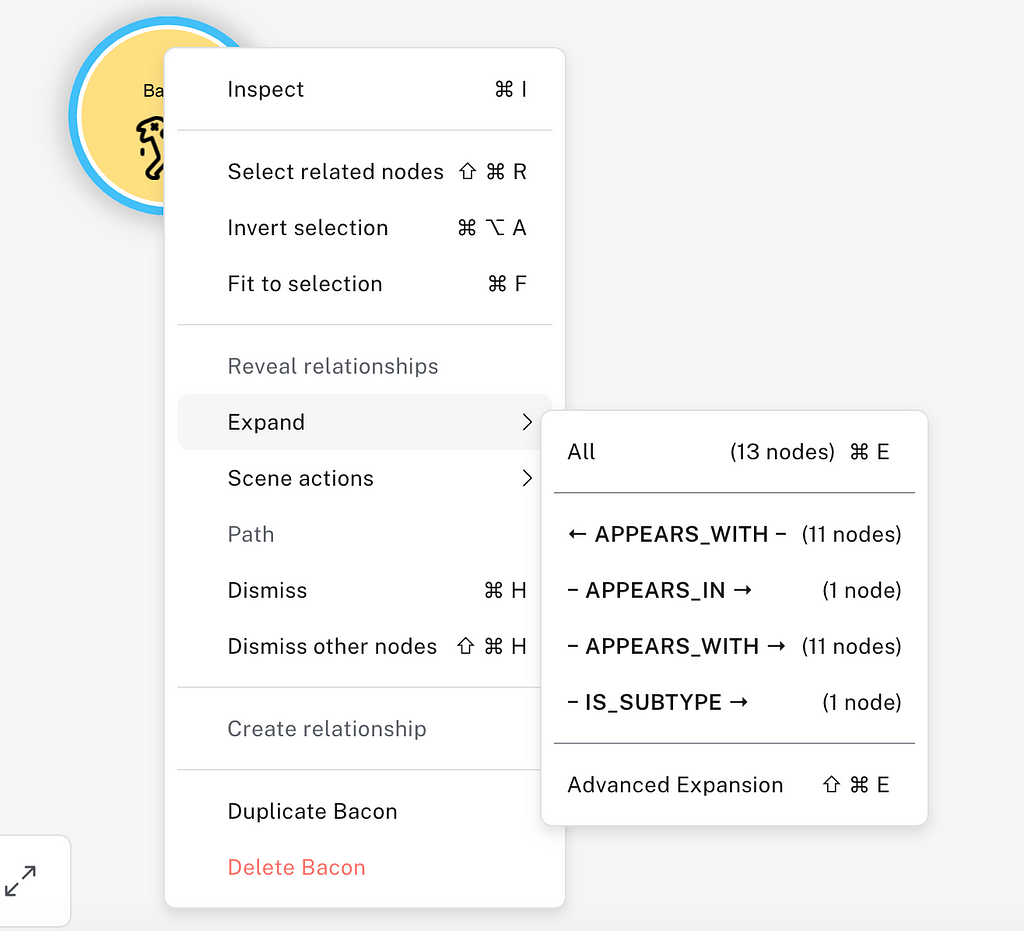
In the picture above, you can see the Expand options for the node for the monster Bacon (yes, there is a Bacon monster). You can see that the Bacon monster has 11 outgoing and 11 incoming APPEARS_WITH relationships, one APPEARS_IN relationship, and one IS_SUBTYPE relationship. I will choose the APPEARS_WITH -> option to see the monsters that appear in the same episode as Bacon.
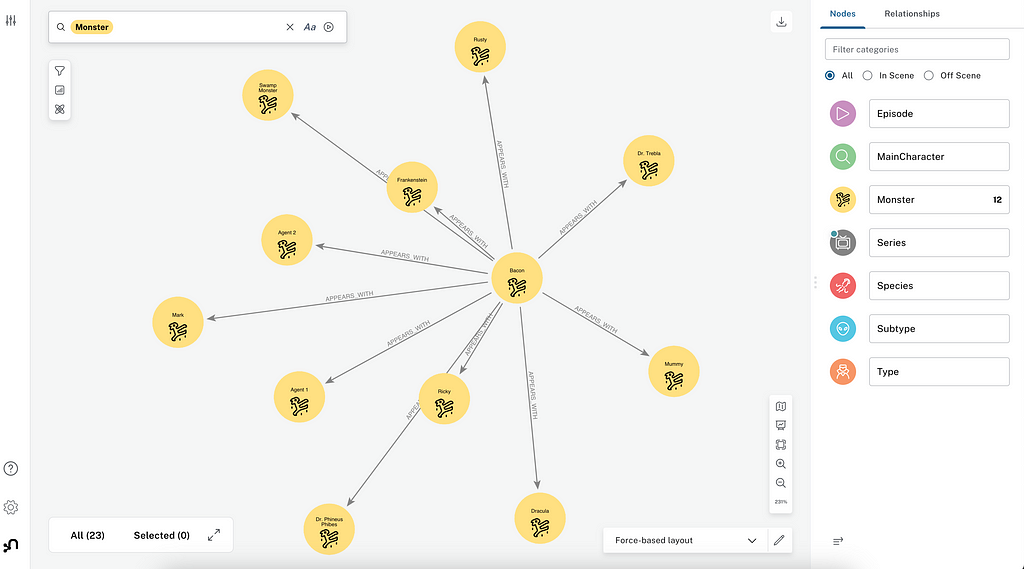
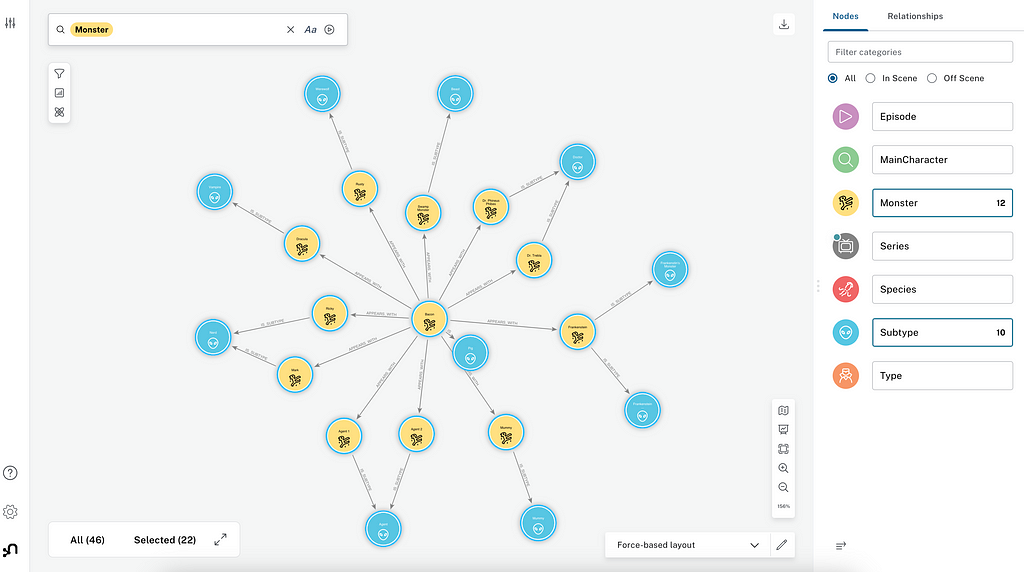
To add the subtypes for these monsters, I could further expand this graph to see all their subtypes by choosing all the monster nodes, right-clicking, going to Expand, and choosing IS_SUBTYPE.
This will add all the subtypes for these monsters to the scene.
Paths
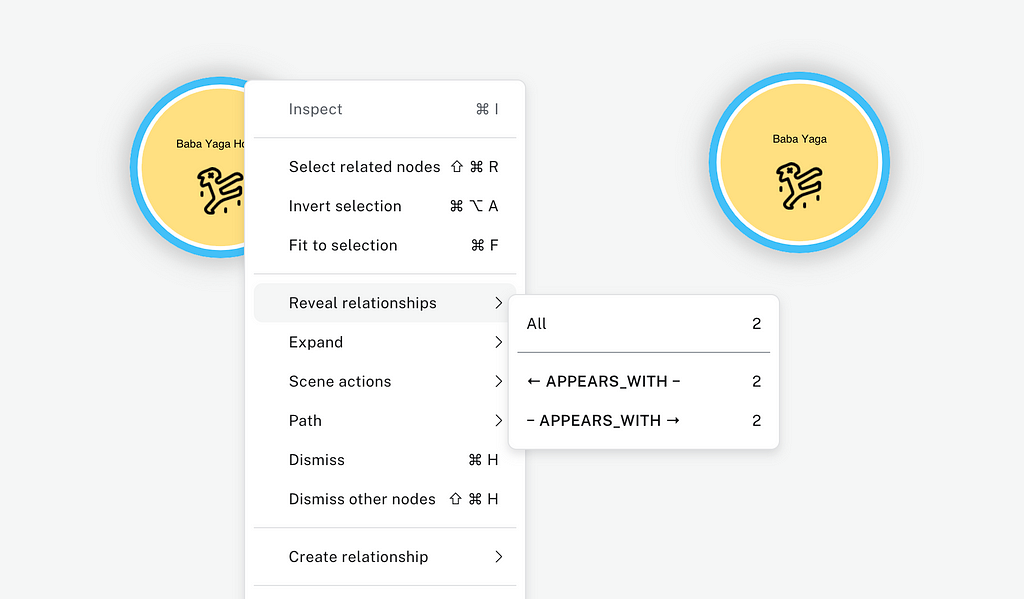
Expansions are helpful but only allow you to traverse the graph one level of relationships at a time. What if I want to find the connection between two nodes in my scene? I can do this by selecting both of the two nodes I want to connect and right-clicking on one of the nodes.
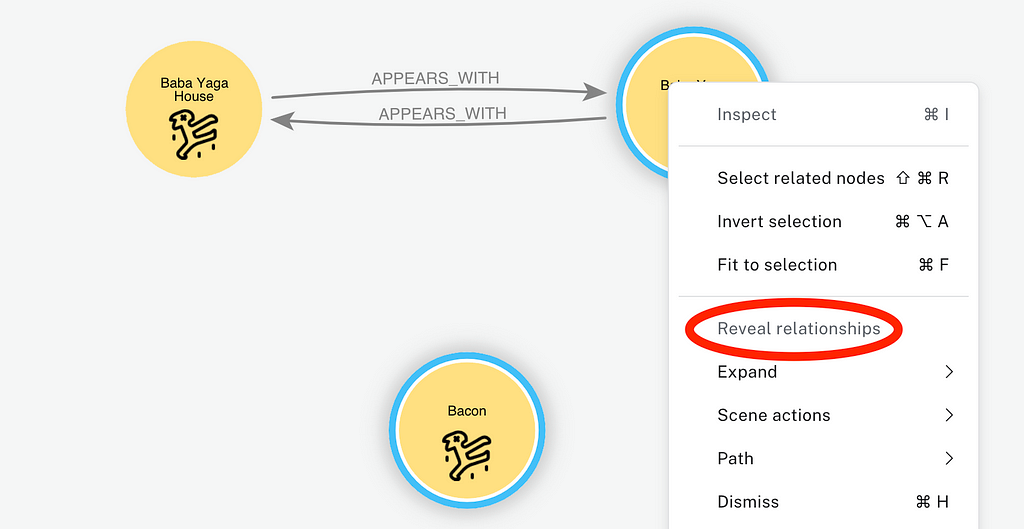
I can look for the Reveal relationships option to find relationships that directly connect the two nodes. If there are any relationships between the two nodes that are not in my scene, I will be able to see the relationships with this option.
If I choose the Reveal relationships option, I will see the relationships between the nodes I selected.
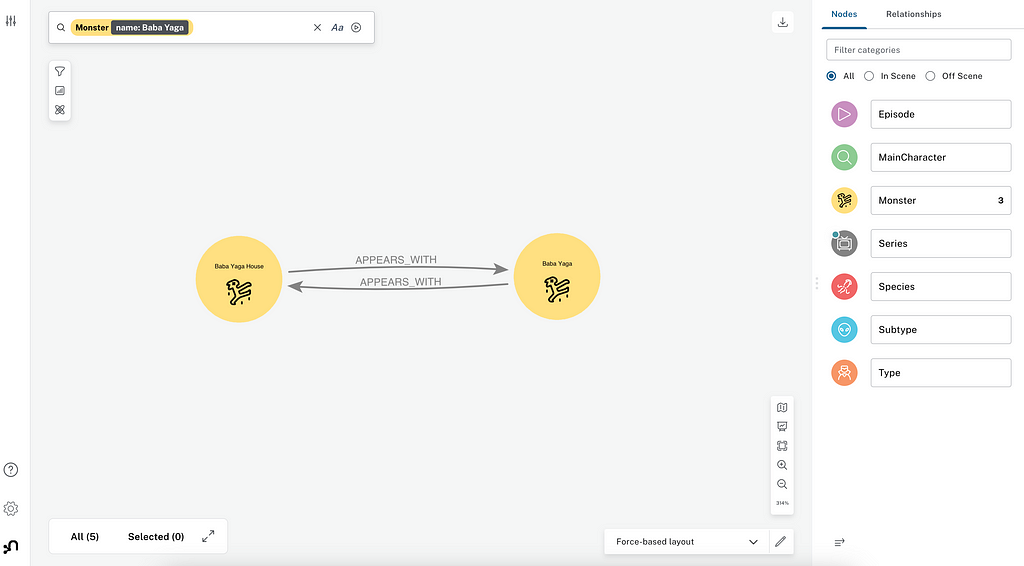
If there are no relationships between the two nodes, or all the relationships between the two nodes are already in the scene, the Reveal relationships option will be grayed out.
If we want to go beyond direct relationships and find a path through our graph between two nodes, we can select the two nodes, right-click, hover over the path menu, and choose Shortest Path.
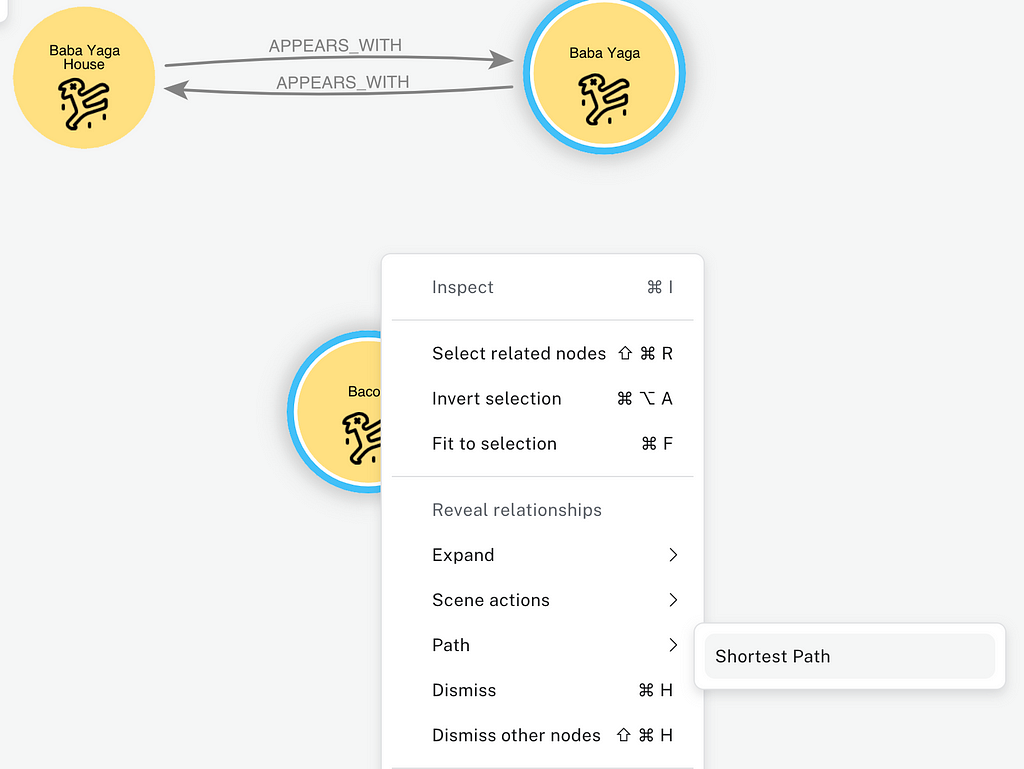
The shortest path will return the shortest way to get from one node to the other through the graph.
Custom Scene Actions
Sometimes, you may want to do a custom expansion or query based on the nodes in your scene. This can be done with Cypher code, similar to the search phrases. The main difference between search phrases and scene actions is that search phrases are run through the search bar and search your graph, while scene actions are run by right-clicking on selected nodes and searching based on those nodes.
To create a scene action that would allow you to choose a monster and add its type to the graph, we can go to the Perspective menu on the left side of Bloom, click on the Saved Cypher tab, then click Scene actions.
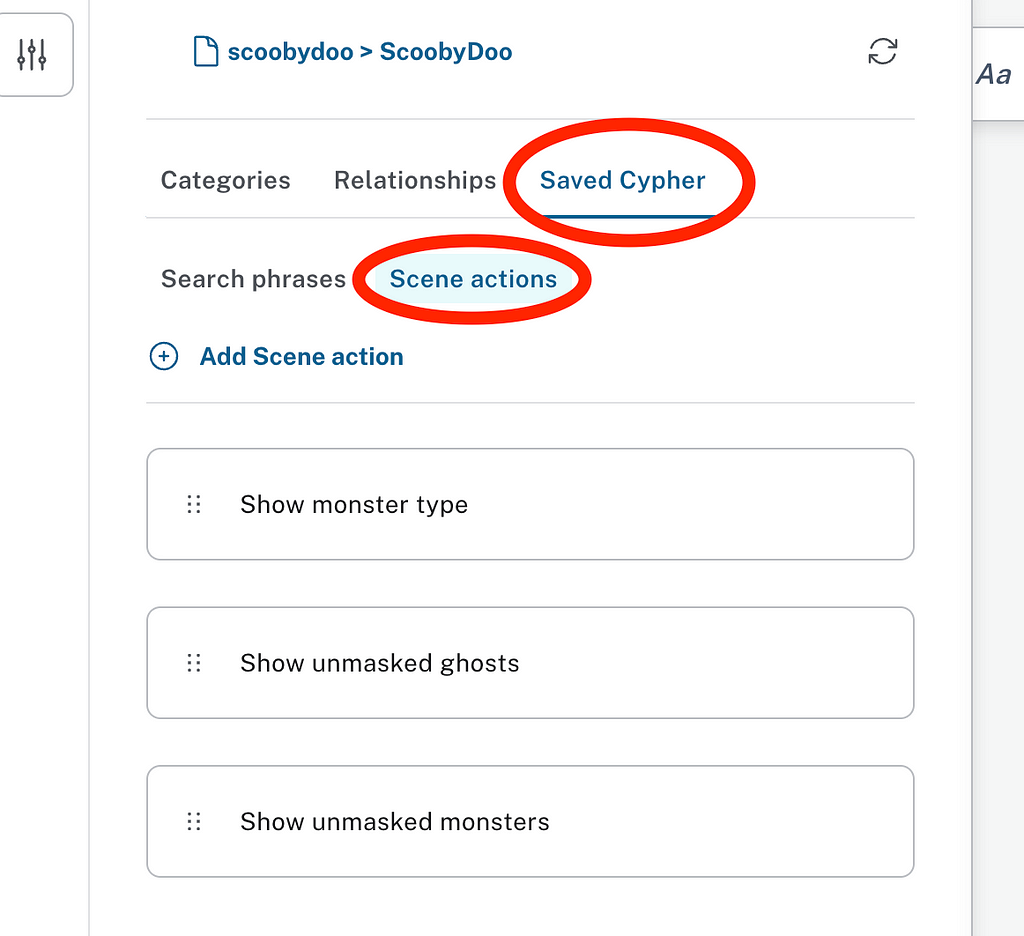
You can create a scene action by giving it a name, adding the Cypher code you want to execute, and, if applicable, limiting which node categories you want the scene action to run on.
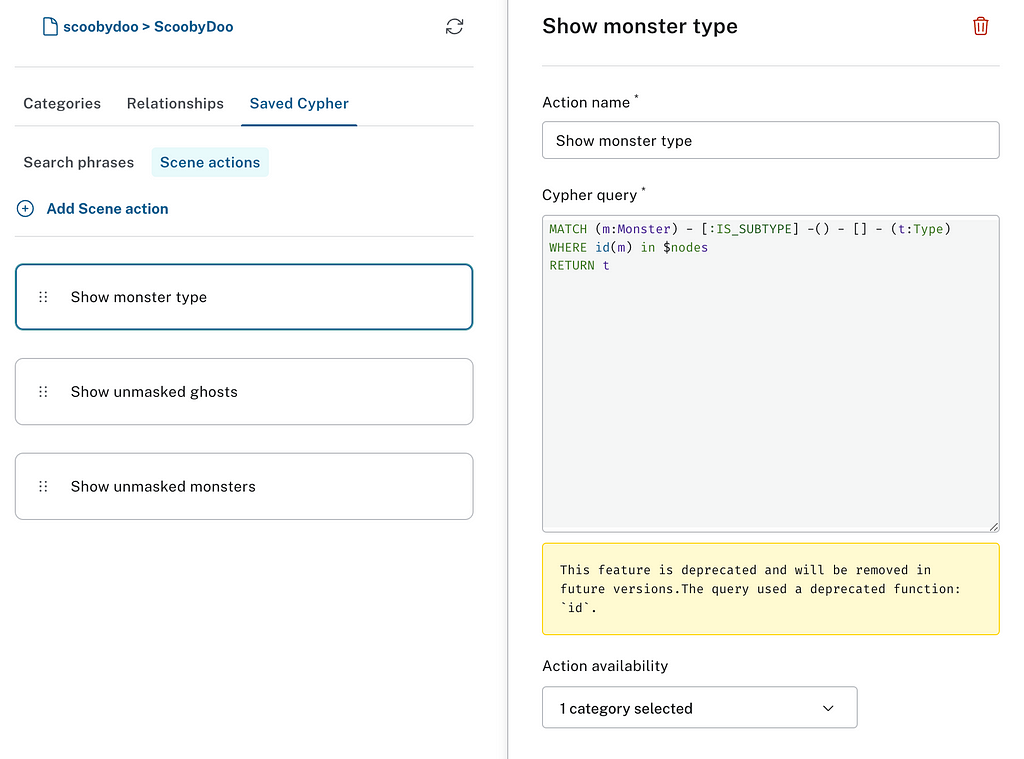
Once you have created the scene action, you will be able to see it when you right-click on a node or node(s), as long as they are in one of the categories you included in the scene action.
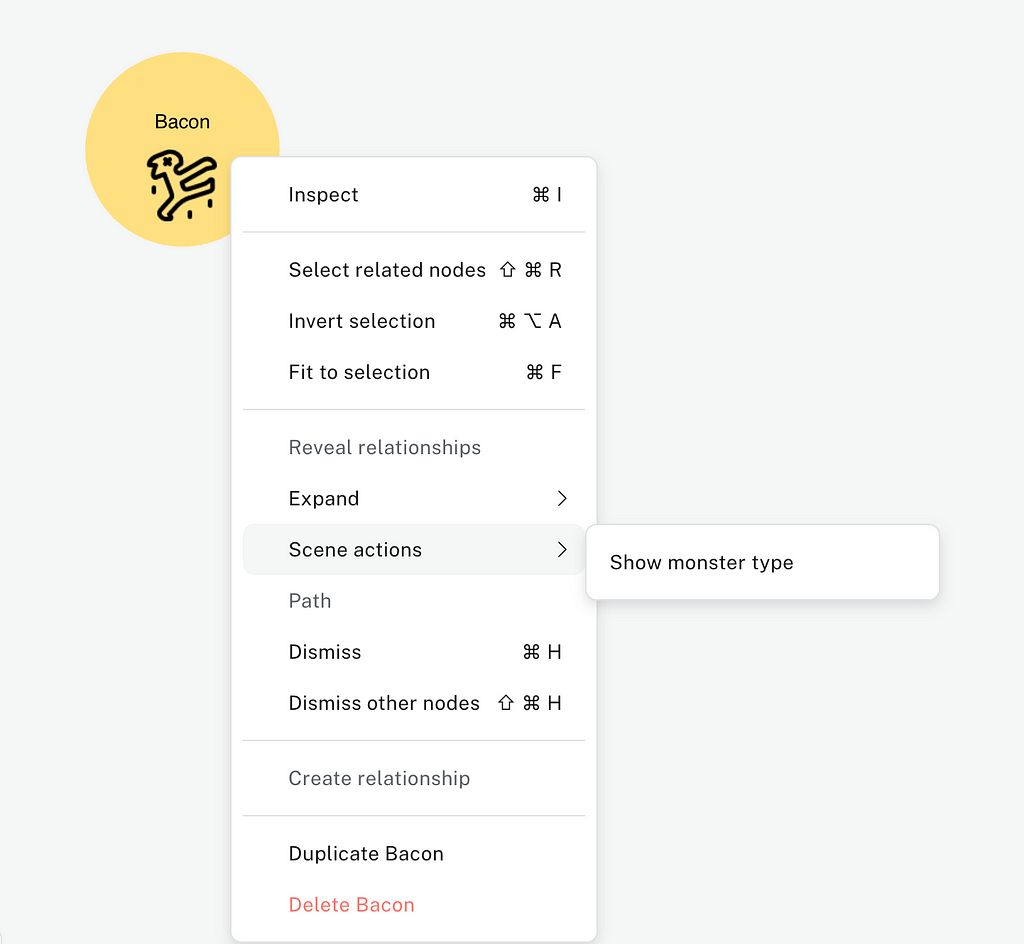
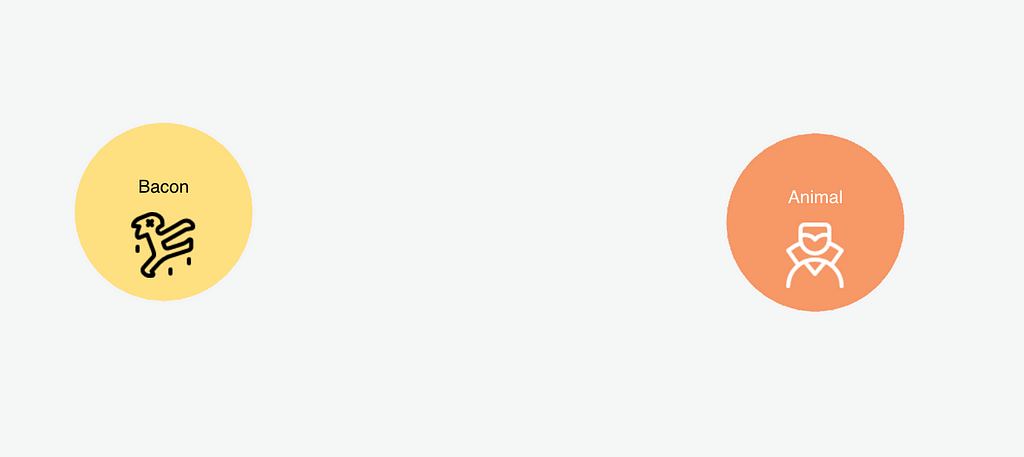
Once I run the scene action defined above, it will return the Type node for the monster I selected.
One more example of a scene action is a query to find all the ghosts that a main character unmasked.
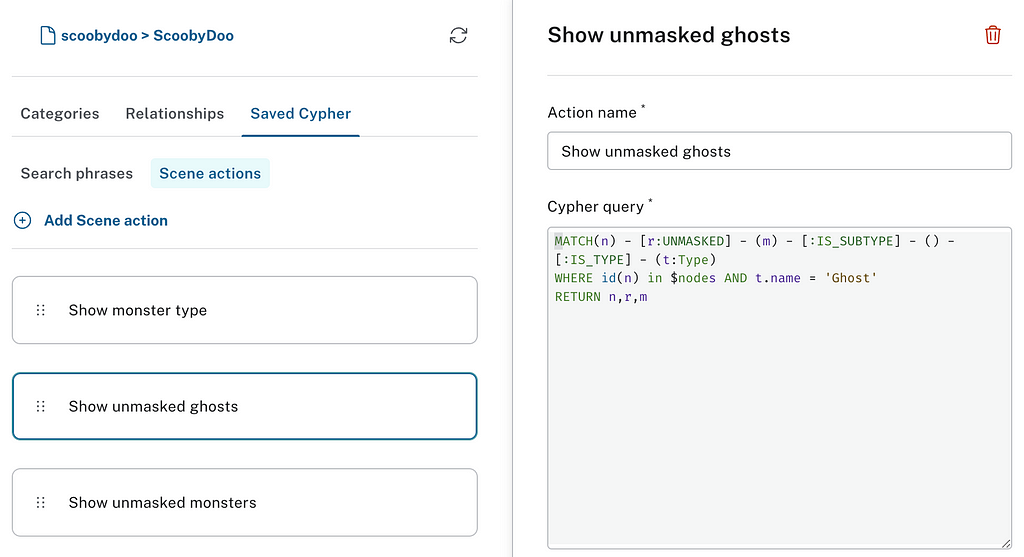
If I choose a main character node and right-click on it and choose the Show unmasked ghosts scene action, I will see all the monsters a character unmasked who are of the type Ghost.
There are many more ways to customize your visualizations with Neo4j Bloom, but I covered most of the core ways to format explore your data. I hope you had fun!
Visualizing Graph Data With Neo4j Bloom was originally published in Neo4j Developer Blog on Medium, where people are continuing the conversation by highlighting and responding to this story.
Share Article


Explore
Related Articles

Hey LLM, you’re using OPTIONAL MATCH wrong. Here’s the Cypher that actually works.