
SustainGraph – A Knowledge Graph for the UN Sustainability Goals

Senior Developer Marketing Manager
3 min read

The team from ARSINOE joined me to present their Knowledge Graph, which tracks information related to the achievement of targets defined in the United Nations Sustainable Development Goals (SDGs) at national and regional levels.
To watch the full episode scroll to the end of this summary blog post!
United Nations Sustainable Development Goals
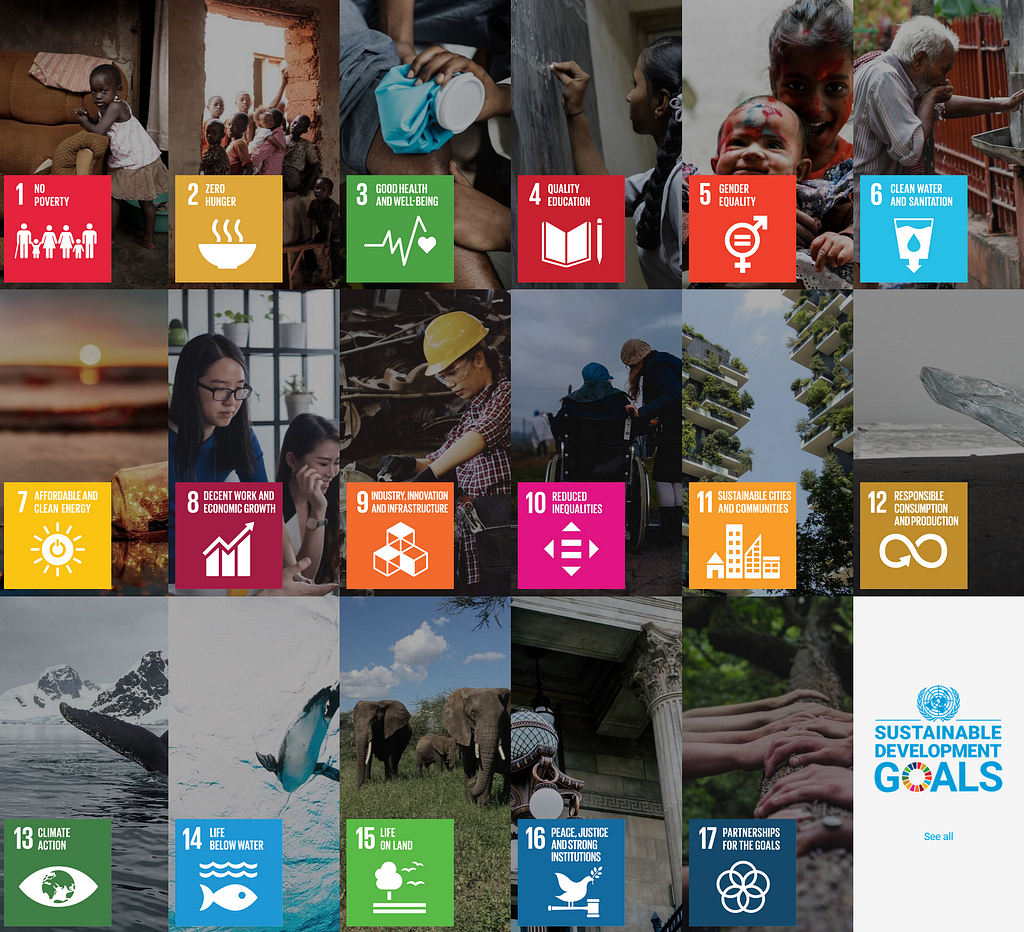
The United Nations Sustainable Development Goals (SDGs) are a set of 17 interconnected goals that were adopted by all UN Member States in 2015 as a universal call to action to end poverty, protect the planet, and ensure that all people enjoy peace and prosperity by 2030.
They cover a range of social, economic, and environmental issues, including no poverty, zero hunger, good health and well-being, quality education, gender equality, clean water and sanitation, affordable and clean energy, decent work, economic growth, and more.
The UN SDGs homepage covers information about all goals as well as yearly implementation reports and related events and publications.
Qualitative, interoperable, and well-interlinked data is required to support these objectives, hence creating SustainGraph.
SustainGraph

The SustainGraph project is led by researchers from several universities and research institutions and is supported by the European Union’s Horizon 2020 research and innovation program. Eleni Fotopoulou, Ioanna Mandilara, Anastasios Zafeiropoulos, and Christina-Maria Androna from the ARSINOE Project joined this livestream to present their knowledge graph.
SustainGraph is an open-source project that aims to develop a software platform for measuring and visualizing the sustainability of various systems, such as organizations, supply chains, and cities. The project utilizes various data sources and sustainability metrics to ultimately provide insights and recommendations for improving sustainability performance.
Eleni Fotopoulou explains that even though there is a lot of data around these sustainability goals, the data is stored in various data silos in different formats and semantics with little to no interoperability.
The SustainGraph knowledge graph aims to act as a unified source of truth for information related to the SDGs that is available for everyone working with it.
The team is achieving this by taking advantage of the power of graph databases and the exploitation of Natural Language Processing (NLP) and Machine Learning (ML) techniques for data population, knowledge production, and analysis.

SustainGraph includes not only the UN Sustainable Development Goals, but also the EU Green Deal and their related documents, which cover a variety of topics and recommended actions for the coming 12 months for each member state. In addition to that, local governmental policies based on the Paris Agreement were also included.
Demo
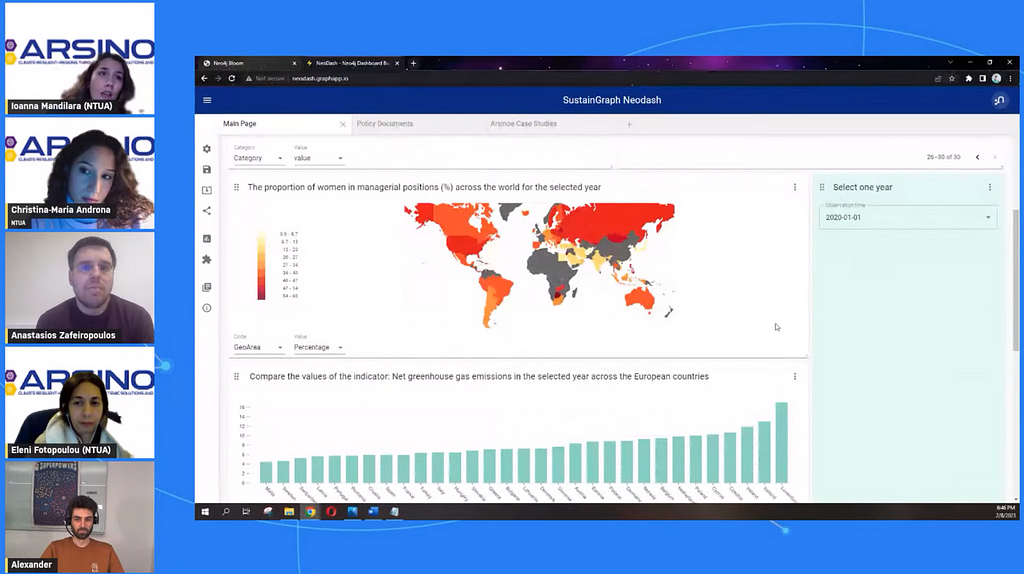
During the stream, Ioanna Mandilara continued to give a demo of SustainGraph by using Neo4j Bloom as well as NeoDash.
By combining graph visualizations with a more traditional dashboard the team achieved an extensive view on their data. Now, it is possible to show how different policies impact the Sustainable Development Goals differently and how they are connected, as well as inventions and hazards influencing a specific goal. With a single view, we can see the progress toward the Sustainable Development Goals for each country.
As of today, the knowledge graph consists of 5M nodes and 10M relationships. The team is hoping to include more and more resources to SustainGraph in the future as they work on making the knowledge graph accessible for scientists and other interested parties from around the world.
As part of their work, the team published SustainGraph on their GitLab page.
They also wrote an article titled “Global assessment of the environmental sustainability of seaweed aquaculture” which discusses the challenges of developing solutions to manage or mitigate the impacts of climate change, given the complexity and dynamics of socio-environmental and socio-ecological systems.
Watch the Full Episode
Interesting Links
Eleni Fotopoulou
Ioanna Mandilara
Anastasios Zafeiropoulos
Global assessment of the environmental sustainability of seaweed aquaculture
ARSINOE Project
SustainGraph GitLab
SustainGraph — A Knowledge Graph for the UN Sustainability Goals was originally published in Neo4j Developer Blog on Medium, where people are continuing the conversation by highlighting and responding to this story.
Share Article


Explore
Related Articles


Text2Cypher Across Languages: Evaluating Foundational Models Beyond English


