This Week in Neo4j: Knowledge Graphs, NeoDash, Automation, Web Analysis and more
3 min read
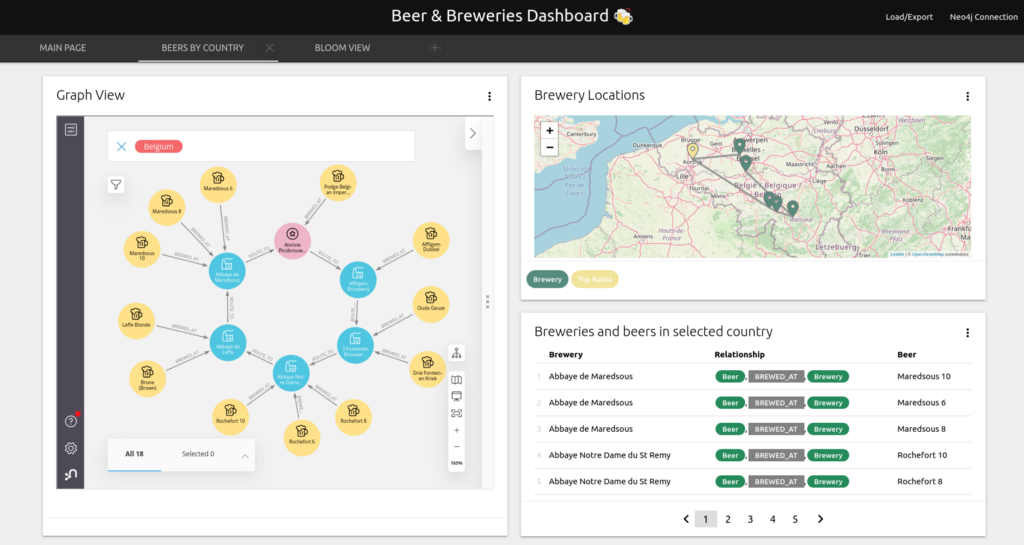
NeoDash 2.4: Unleashing the Power of Neo4j Graph Dashboards
5 min read
Exploring Neodash for 197M Chemical Full-Text Graph
3 min read

Exploring the European Natural Gas Network as a Knowledge Graph
16 min read
This Week in Neo4j: Bitcoin, Free GraphAcademy Courses, Visualization Tools, Graph Database, and more
3 min read