
Visualize Graph Embedding Algorithm Result in NEuler

Graph ML and GenAI Research, Neo4j
3 min read
Quickly inspect graph embedding algorithm results in Neo4j graph data science playground application NEuler.
NEuler is a graph data science playground application designed to help you execute and understand graph algorithms in Neo4j. With only a couple of clicks, you can import example data, execute various graph algorithms, and visualize their results. It is available as an extension to Neo4j Desktop, and you can also use it in combination with Neo4j Sandbox.
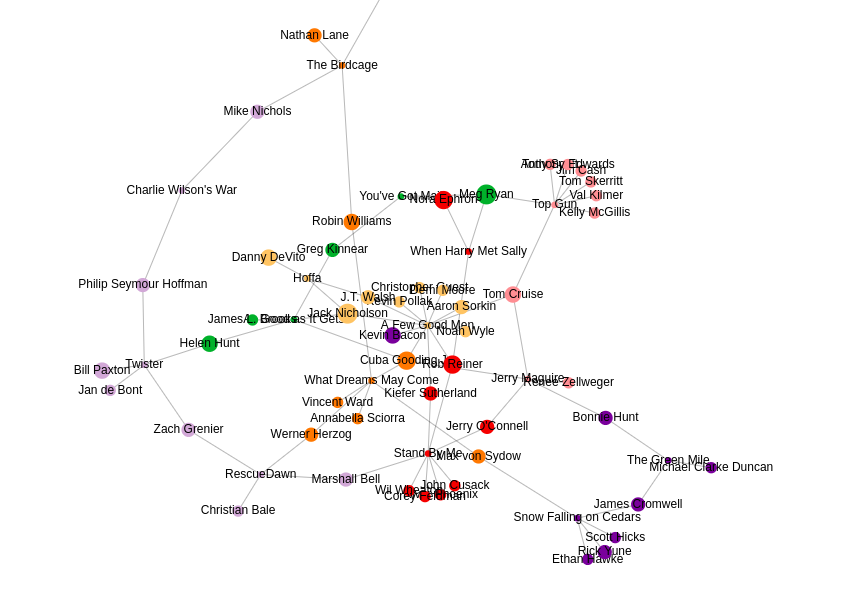
In this blog post, I will use the Movies sandbox project to demonstrate how to quickly visualize graph embedding results with a t-SNE scatter plot.
Setting Up the Neo4j Sandbox Environment
You can follow this link to automatically create a Movies sandbox project. If you choose to, you can select a different sandbox project. There are more than 10 Sandbox projects available, ranging from Twitter and Open Street Map to contact tracing projects.
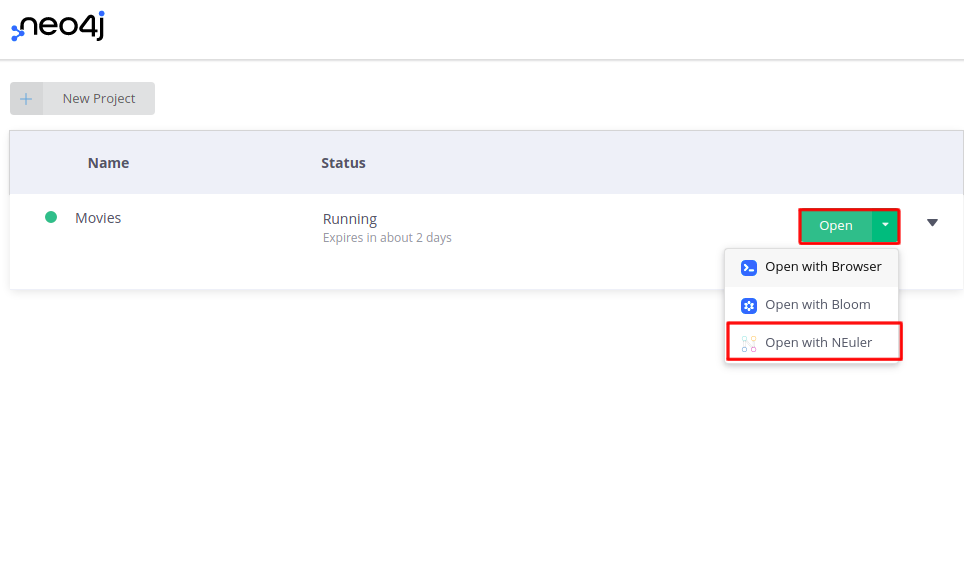
Once you have selected and created your desired sandbox environment, you can open the NEuler application by choosing it in the dropdown menu.
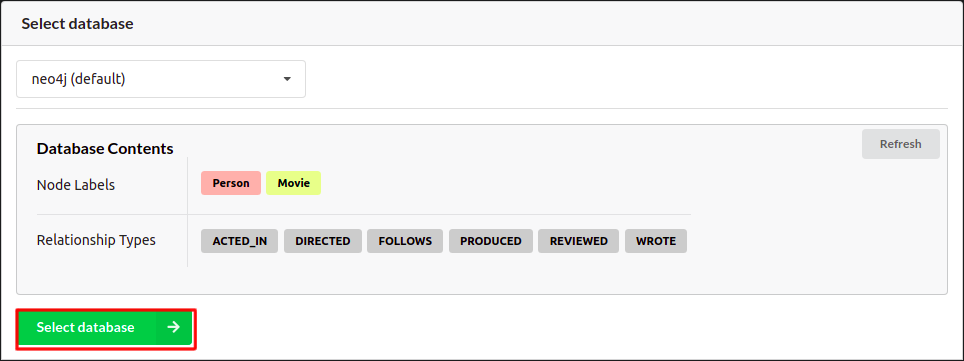
Follow the login screen and select the default database in the onboarding process.
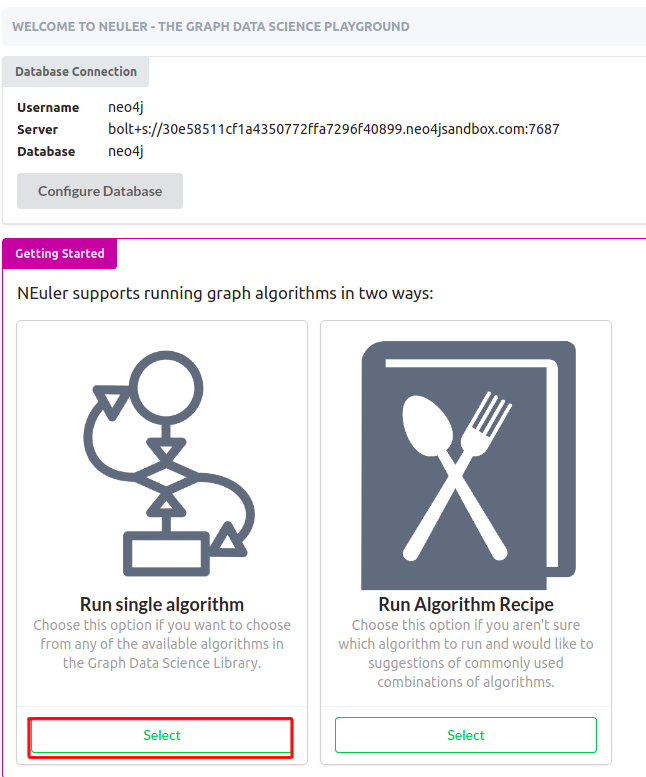
Now you should arrive at the main screen of the NEuler application. You can either import new sample datasets, run algorithm recipes, or execute single algorithms.
To follow this blog post, choose to run a single algorithm.
You should now see all the available graph algorithms in the NEuler application.
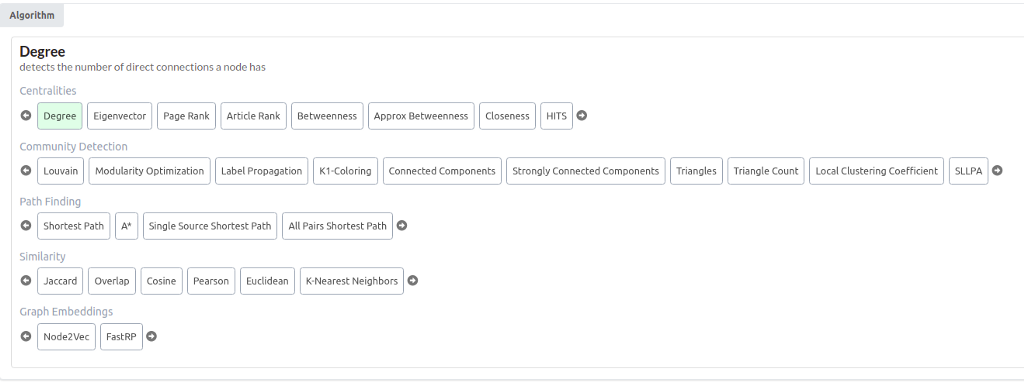
There are more than 30 graph algorithms available. As mentioned, here, you will learn how to execute graph embedding algorithms and visualize their results with TSNE scatter plot. Choose either Node2vec or FastRP algorithm. They are both graph embedding algorithms. A graph embedding algorithm calculates a fixed-length vector representation for each node in the graph whilst maximally preserving properties like graph structure and information. These embeddings are a lower-dimensional representation of the graph and preserve the graph’s topology.
To learn more about the graph embedding algorithms, take a look at the documentation.
I have chosen the FastRP algorithm in this example. You can use the default configuration or you can test various configuration parameters to see how it affects results. I have configured the embedding dimension to 128 and set the “Rows to show” parameter to 150.
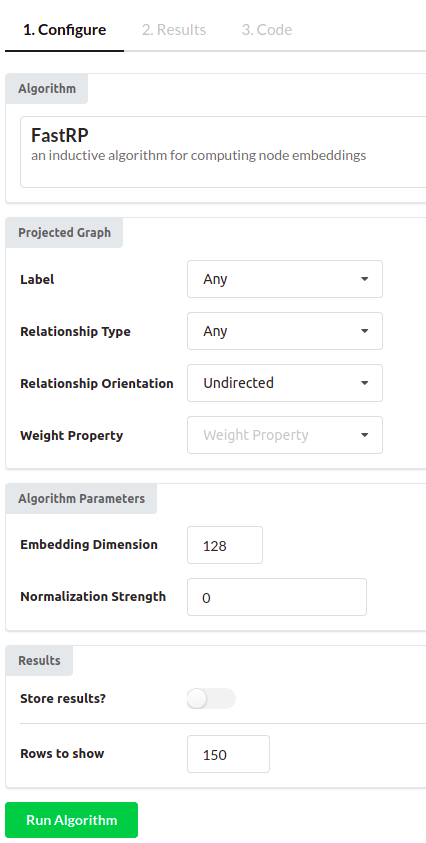
The only thing left to do is to run the algorithm.
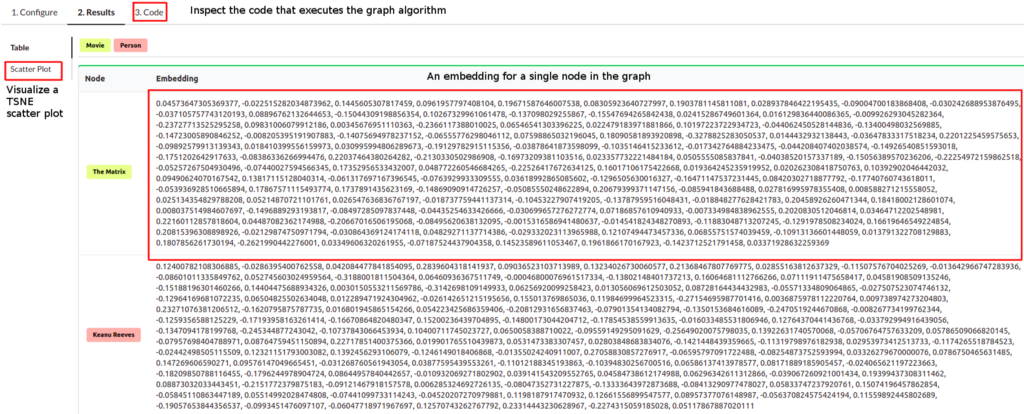
Once the algorithm is finished, you can observe the results in the table form. Each node has an embedding or a fixed-size vector assigned to it. In my case, I have used the embedding size of 128, so the vector of each node has the size of 128. Usually, the node embeddings are used in a downstream machine learning workflow. To quickly inspect and visualize the results of the embedding algorithm, you can click on the Scatter Plot option in the left menu.
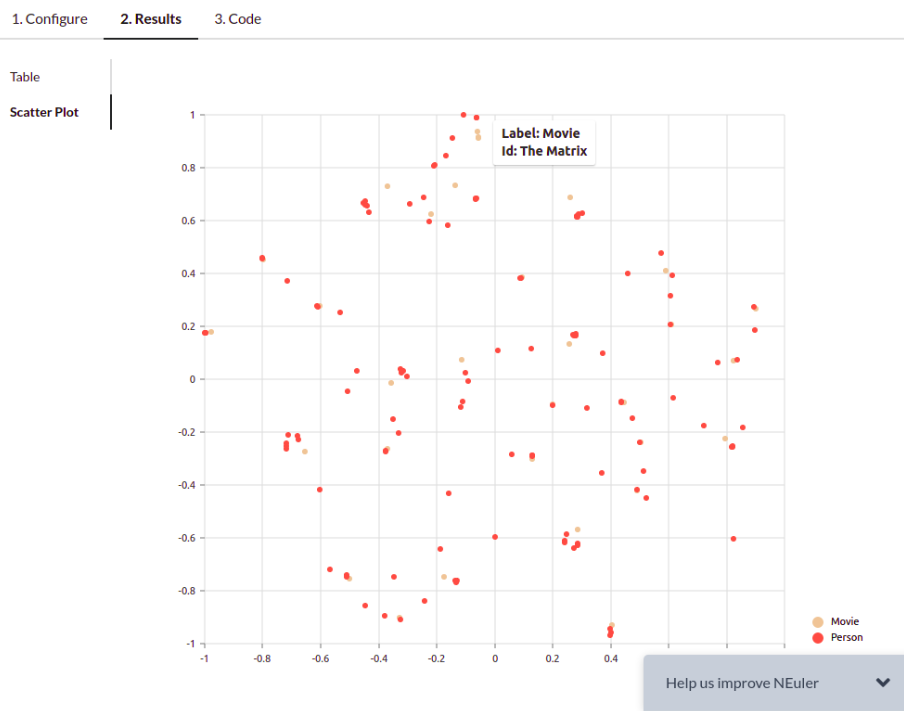
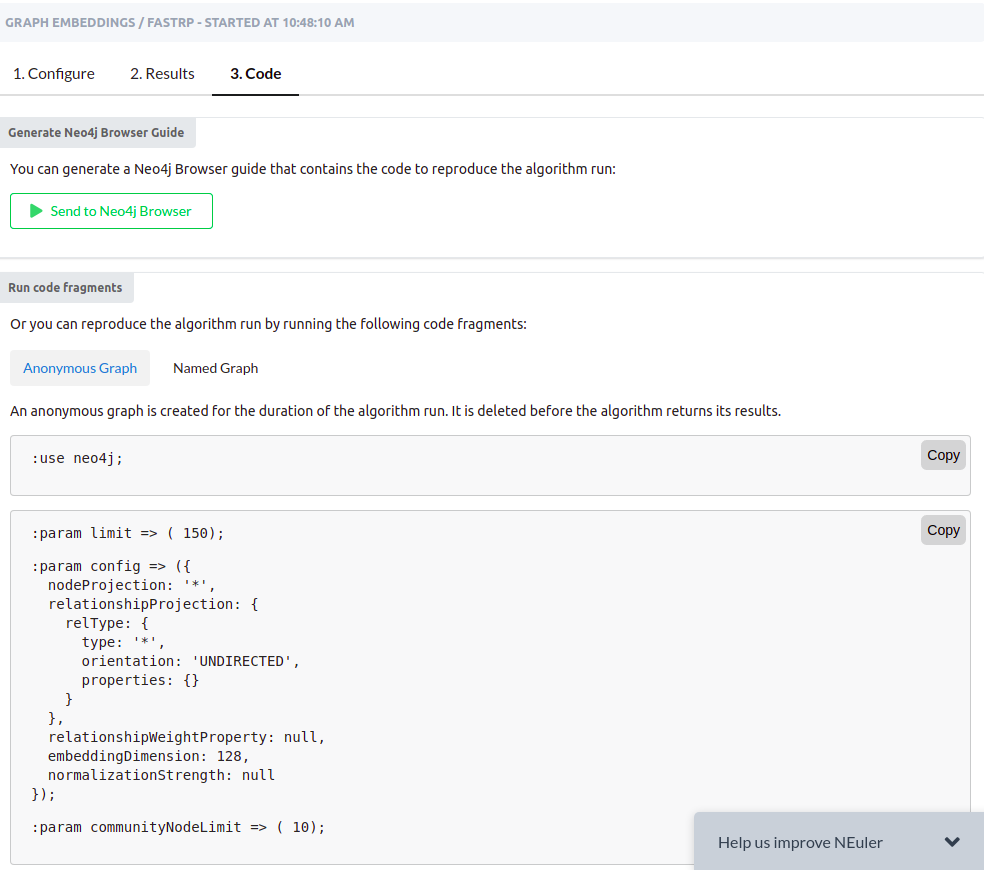
NEuler application uses the t-SNE algorithm under the hood to reduce the dimensionality of the embeddings to a size of 2. By reducing the vector dimensionality to 2, we can visualize them with a scatter plot. You can play around with various algorithm configurations to determine how it affects the embedding results. If you want to export the code needed to execute the algorithms outside the NEuler application, you can simply copy the generated code from the Code tab.
Hopefully, this example will help you get started with node embedding algorithms in Neo4j Graph Data Science plugin. Download Neo4j Desktop, or try out one of the Neo4j Sandbox projects to get started with network analysis and graph algorithms.
P.S. NEuler also supports network visualizations. Learn more about how to do them in the application documentation.
Visualize Graph Embedding Algorithm Result in NEuler was originally published in Neo4j Developer Blog on Medium, where people are continuing the conversation by highlighting and responding to this story.
Share Article


Explore
Related Articles


Text2Cypher Across Languages: Evaluating Foundational Models Beyond English


