
Wardley Mapping With Neo4j

Senior Developer Marketing Manager
3 min read
Tom Asel from Tangible Concepts joined me recently to discuss the concept of Wardley Maps: What they are, where they are used, and why they (as well as maps in general) are different from graphs. In a demo, Tom demonstrated how Wardley Maps can be analyzed in Neo4j to find the hidden knowledge in these maps.
To watch the full episode scroll to the end of this blog post!
What is a Wardley Map?
A Wardley Map is a visual representation of the value chain of a business, product, or service, showing the progression from raw materials to customer value. It is used to analyze and understand a system’s components and identify opportunities for improvement or innovation. Wardley Maps were named after Simon Wardley. See Wikipedia for more information.
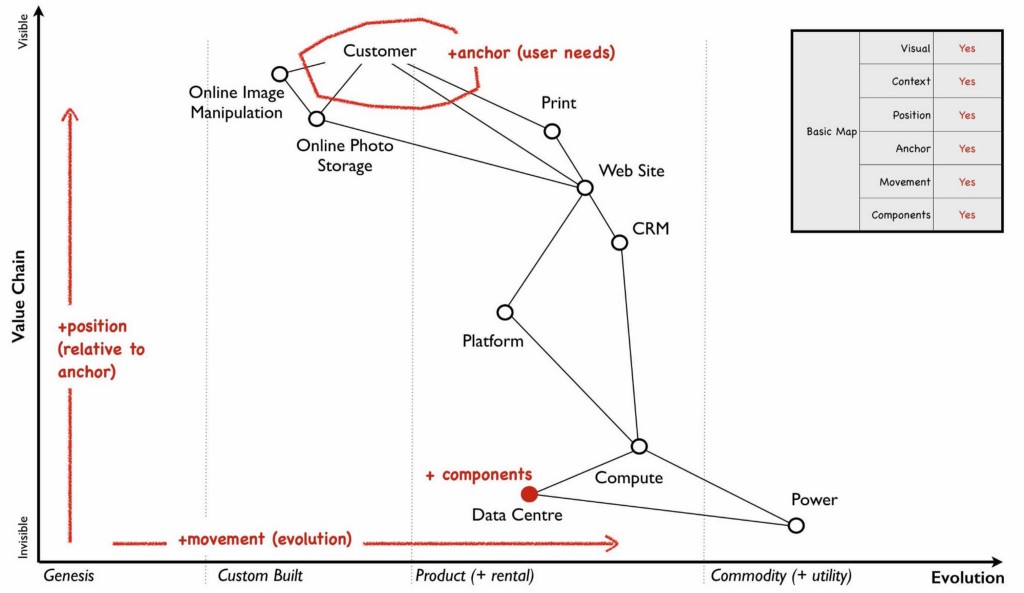
Every Wardley Map has these core concepts:
Anchor
The user from whose perspective the map is drawn.
Visibility
This is in relationship to the anchor and depending on their role, responsibility, and hierarchy the connected components are closer or further away — e.g. a backend developer has more visibility on the database than on the front-end of an app.
Evolution
Components move from left to right depending on the context of the map — e.g. a new AI-Advisor is experimental and therefore on the very left and can move over time with additional development to the right.
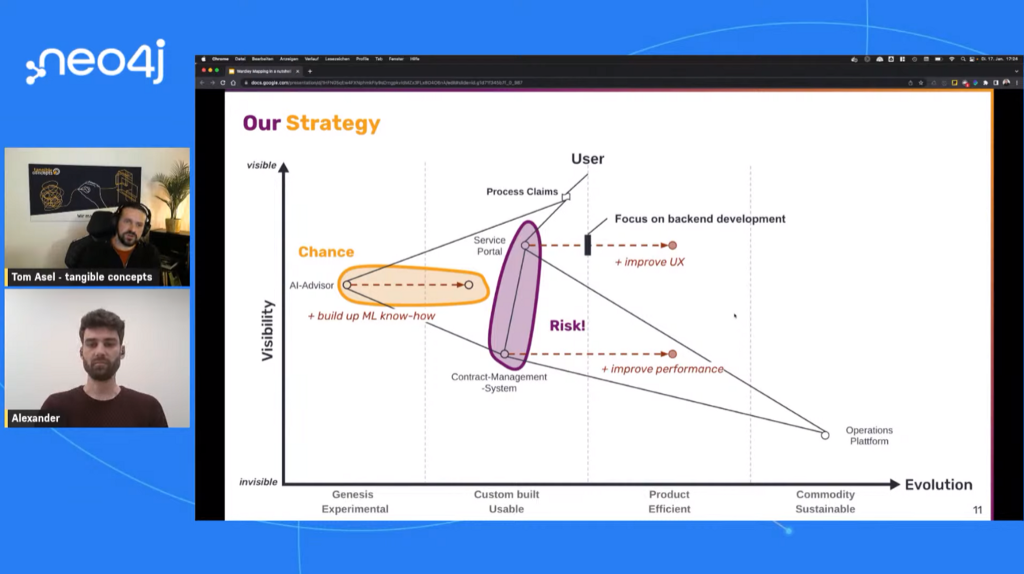
After placing these components on the map you can make assessments on risks and chances. By adding Movement (components becoming more mature on the evolution axis) and Inertia future improvements and blockers become visible.
During the video, Tom shows a few advanced Wardley Map examples and explains how they are used for software development.
Parsley
With Parsley you can import Wardley Maps created with the tool Online Wardley Maps into Neo4j.
Tom created Parsley to better analyze their Wardley Maps and understand the context.
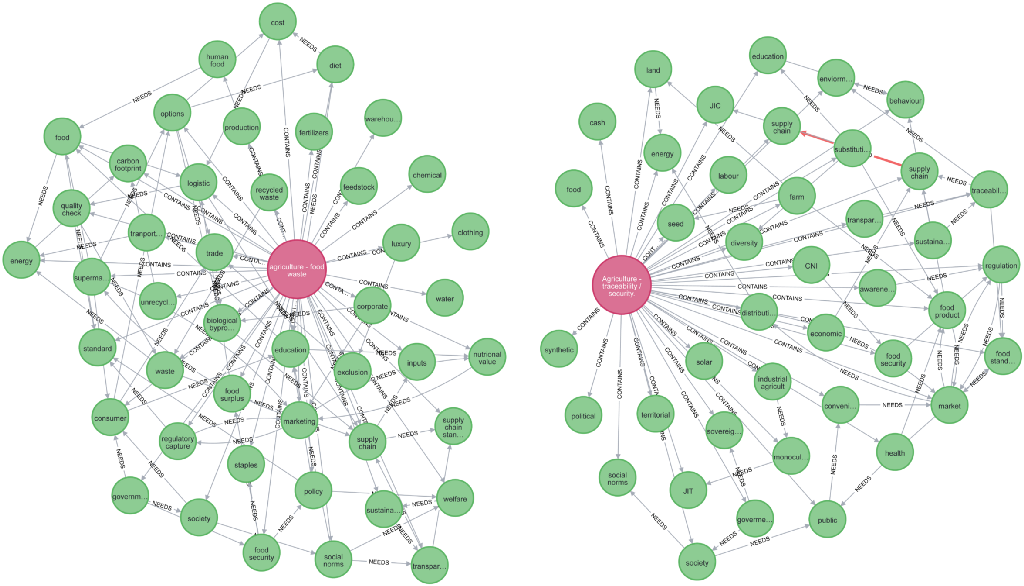
Once imported in Neo4j you lose the visibility of the position on the map, but you have all the connections (relationships) between the components (nodes), which you can now use for deeper analysis of your map. With larger datasets, and more intertwined components, it gets more difficult to see evolution, inertia, or dependencies — especially across various Wardley Maps (remember: they show the view per anchor).
Opening Wardley Maps to structured querying was a game changer for Tom: Navigating the graph, finding connections, and through that gaining access to the knowledge that is hidden in the maps.
For Tom, the next steps are using pattern matching to find key components in the maps as well as analyzing the flows of the maps with graph algorithms, like the shortest path or link prediction.
Watch the full episode
Subscribe to the Neo4j YouTube Channel for more live streams!
Interesting Links
Tom Asel
Tangible Concepts
Parsley
Online Wardley Maps
Wardley Map Awesome List
Wardley Mapping with Neo4j was originally published in Neo4j Developer Blog on Medium, where people are continuing the conversation by highlighting and responding to this story.
Share Article


Explore
Related Articles


How to Improve Multi-Hop Reasoning With Knowledge Graphs and LLMs
