Diagnosing network latency in a Causal Cluster using MTR
MTR is a simple ICMP based test combining ping and traceroute. The following demonstrates usage of the MTR trace tool to diagnose network latency and packet loss in a Causal Cluster. The tool is commonly used on Windows via the WinMTR tool (https://sourceforge.net/projects/winmtr/), however this article describes its example usage via the unix terminal. Installation and various usage options are beyond the scope of this article. A good reference for these can be found at the linode website referenced at the end of this article.
OSX Installation
$ brew install mtrthis should allow execution as sudo /usr/local/sbin/mtr however, executing the below two commands simplifies execution as
sudo mtr:
$ sudo ln /usr/local/Cellar/mtr/0.92/sbin/mtr /usr/local/bin/mtr
$ sudo ln /usr/local/Cellar/mtr/0.92/sbin/mtr-packet /usr/local/bin/mtr-packet
To install using MacPorts, run
$ port install mtrParameters
| Usage | Verbose version | Description |
|---|---|---|
-F |
--filename FILE |
read hostname(s) from a file |
-4 |
use IPv4 only |
|
-6 |
use IPv6 only |
|
-u |
--udp |
use UDP instead of ICMP echo |
-T |
--tcp |
use TCP instead of ICMP echo |
-a |
--address ADDRESS |
bind the outgoing socket to ADDRESS |
-f |
--first-ttl NUMBER |
set what TTL to start |
-m |
--max-ttl NUMBER |
maximum number of hops |
-U |
--max-unknown NUMBER |
maximum unknown host |
-P |
--port PORT |
target port number for TCP, SCTP, or UDP |
-L |
--localport LOCALPORT |
source port number for UDP |
-s |
--psize PACKETSIZE |
set the packet size used for probing |
-B |
--bitpattern NUMBER |
set bit pattern to use in payload |
-i |
--interval SECONDS |
ICMP echo request interval |
-G |
--gracetime SECONDS |
number of seconds to wait for responses |
-Q |
--tos NUMBER |
type of service field in IP header |
-e |
--mpls |
display information from ICMP extensions |
-Z |
--timeout SECONDS |
seconds to keep probe sockets open |
-r |
--report |
output using report mode |
-w |
--report-wide |
output wide report |
-c |
--report-cycles COUNT |
set the number of pings sent |
-j |
--json |
output json |
-x |
--xml |
output xml |
-C |
--csv |
output comma separated values |
-l |
--raw |
output raw format |
-p |
--split |
split output |
-t |
--curses |
use curses terminal interface |
--displaymode MODE |
select initial display mode |
|
-n |
--no-dns |
do not resove host names |
-b |
--show-ips |
show IP numbers and host names |
-o |
--order FIELDS |
select output fields |
-y |
--ipinfo NUMBER |
select IP information in output |
-z |
--aslookup |
display AS number |
-h |
--help |
display this help and exit |
-v |
--version |
output version information and exit |
Examples below describe usage on OSX only, but usage on other operating systems is very similar.
Usage
sudo mtr <destination domain name or ip>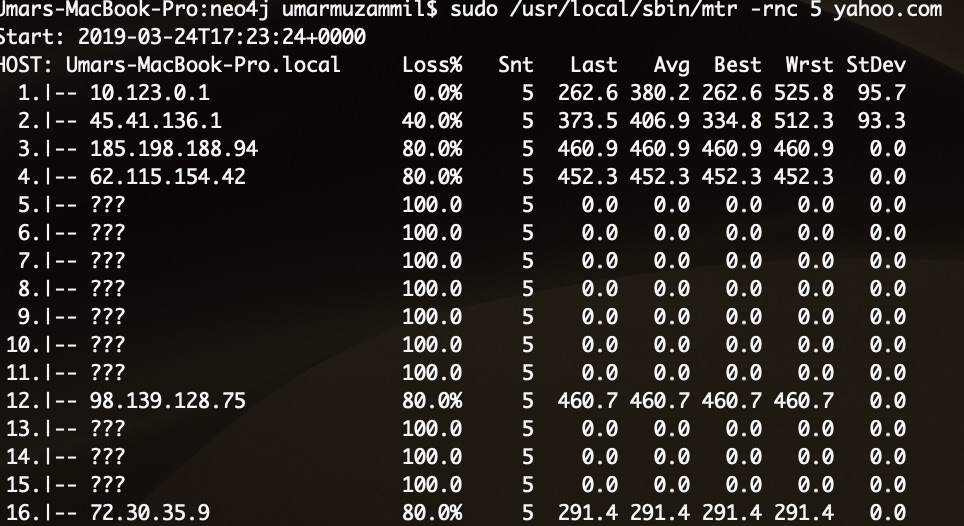
If a summary, rather than real-time response updates, is desired, execute:
sudo mtr -rwn -i 2 -c 5 <domain name or ip> > /User/<username>/Desktop/mtr.txt where i is the ping interval
in seconds and in this case is 2. This outputs the trace report to an mtr.txt file at the above specified location.
Run mtr -P <tcp port> -T -w <destination ip> to generate a report. By default it sends 10 packets to the host.
The Loss% column shows the percentage of packet loss at each hop. The Snt column counts the number of packets sent.
The next four columns Last, Avg, Best, and Wrst are all measurements of latency in milliseconds. Last is the
latency of the last packet sent, Avg is the average latency of all packets, while Best and Wrst display the best
(shortest) and worst (longest) round trip time for a packet to this host. In most cases, the average Avg column should
be the focus. The final column, StDev, provides the standard deviation of the latencies to each host. The higher the
standard deviation, the greater the difference is between measurements of latency.
When analyzing MTR output, you are looking for two things: loss and latency. An example test result of mtr -P 80 -T -w <ip>
is shown below:
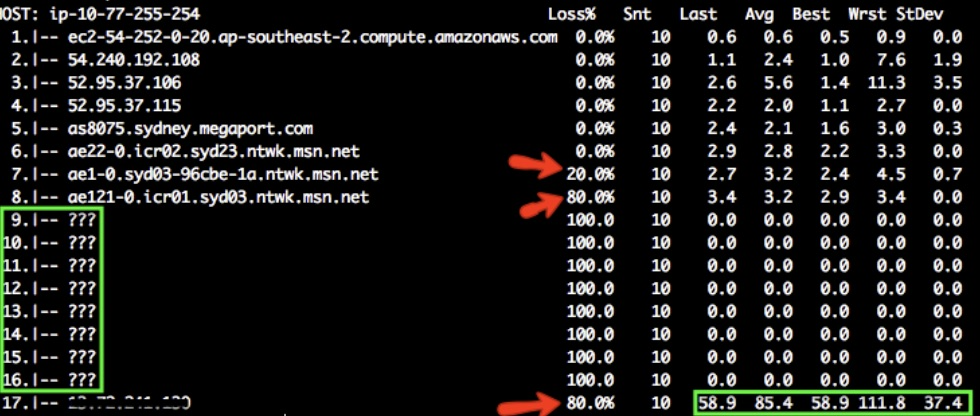
The question marks ??? appear when there is no additional route information. In the above example, there isn’t much information
available from hops 9 to 16. When variable loss is reported between hops, it is advised to trust response times from later hops.
In the above example, there is 20% packet loss from hop 6 to hop 7 and 80% from hop 7 to hop 8. The destination also has 80% packet loss. This could lead to high latency (10s of seconds) and in this case, it seems to be down to hops 6, 7 and 8. Note that some packet loss is due to rate limiting. If there’s no packet loss on the destination, it means the connectivity is good. Notice the latency above averages at 86.4 ms. Hops 8 to 16 seem to have introduced around 100ms delay in this case.
The ability to specifiy a source address and port, makes this tool particularly useful for testing intra-cluster latency. One can specify a source address and port as well as which protocol to use instead of ICMP, e.g. UDP or TCP.
For example, if one sets dbms.connector.bolt.listen_address=:7688 on the neo4j server side, it may be useful to test the
network latency which will be added to query response times by executing the MTR trace from the server towards the client,
e.g. as sudo mtr -rwn -i 2 -c 5 -P 7688 -T <ip of the client, or, another cluster member>.
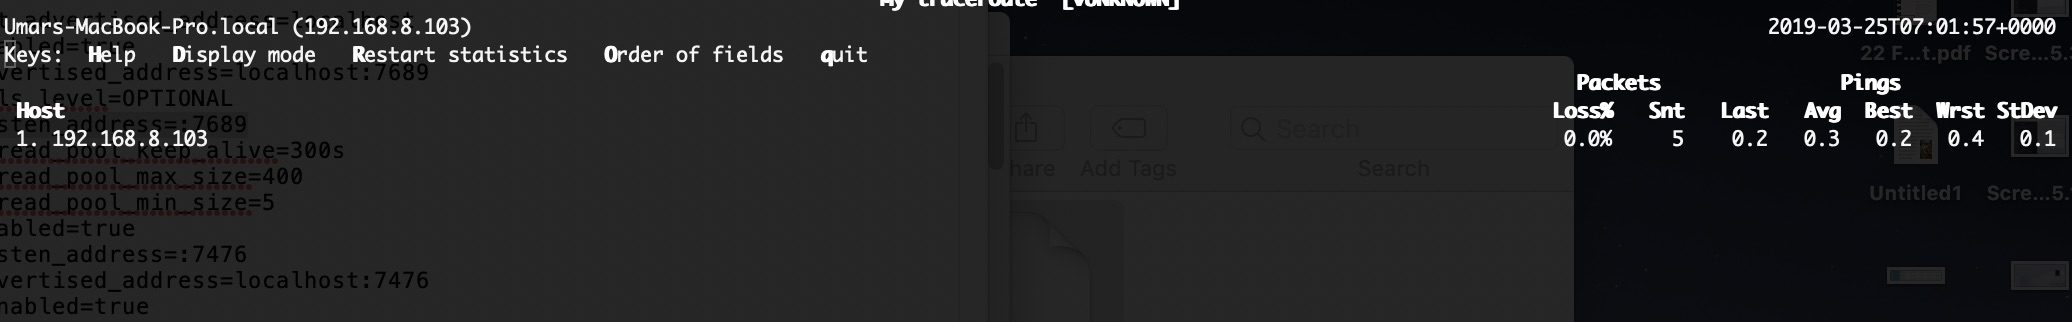
For a sample 3 core causal cluster with dbms.connector.bolt.listen_address=:7688, dbms.connector.bolt.listen_address=:7689 and
dbms.connector.bolt.listen_address=:7690, we can test the intra-cluster latency between instances 1 (source) and 2 (destination) as:
e.g. sudo mtr -c 5 -T -P 7689 192.168.8.103:
Is this page helpful?