Perspectives
In Explore, a Perspective defines a certain business view or domain that can be found in the target Neo4j graph. A single Neo4j graph can be viewed through different Perspectives, each tailored for a different business purpose.
Perspectives define:
-
Categorization of business entities.
-
Property visibility and value type.
-
Relationship visibility.
-
Styling (color, icon, caption).
-
Custom Search phrases (see later section).
A business view of the graph
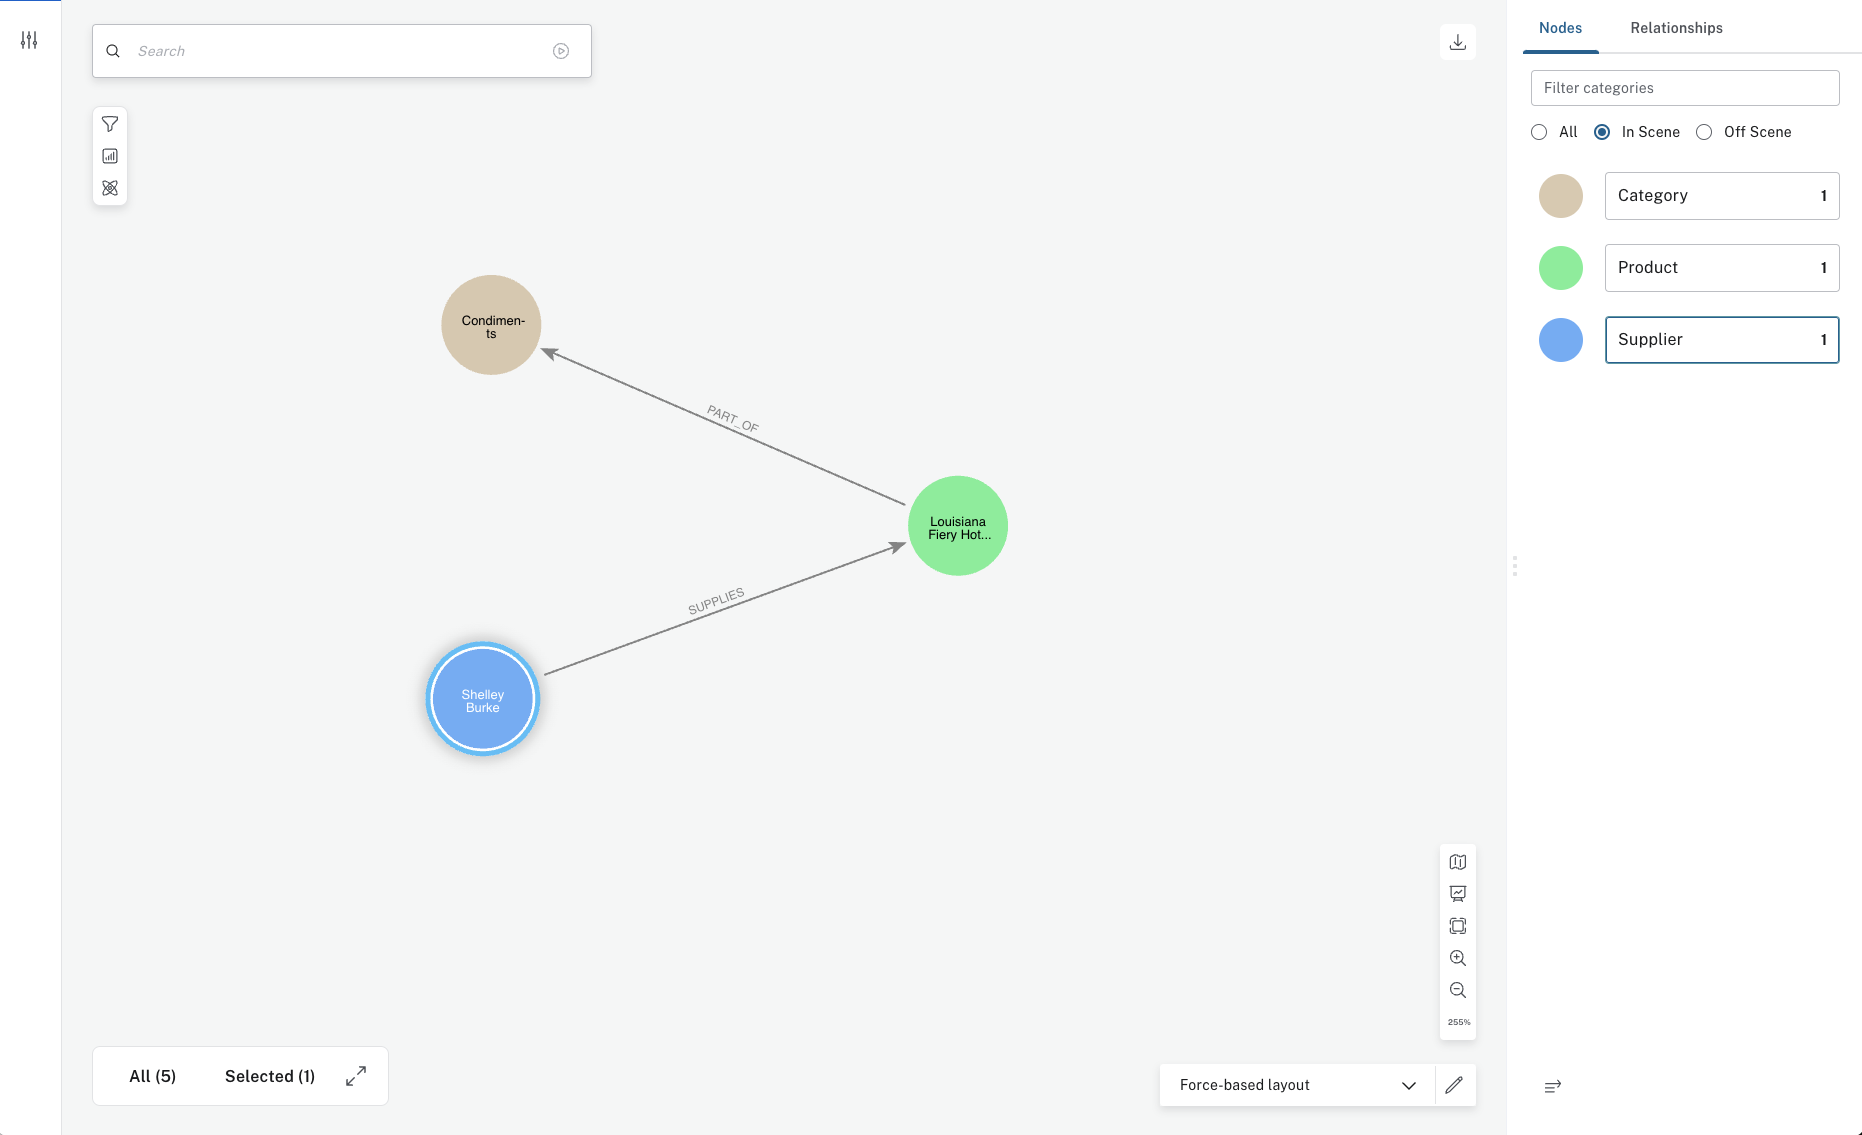
Within a graph there are often multiple smaller graphs which are connected to each other. Sometimes you need to see everything. Other times it’s helpful to have a more focused view. Defining a Perspective allows you to select what parts of the graph to show and how to show them.
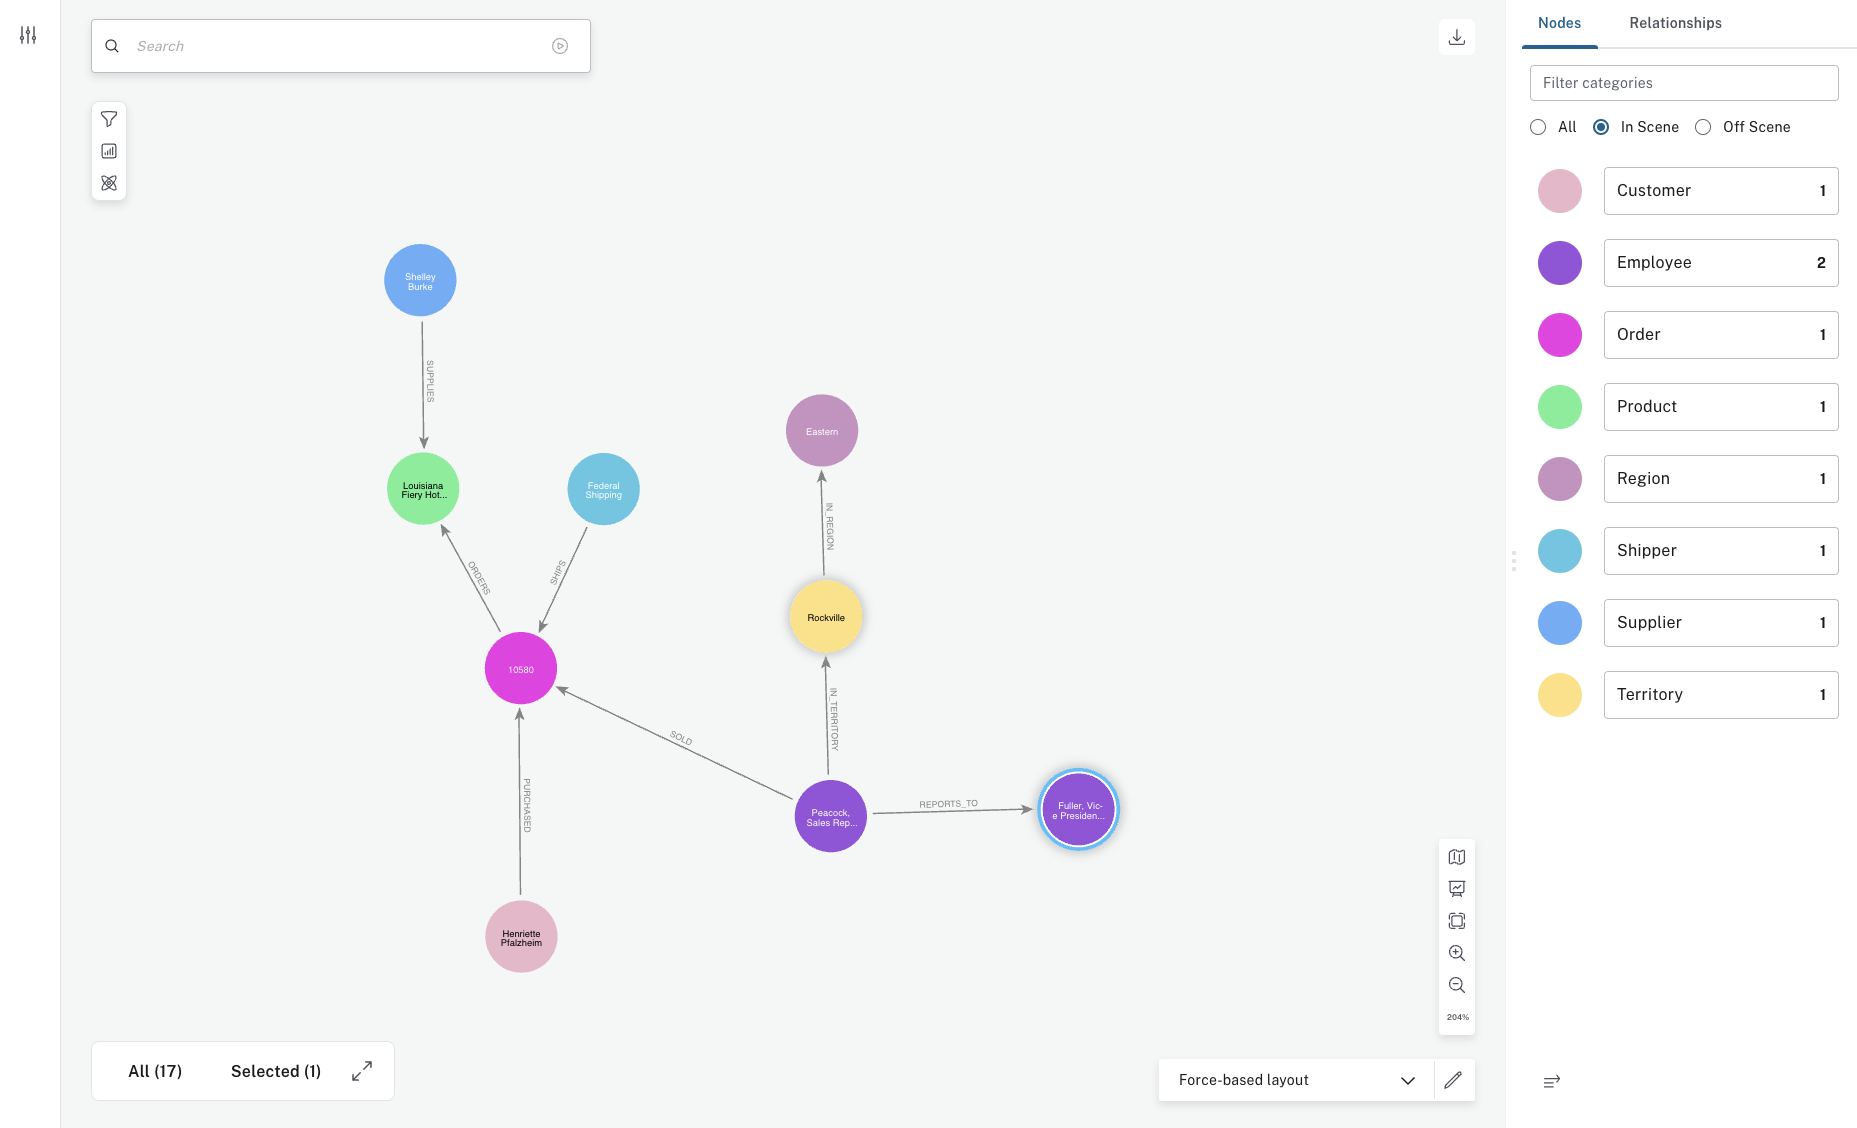
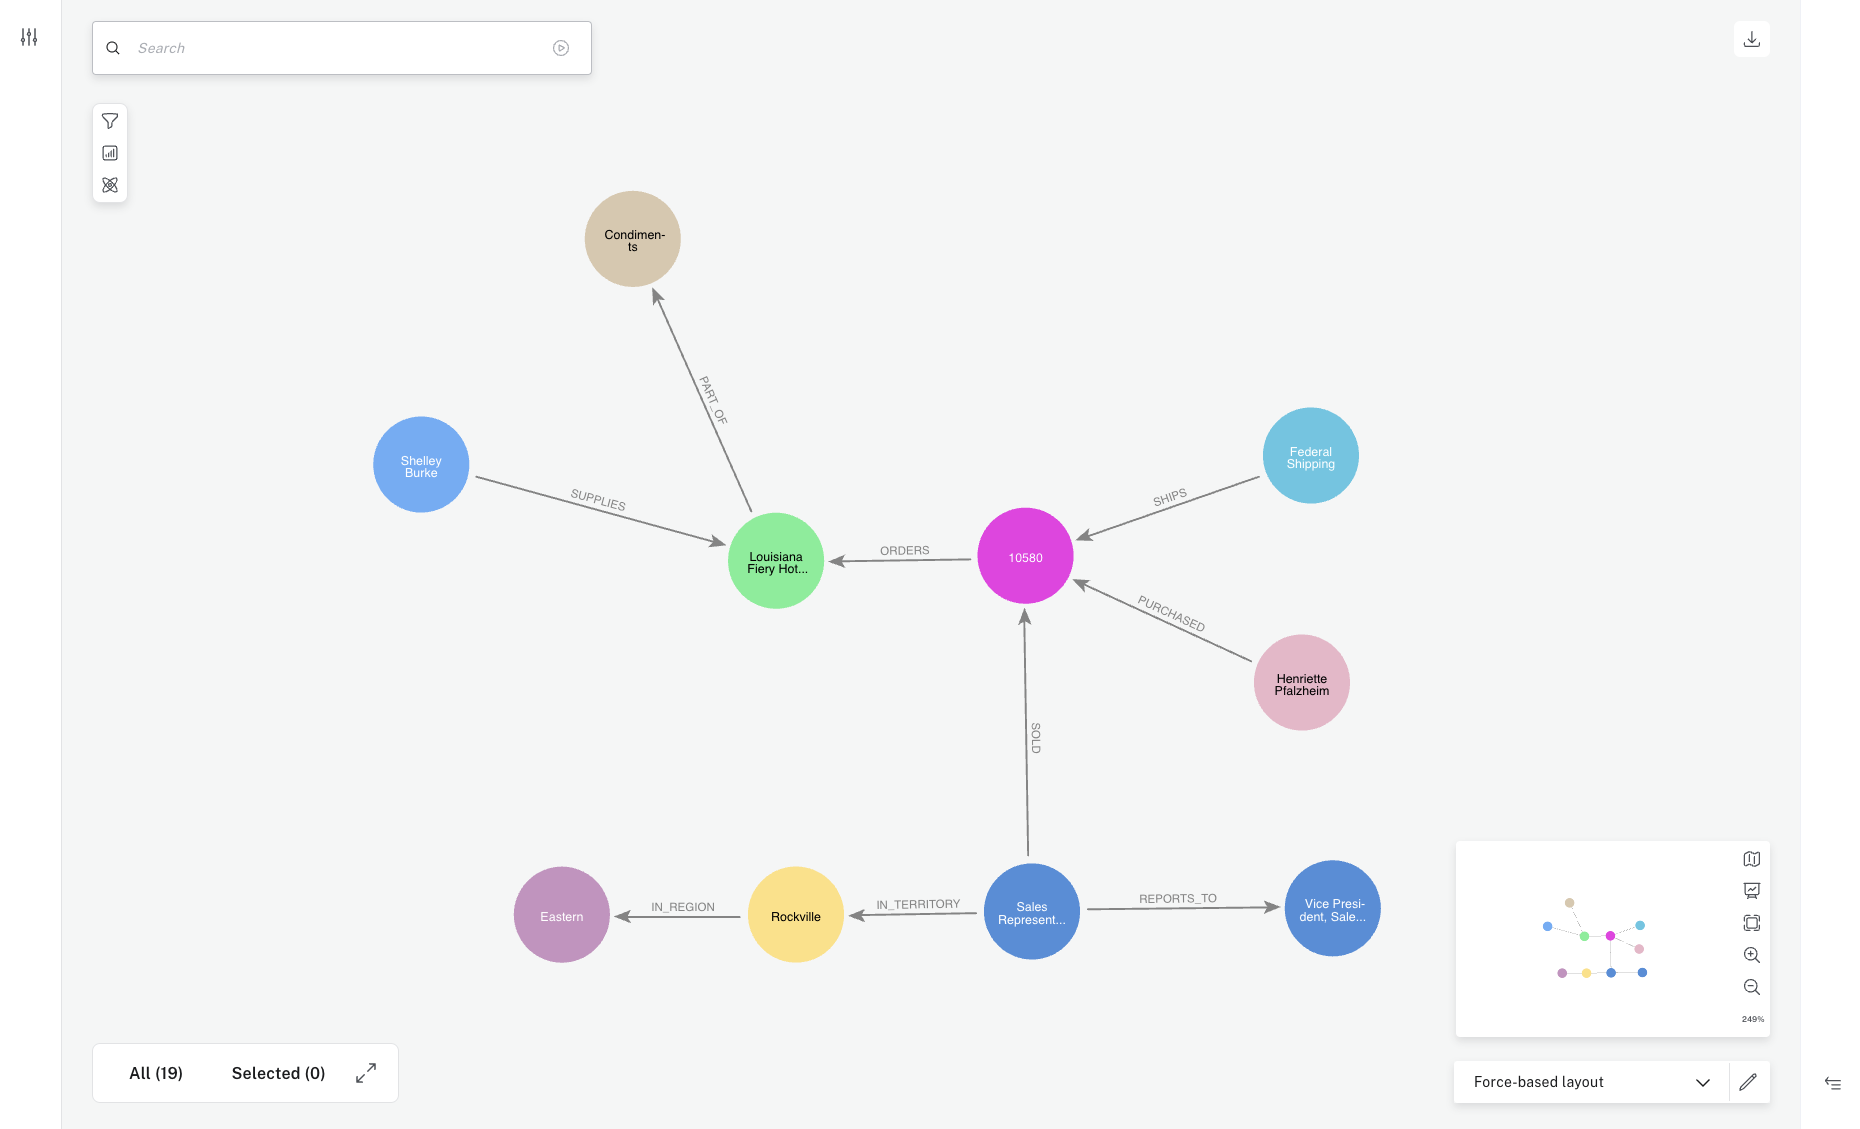
The dataset used is the Northwind example data set. Northwind is a fictional company with a database that tracks their product catalog, sales orders, and sales staff.

When importing Northwind directly into a Neo4j graph there is a 1:1 correspondence of tables to labels, which means that for each record a node has been created with a label that matches the original name of the table. Each foreign key reference gets converted into a graph relationship.
After connecting to the instance that contains this Neo4j database and launching Explore for the first time, Explore automatically generates a Perspective based on the data it finds. If you have any previously defined Perspectives, they are available for selection. You can always ask Explore to auto-generate a Perspective. The auto-generated Perspective is a good place to start. Explore categorizes the nodes into entities, select useful captions and assign color-coding.
Keep in mind though, that when Explore auto-generates a Perspective, a complete scan of the database is performed. If your database is large, i.e. > 10,000,000 nodes and relationships combined, this will take a long time and you can opt for a quick scan instead. See Database scans for more information. The Northwind example data set is not large and Explore can quickly auto-generate a Perspective.
By contrast, when Explore creates an Auto-perspective the first time you open it with a new database, it samples a node from each category it finds and use the properties in the sampled node. As with any other perspective, as you query more data, Explore adds any new properties as they are found.
You are able to search and explore the entire Northwind graph.
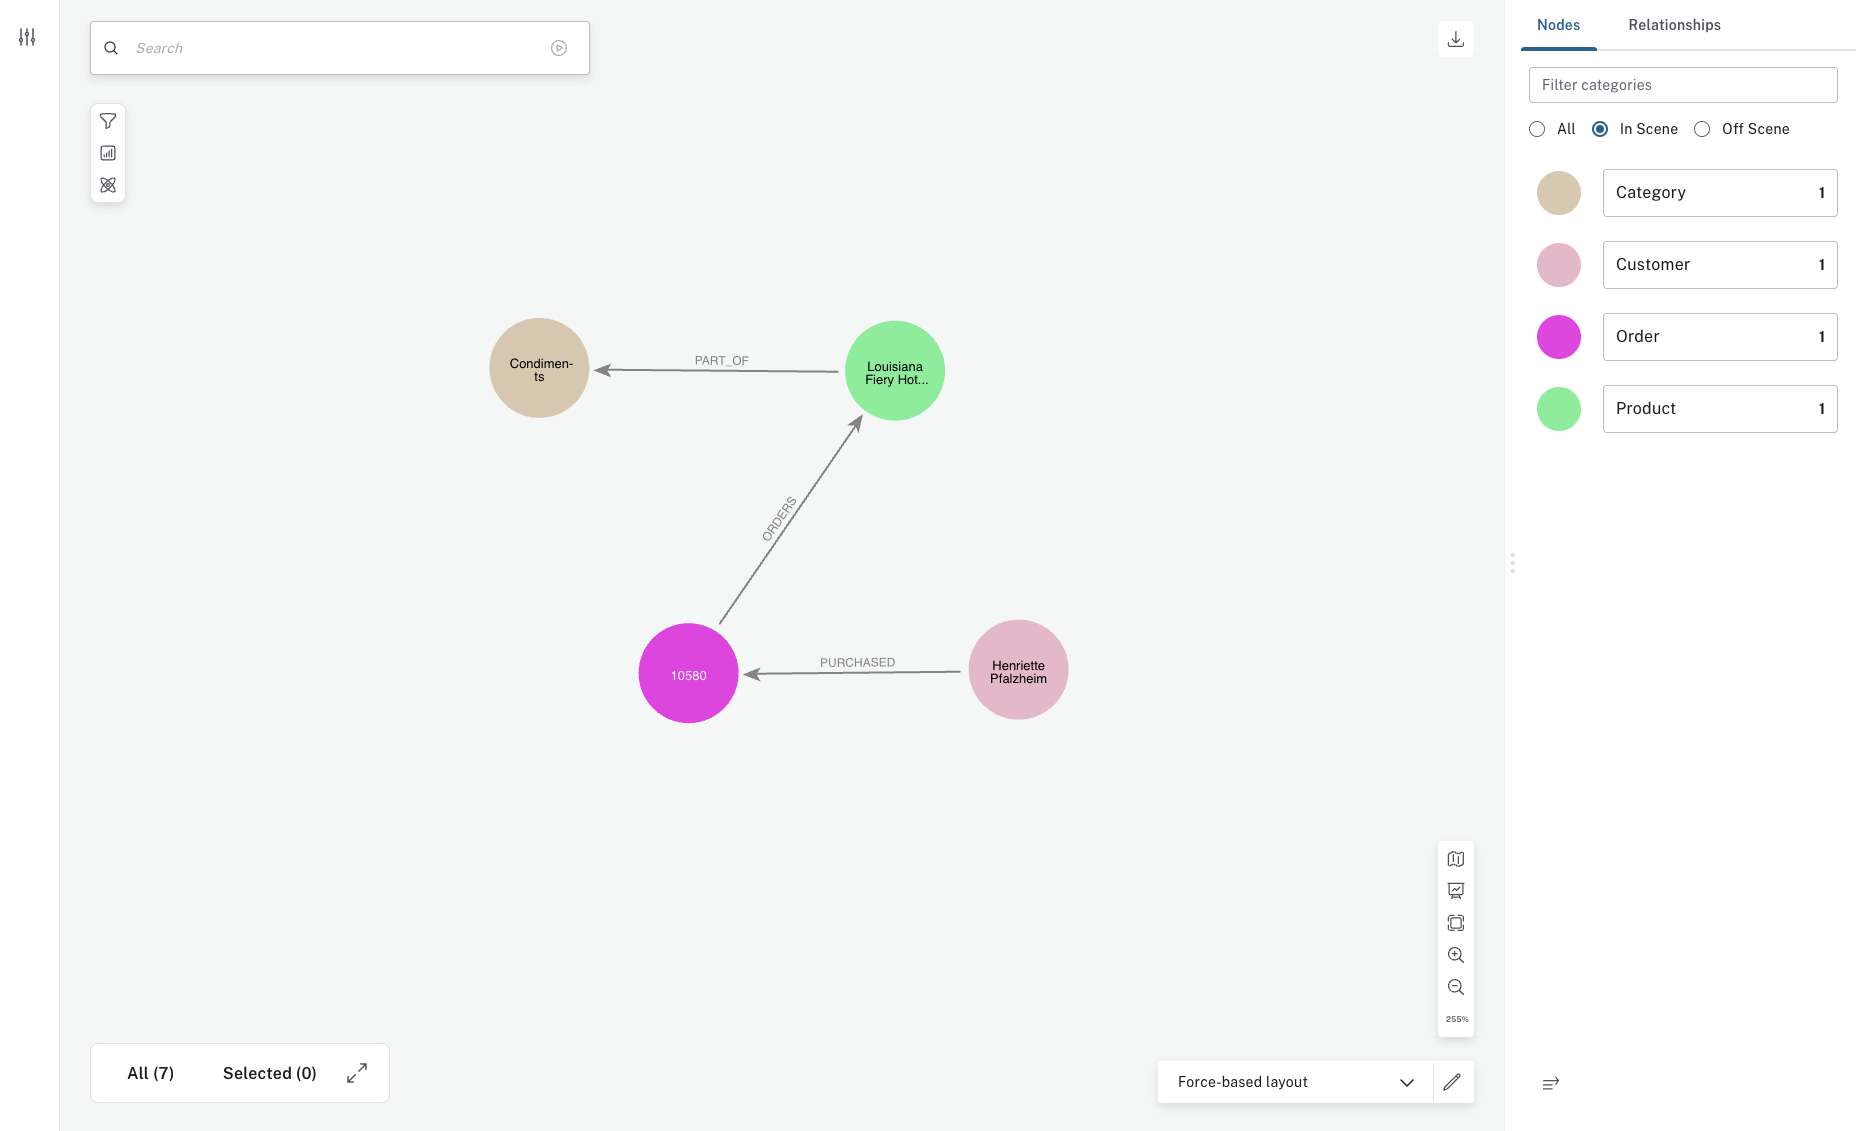
While everyone in the organization could benefit from a graph view, not everyone needs to see everything. For instance, the shipping department of Northwind may only need to see orders, products, and customers. You can create another Perspective that highlights only those categories.
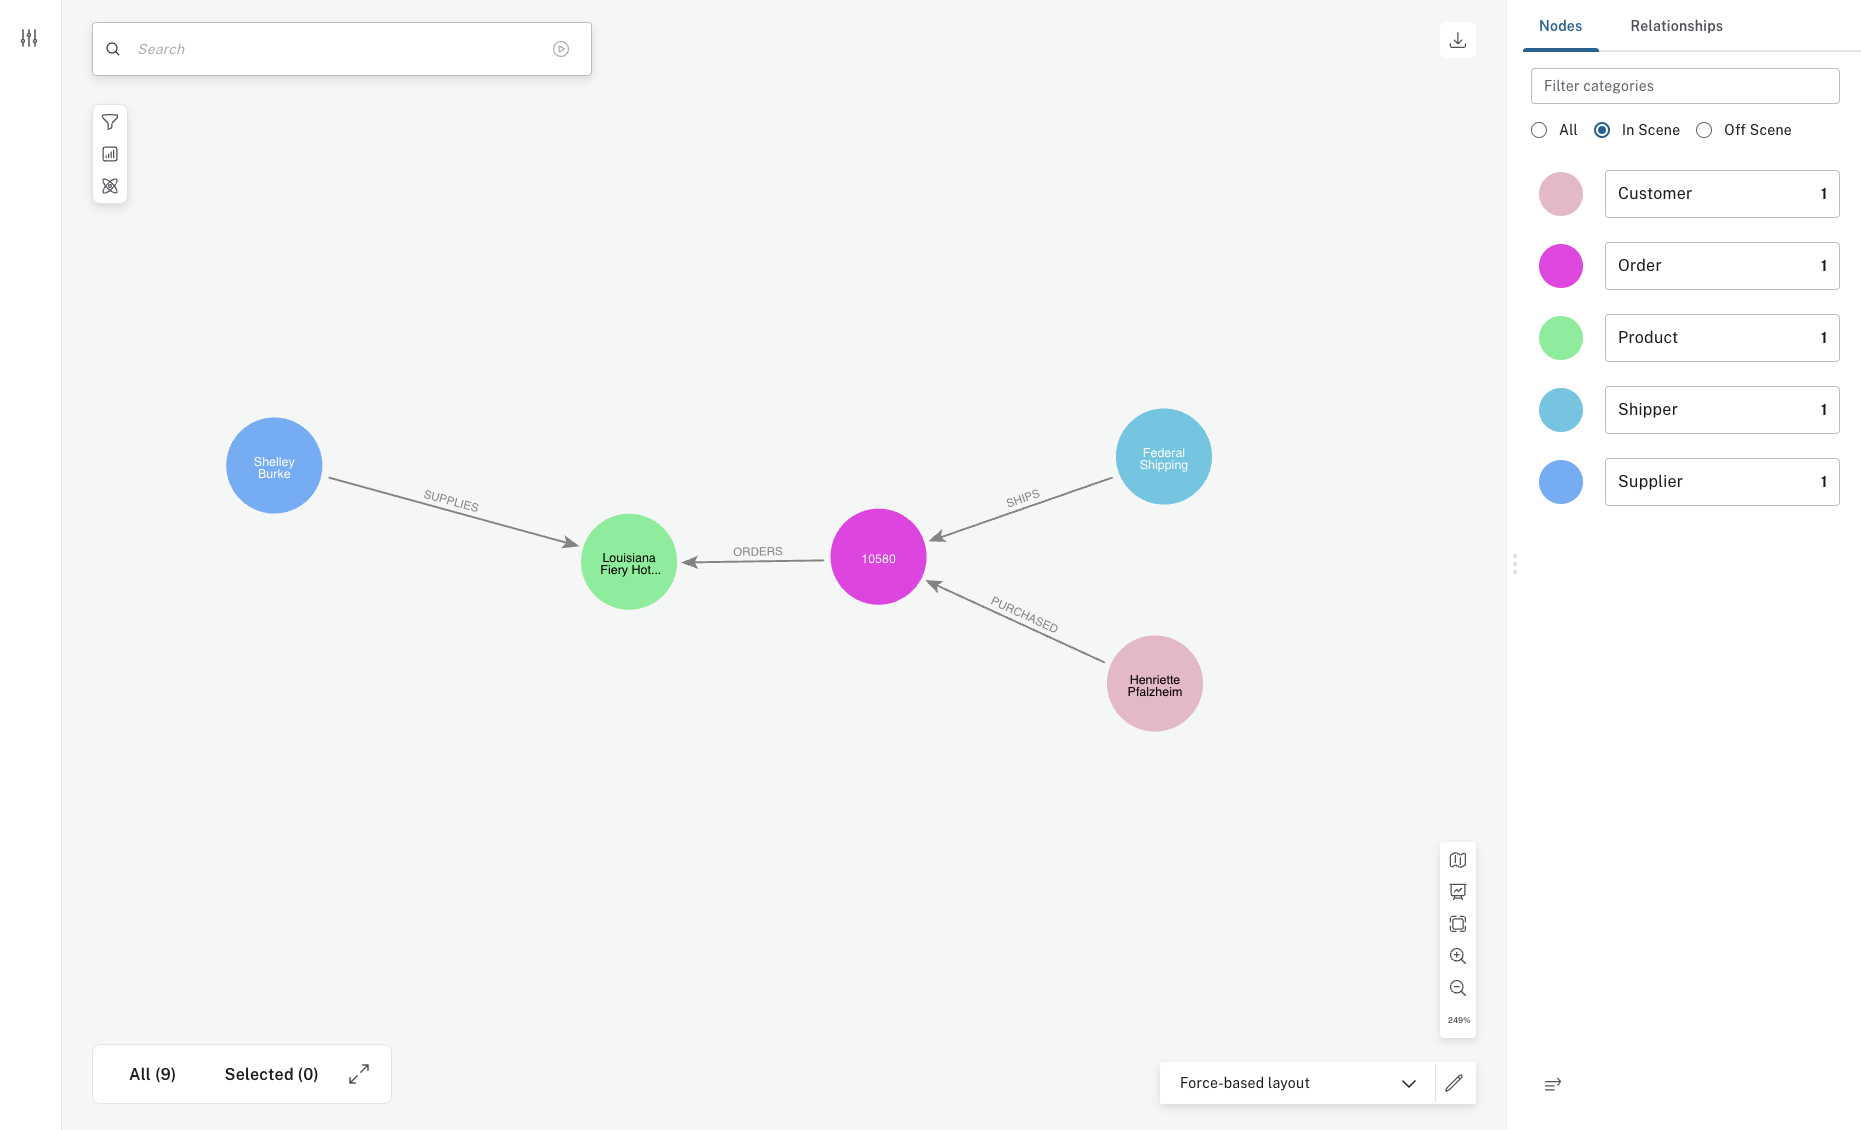
Similarly, you can create Perspectives that are specific to the sales department, purchasing department, or customer service department.
