
With the release of Neo4j 4.0 comes an exciting new feature, called Neo4j Fabric. The operational principle of Neo4j Fabric is in essence quite simple – it provides a way to issue Cypher queries that target more than one Neo4j database at once.
This capability can be used in a number of interesting ways, including data federation and analysis across separate databases, horizontal scaling of data storage and processing, or different hybrid deployments.
In a series of blog posts, starting with this one, we will explore the use of Fabric to achieve horizontal scaling, i.e. sharding, of the well-known and challenging LDBC Social Network Benchmark graph.
Sharding graph data is a notoriously hard problem. We will show how we achieve sharding using Neo4j Fabric, where we store shards as separate and disjoint graphs, meaning that relationships will not span shards. Such relationships are instead modeled using what we call proxy nodes and correlating id values. We will rely on knowledge about the data model, what queries we will be running, and what we want to optimize for, to create a sharded data model for the specific use case.
Finally, we will show how Fabric can improve the query performance, by comparing query times and throughput between the sharded and non-sharded versions.
Overview of LDBC Social Network Benchmark
The LDBC Social Network Benchmark supplies a data model specification along with a data generator, and a set of query specifications. It is important to note that we are not using the benchmark workload as specified by the benchmark, but rather borrowing its data model and queries for a different kind of exercise. This test is to demonstrate the differences between sharded and non-sharded configurations and to explore considerations for graph sharding, not to present an industry benchmark.
Data model
A full description of the LDBC SNB data model can be found in the specification. We will provide a simplified overview here, expressed in the way the schema looks when imported into Neo4j.
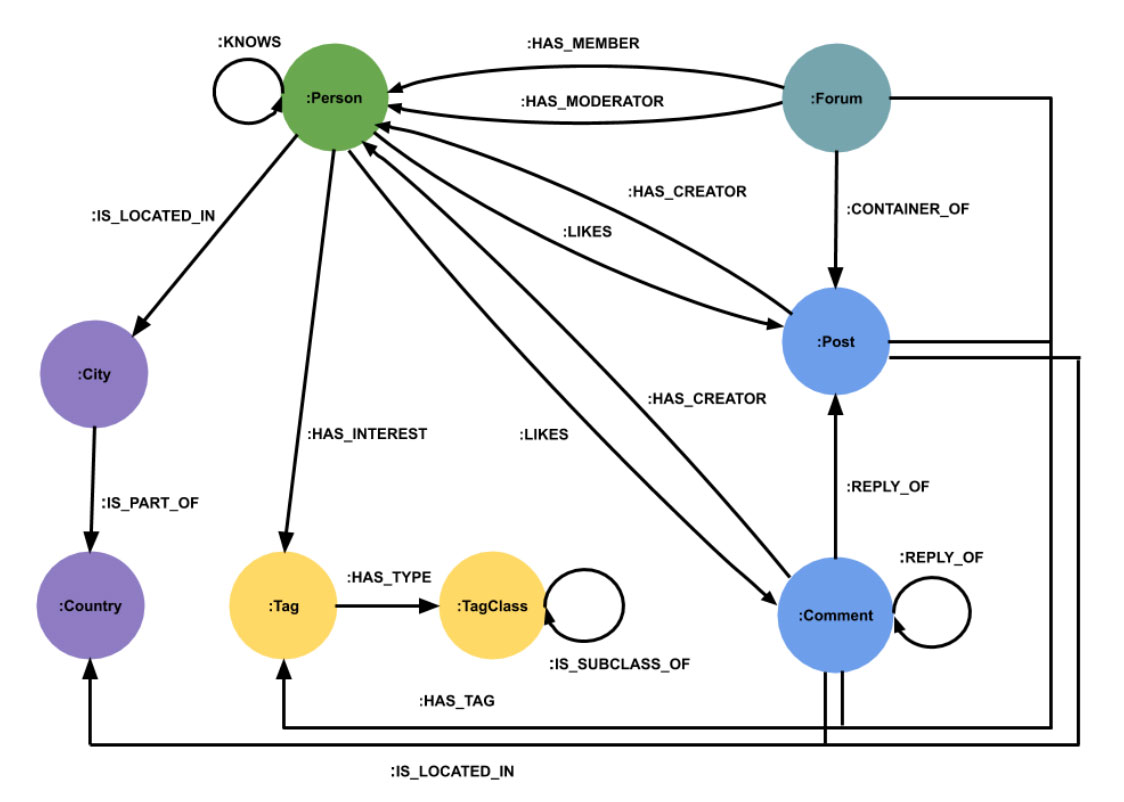
The model contains a component consisting of persons and their friendship relationships, forming the core of the social network. The largest part of the graph, in terms of data sizes, is the message board component that models forums containing posts and comment reply chains. Persons can be related in a number of different ways to the forums, posts and comments.
Forums, posts and comments have tags and each person can have a set of tags representing their interest. Tags are categorized in classes.Persons are located in cities which are part of countries and each post or comment is also created in a country.
The full model contains a few more entities such as university, company and continent, which we will leave out of this description for now.
Sharding the data model
Sharding a data model is always a complex problem with no universal solution. Deciding which relationships to “cut” depends not only on the model itself, but also on the data distribution and expected query execution patterns.
Sharding based on a country or a region might seem like a natural candidate. Such a sharding scheme is based on an assumption that users are more likely to know and interact with people from the same country. It is beyond the scope of this post to discuss in detail why this sharding scheme is not optimal in this case. The simplified explanation is that a typical query would have to make too many “jumps” across shards.
After considering a number of options, we decided on the sharding scheme described below.

The chosen sharding scheme is heterogenous, meaning that not all shards contain the same kinds of data. All persons and data related to them are kept on a single shard. Forums, their posts and comments are distributed on the remaining shards. The geographical data and the tag structure is duplicated onto every shard. The forum shards contain stripped down proxy node representations of persons, with only their original id property retained.
This sharding scheme has two advantages. First, it allows efficient querying of relationships between persons, which is vital in many of the queries. Second, since the forums essentially form a forest, they can be distributed across the remaining shards without the most important relationships broken across shard boundaries.
Placing all persons on a single shard is not a problem as there are orders of magnitude more messages and comments than persons. In theory, if the social network grew so much that the Person graph could not efficiently fit on a single machine, it could be sharded even further.
Similarly, duplicating tags, cities and countries on all shard is not a problem, because this data is quite small and static.
Test Results
We envision a number of test scenarios to evaluate the performance of the sharded model described above. In particular we are interested in comparisons to a non-sharded setup and in how performance properties change as the number of shards grows. The scenario we will focus on here is to look at how read performance scales as we split the dataset across an increasing number of ever-smaller shards.
We would like to stress that we just borrow the data model, data generator and queries from LDBC Social Network Benchmark, but the goals and methodology of our test executions are different.
Queries
The LDBC SNB specifies a number of queries, grouped into several categories. We have chosen four queries (Query 4, Query 6, Query 7 and Query 9) from the “Interactive Complex Reads” category that we feel are representative of that workload and we will demonstrate our results on them. Definitions of these queries can be found in the LDBC SNB specification.
The Fabric Cypher implementation of these queries can be found here.
In future posts, we hope to share results from more of the queries as well as from other interesting test scenarios.
Measurement setup
Our dataset is generated using the LDBC SNB data generator at scale factor (SF) 1000. It contains roughly 2.7 billion nodes. The csv files created by the data generator weigh in at about 1TB.
We imported the generated data into Neo4j in four different configurations
- 1 shard (no proxy, monolithic reference)
- 10 shards (1 Person shard, 9 Forum shards)
- 20 shards (1 Person shard, 19 Forum shards)
- 40 shards (1 Person shard, 39 Forum shards)
The shards were deployed each running Neo4j 4.0 on separate AWS EC2 instances. Memory limits were configured to keep the total available amount across all shards constant, at 1800GB. Other than memory limits, the Neo4j instances have default settings.
| # Shards | Shard instance type | Memory (GB) | |||
| Total | Per shard | Page cache | Heap | ||
| 1 | x1.32xlarge (128C, 1,952GB) | 1,800 | 1,800 | 1,600 | 200 |
| 10 | m5d.12xlarge (48C, 192GB) | 1,800 | 180 | 160 | 20 |
| 20 | m5d.8xlarge (32C, 128GB) | 1,800 | 90 | 80 | 10 |
| 40 | m5d.4xlarge (16C, 64GB) | 1,800 | 45 | 40 | 5 |
Latency measurement
Query latency was measured by executing a single query at a time, back-to-back, while recording the time from submission until the complete consumption of results for each query. Query parameters were supplied to each query execution in the sequence they appear in the LDBC parameter files. An initial set of query executions are considered “warm-up”, and are excluded from statistics. The Fabric proxy was deployed on a single separate instance of type t3.2xlarge (8C, 32GB)
Throughput measurement
Maximum query throughput was measured by increasing the number of concurrently issued queries over time until error rates or latencies start falling outside of defined parameters. The Fabric proxy was deployed on a single separate instance of type c5.24xlarge (96C, 192GB)
Results
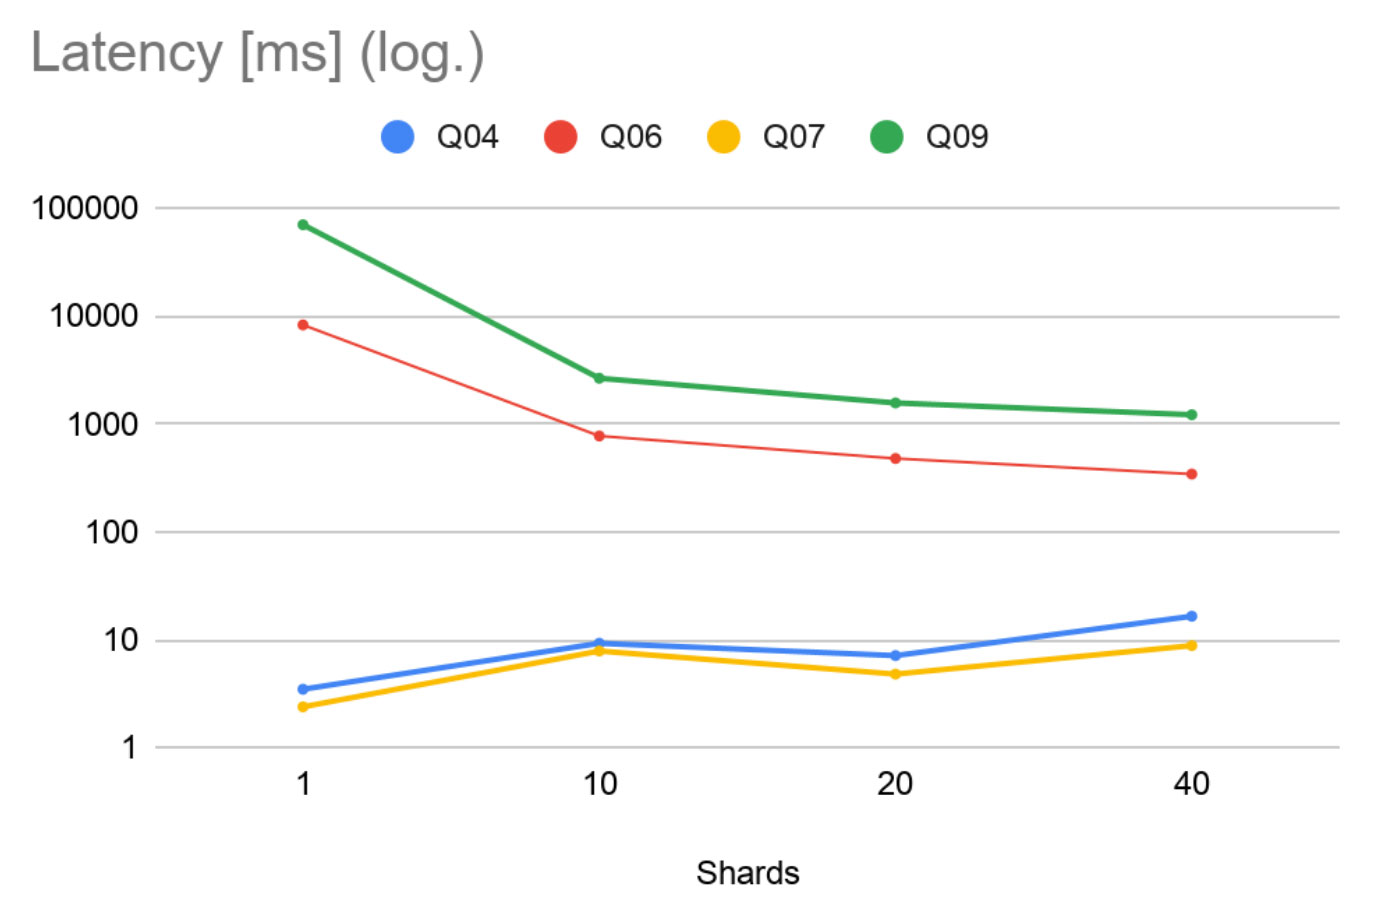
These results show that Q06 and Q09 are much heavier than Q04 and Q07. We can see that the heavy queries get a significant decrease in latency as we increase the number of shards (note that the plot has logarithmic scale). For lighter workloads, latencies increase as expected due to communication overhead becoming more dominant. Still, we manage to maintain low millisecond latencies for Q04 and Q07.
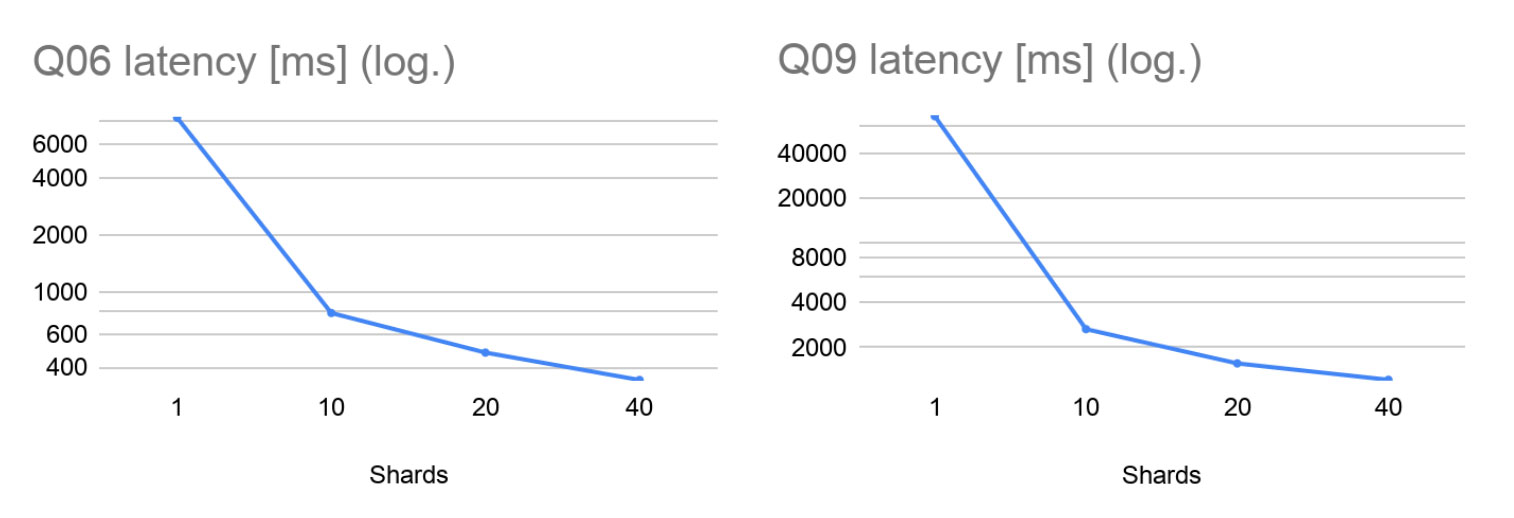
Taking a closer look at the heavy queries, we see that Q06 achieves ~11x speedup on 10 shards and ~17x speedup on 20 shards. Those are excellent results that show that Fabric achieves almost linear speedup for this type of workload if the number of shards is reasonable. No workload can be parallelized indefinitely with the same speedup, and at 40 shards we achieved a ~24x speedup. These results are very promising, showing that parallelizing execution with Fabric has a far greater impact on latency than communication and coordination overhead does.
The latency measurements run only a single query at a time though. The following graphs show the concurrent throughput capabilities, i.e. the measured maximum number of executed queries per second.
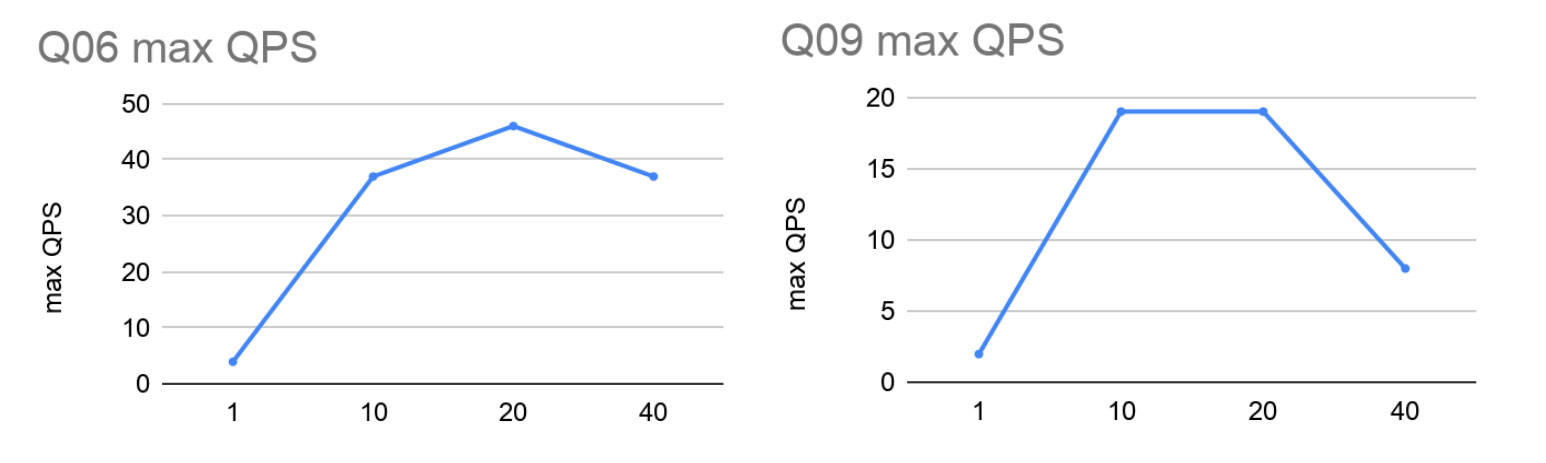
Again we see impressive performance gains going from a single instance to 10 shards. Interestingly, the increase in max throughput increases by more than the number of added processor cores as we go from single instance to 10 shards. This can be explained by the fact that using 10 machines not only adds more processor cores, but also increases other resources such as total memory bandwidth.
Since we have no good way to limit the number of available cores on the shard machines to balance the total amount of computing power, the following plots show the max QPS normalized to the total hourly cost of the entire setup on AWS EC2.
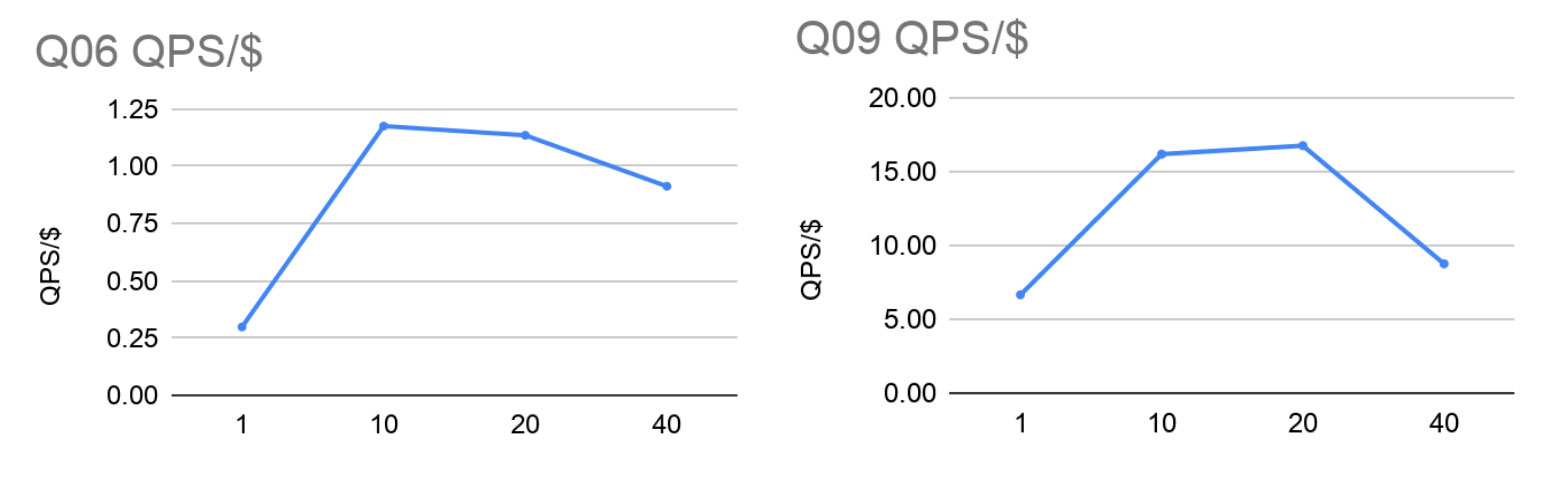
Conclusion
Our experience shows that a carefully designed manual sharding scheme, where knowledge about data distribution and query access patterns are taken into account, can achieve great performance gains.
The tests show that using Neo4j Fabric, we can achieve impressive performance gains for complex queries, both in read query query latency and in total read query throughput. For lighter queries, Fabric maintains very low query latencies.