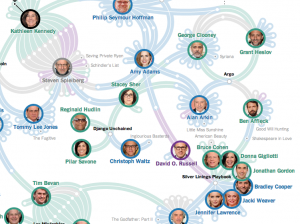
The New York Times graphs this year’s Oscar Contenders, revealing the many connections between actors, directors, and producers.
click for interactive graph See the full article.
Keywords: graph visualization • Graph Visualizations • Oscars