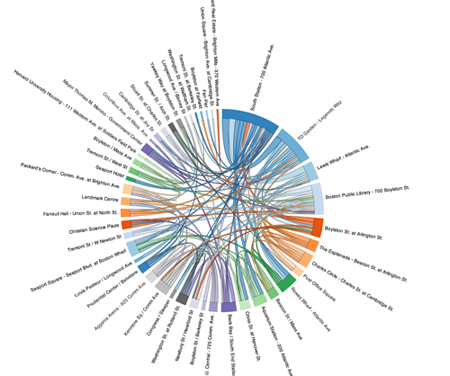
The Neo4j Community team is calling on Graphistas – Graph Database users – to participate in Boston-based Hubway Data Visualization Challenge.  Hubway, a bike-sharing program in metro-Boston, has publicly released all of the trip history of its bikes.  Data includes details about the station pick-ups and drop-offs as well as duration of bike usage.  Participants in the challenge are invited to a Hack Day to create data visualizations and analyze the data.
Hubway Data Visualization by Max De Marzi
Data Visualization by Max De Marzi, click to enlarge
Michael Hunger, Spring Data Neo4j and Neo4j Senior Community Lead, and Max De Marzi, Graph Database Enthusiast, have kicked off the project by building the dataset and data visualization, making it available to all Graphistas. – bringing graph love to the Hack Day on Oct 27th, – working on visualizations or – neo4j-spatial integration or – some advanced querying/statistics ? Blog: Using (Spring Data) Neo4j for The Hubway Data Challenge Related Links: Hubway Data Visualization Challenge Boston.com: Hubway shares data on over half a million Boston rides Hack Day: https://hubwaydatachallenge.eventbrite.com/  

Keywords: