
Jason Straughan learns how graph databases are changing the world
At just that moment when I was convinced the social networking revolution was no more enlightening than reality television, I began to realize that there was one great and powerful idea that needed this exact environment to gestate: the graph database. From Facebook’s Graph Search, to LinkedIn’s connection recommendations, graph databases are shaping the world around us. Although graph theory has been around for centuries, its penchant for highly-related datasets makes it an attractive alternative to traditional RDBMS solutions in some situations. What is a graph database? For those that are unfamiliar with graph databases, they do not store graphs in the chart sense, but rather graph structures. The three moving parts are nodes, properties, and relationships (edges). These can be visualized nicely in this image from wikimedia:
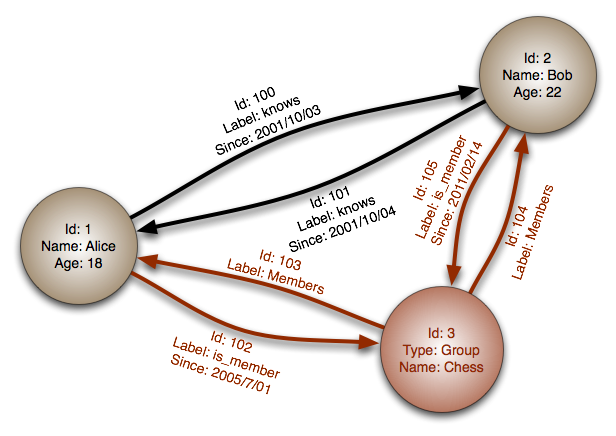 Just by looking at this first example, we can see that even representing a graph looks much different than the tables with relationship arrows that are generally associated with visualizing relational databases.
The circles in this diagram are referred to as nodes. Each node has an identifier, and then a set of properties represented as key/value pairs. Further inspection of these nodes reveal they are schemaless, with 2 of the nodes containing name and age properties, and one of the nodes containing type and name properties. This is common in other NoSQL databases, so we’ve not seen anything unique so far.
Next we can see the arrow pointing from one node to another. These arrows are relationships between the nodes. Relating database records is common in both the NoSQL and SQL worlds. In our graph example, the astute observer would notice these relationships also have properties that are represented as key/value pairs. Like their node counterparts, they are also schemaless, allowing arbitrary keys on different relationships. It is worth noting, in the graph world, these relationships are referred to as edges.
Why use a graph database?
The most often use case given as an example for graphs is social networking. This is also the arena that has (re)introduced graph structures to developers, however, graphs also offer a solution for modeling other data, and can be a powerful tool for recommendations, ratings, and highly interconnected data.
Once we begin to understand how the graph works, we can begin to see uses for it everywhere. Imagine dungeon games, where map locations, guild relationships, and other related data lives in a graph structure. Family trees also come to mind, where you can traverse a tree shaped graph to learn more about one’s heritage.
Traversal is the way we walk graph structures, and in a tree shaped result, it is referred to as walking the tree.
Walking trees (and other fun shapes)
Traversal is simply the process of working from one node to the next, using relationships, based on whatever parameters have been established. Tree traversal is more complex than walking a linear path, like steps 1 – 5, that can easily be visited in order. With a tree shaped data structure, you can choose paths to visit every node, or find paths based on other criteria to return subsets of the total structure.
Just by looking at this first example, we can see that even representing a graph looks much different than the tables with relationship arrows that are generally associated with visualizing relational databases.
The circles in this diagram are referred to as nodes. Each node has an identifier, and then a set of properties represented as key/value pairs. Further inspection of these nodes reveal they are schemaless, with 2 of the nodes containing name and age properties, and one of the nodes containing type and name properties. This is common in other NoSQL databases, so we’ve not seen anything unique so far.
Next we can see the arrow pointing from one node to another. These arrows are relationships between the nodes. Relating database records is common in both the NoSQL and SQL worlds. In our graph example, the astute observer would notice these relationships also have properties that are represented as key/value pairs. Like their node counterparts, they are also schemaless, allowing arbitrary keys on different relationships. It is worth noting, in the graph world, these relationships are referred to as edges.
Why use a graph database?
The most often use case given as an example for graphs is social networking. This is also the arena that has (re)introduced graph structures to developers, however, graphs also offer a solution for modeling other data, and can be a powerful tool for recommendations, ratings, and highly interconnected data.
Once we begin to understand how the graph works, we can begin to see uses for it everywhere. Imagine dungeon games, where map locations, guild relationships, and other related data lives in a graph structure. Family trees also come to mind, where you can traverse a tree shaped graph to learn more about one’s heritage.
Traversal is the way we walk graph structures, and in a tree shaped result, it is referred to as walking the tree.
Walking trees (and other fun shapes)
Traversal is simply the process of working from one node to the next, using relationships, based on whatever parameters have been established. Tree traversal is more complex than walking a linear path, like steps 1 – 5, that can easily be visited in order. With a tree shaped data structure, you can choose paths to visit every node, or find paths based on other criteria to return subsets of the total structure.
 This is an example of a binary tree, being traversed in order. Following the dotted line, we can see how the tree is traversed, or walked, to get all the nodes along the edges.
Shapes refer to named structures found in graphs. Most are named after the way they look when visualized. Popular shapes include trees, stars, wheels, and many others.
This is an example of a binary tree, being traversed in order. Following the dotted line, we can see how the tree is traversed, or walked, to get all the nodes along the edges.
Shapes refer to named structures found in graphs. Most are named after the way they look when visualized. Popular shapes include trees, stars, wheels, and many others.
 A star graph shows one node, with all the nodes directly connected to it via an edge (relationship).
Now that we’ve reviewed the basics of graphs and their structures, lets take a look at using them in an actual database.
A star graph shows one node, with all the nodes directly connected to it via an edge (relationship).
Now that we’ve reviewed the basics of graphs and their structures, lets take a look at using them in an actual database.
Keywords: Graph Databases • neo4j