
The World’s Leading Companies Use Neo4j to Manage Supply Chains, Boost Resilience and Ensure Business Continuity
U.S. Army, Caterpillar, Lockheed Martin Space and Others Harness Graph Databases for Supply Chain Analytics
SAN MATEO, Calif. – May 27th, 2020 – Neo4j®, the leader in graph technology, announced a surge in demand from organizations looking to use graph databases to more effectively manage supply chains and ensure business continuity.
Neo4j customers were among the first to realize that graph technology is essential to optimize flow of goods, uncover vulnerabilities, and boost overall supply chain resilience. Effectively managing today’s supply chains requires analyzing interdependencies as well as uncovering the kind of hidden risks that cause rippling disruptions. Examples of companies using Neo4j to optimize their supply chains include:
- U.S. Army – to track equipment maintenance and support
- Caterpillar – to analyze and automate product maintenance and supply chain management
- Lockheed Martin Space – to integrate processes and data across the entire product lifecycle
- Volvo Cars – to align product design with customer requirements
- Daimler – to understand the skillsets in its workforce to bring together cross hierarchical teams
- Airbus – to re-invent their maintenance process
The current climate illustrates how vulnerable even the most robust global supply chains really are. As some economies try to reopen while others remain shut down, organizations must plan for short- and long-term uncertainties including:
- Shifts in consumer buying patterns
- Changes in production protocols and regulations
- Unpredictable costs for raw materials, warehousing and freight
- Fraud and counterfeit production of in-demand items
- Unstable supplier networks
Modern supply chains are complex networks spanning factories, suppliers, warehouses, transportation, labor, components and processes. These interdependent systems are increasingly difficult to visualize and analyze using traditional relational database approaches, due to data model and query complexity, as well as performance for both real-time transactions and graph analytics.
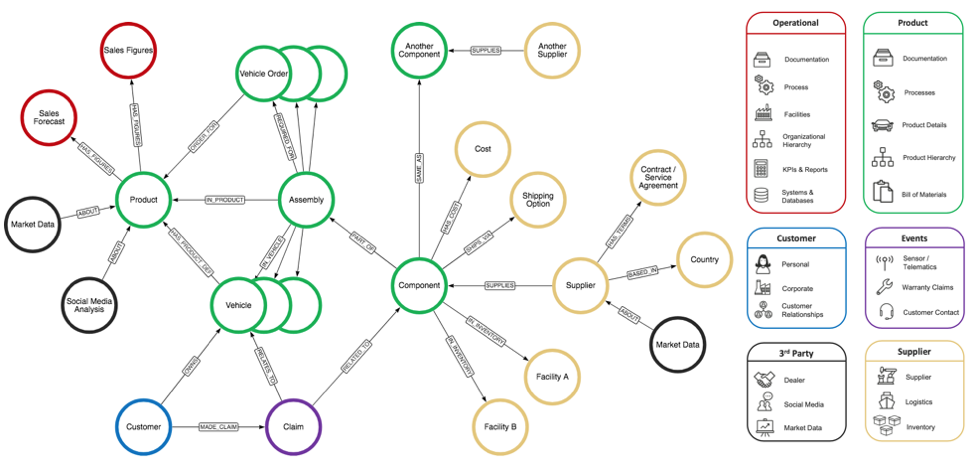
Caption: An example of the variety of data types within an automotive industry supply chain. When analyzing these entities in a Neo4j graph database, the interconnections – and thus the vulnerabilities – of the supply chain become clear.
Comprehensive supply chain analysis, visualization and exploration require absolute clarity on the relationships between entities. Gartner recently published COVID-19 Demands Urgent Use of Graph Data Management and Analytics in April 2020 that addresses the importance of data relationships.
“Graph analytics shows how relationships are not just as important as the relevant data, but are effectively part of that data. Therefore, this technology should never be considered optional in any analysis. Graph analytics particularly excels at data discovery because it enables users to discover the “unknown unknowns” — to see patterns in data when we don’t know the right question to ask in the first place. Graph analytics makes this possible by teasing out relationships that are not obvious, through nonobvious relationship awareness (NORA).”
Frédéric Daniel, CTO of Transparency-One, explains that current supply chain disruption has made sourcing less reliable overall. These factors put businesses at increased risk of delivering products that fail to meet government or corporate standards, such as federal regulations or fair-trade principles.
“Graph databases are agile and adaptable, and Neo4j graph technology makes it possible to store, view, search and analyze across millions of nodes regardless of the depth or complexity of the supply chain,” Daniel said. “This enables Transparency-One customers to quickly identify how an impacted supplier, facility or component affects their entire portfolio, so they can take corrective action. Neo4j provides powerful computing capabilities required to facilitate complex supply chain analyses that help businesses quickly identify vulnerabilities and respond to disruption.”
Alex Mills, Ph.D., Associate Professor at the Zicklin School of Business, Baruch College, City University of New York, focuses his research on healthcare systems’ response to disruption. He shared his thoughts on the “bullwhip effect” being experienced as a result of atypical demand.
“Healthcare systems are working to respond to disruptions in the supply of equipment and medications, while at the same time working to minimize supply chain risk,” Mills said. “Many organizations make the assumption that manufacturer diversity will mitigate risk, but it is more complex than that. For example, say you have four overseas manufacturers of throat swabs, but they all rely on the same importer, who is in turn relying on air freight, which has been severely reduced by drastically decreased passenger flights. In this case, a bottleneck remains in the supply chain and the swabs will not reach their destination in a timely manner.”
Amy Hodler, a Neo4j expert in graph analytics and network science, discussed the importance of understanding both the obvious and the subtle dependencies in today’s supply chains.
“Many failure points are nuanced and hard to spot,” Hodler said. “For example, a faulty assembly or the use of a suboptimal adhesive can be difficult to trace to the root cause. Oversights like these lead to increased business liability and recalls. Only a native graph database efficiently persists these complex relationships with high fidelity, and only graph analytics effectively answer these otherwise-intractable questions about supply chain structures.”
Neo4j and Supply Chain Analytics
Representing, visualizing and exploring a supply chain as a graph illuminates the complex, layered relationships between manufacturer and customer so that data scientists and analysts can easily create complex queries. In addition, Neo4j for Graph Data Science™ provides a toolkit to further evaluate and de-risk supply chains, including graph algorithms such as:
Pathfinding algorithms assess route availability and cost across the supply chain. They identify redundancies and quickly perform “what-if scenarios” for more diverse routing and contingency planning.
Centrality algorithms uncover bottlenecks and critical infrastructure that can compromise the entire supply chain. For example, the Betweenness Centrality algorithm finds essential connections in the graph so organizations proactively identify risks and optimize alternatives.
By combining the power of graph queries and the algorithms, the Neo4j Graph Data Science Library provides a unique competitive advantage to manufacturers, retailers, and logistics companies looking to quickly adapt to challenging environments.
Find Out More
Additional information can be found on the Neo4j blog or by visiting neo4j.com/supplychain. A virtual event Connections: Graphs in Risk Mitigation taking place on July 28th will feature several Neo4j customers discussing their risk mitigation strategies.
Get your free copy of the Gartner report COVID-19 Demands Urgent Use of Graph Data Management and Analytics.
Resources
- Neo4j for Supply Chain Analytics
- Neo4j Graph Database 4.0
- Neo4j Cloud Deployment
- Neo4j Community
- Neo4j on Twitter
- Neo4j on LinkedIn
- Neo4j on YouTube
- Neo4j is Hiring
About Neo4j
Neo4j is the leading graph database technology that drives innovation and competitive advantage at Airbus, Comcast, eBay, NASA, UBS and more. Thousands of community deployments and more than 400 customers harness connected data with Neo4j to reveal how people, processes, locations and systems are interrelated. Using this relationships-first approach, applications built using Neo4j tackle connected data challenges including artificial intelligence, fraud detection, real-time recommendations and master data.
Find out more at neo4j.com.
Share this on Twitter.
Contact:
pr@neo4j.com
neo4j.com/news/
© 2020 Neo4j, Inc., Neo Technology®, Neo4j®, Cypher®, Neo4j® Bloom™ and Neo4j® Aura™ are registered trademarks or a trademark of Neo4j, Inc. All other marks are owned by their respective companies.