
094 Genealogy With Different Graph Technologies for Data Collection and Visualization – NODES2022


Chapters 11
- Play from Véronique Gendner & Information Design presentation, Genealogy use case introduction
- Play from TheBrain demo : documentation collection, in a graph structure
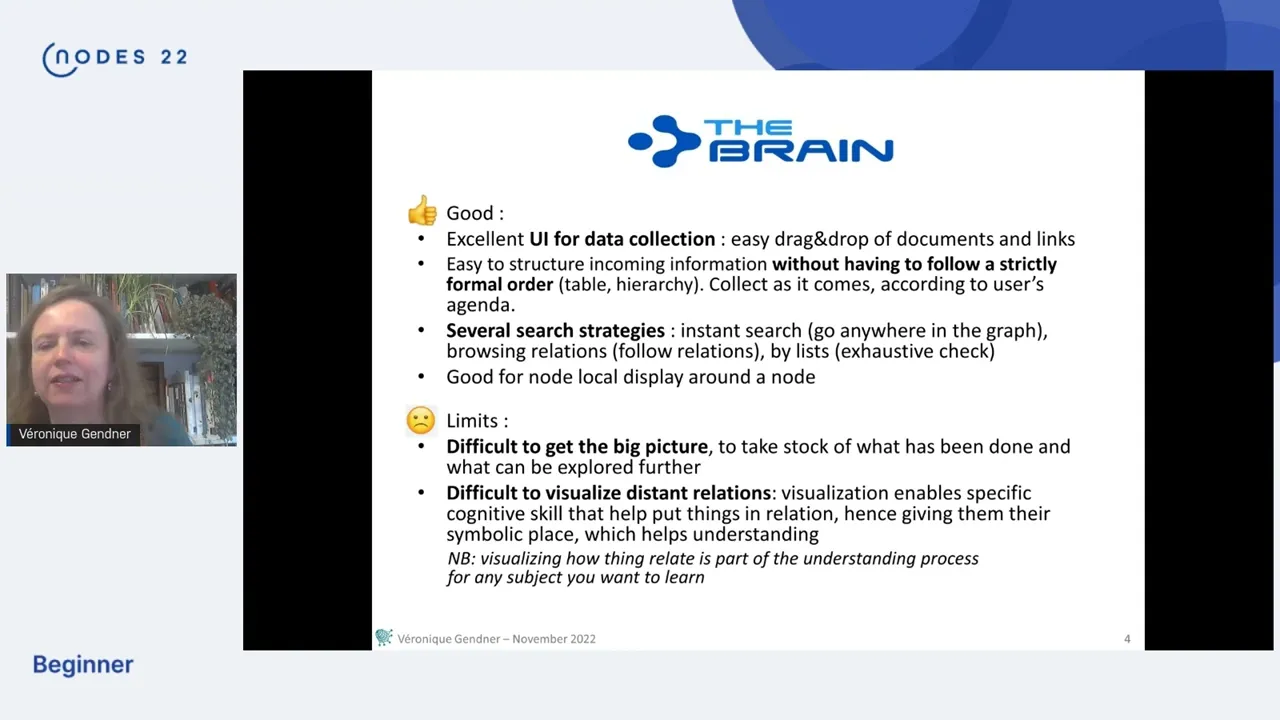
- Play from TheBrain limits
- Play from Gramps visualization and data format
- Play from Neo4j pivot data model
- Play from data transfer process
- Play from generating visualizations with Gramps and Gramps limits
- Play from use of graph topology
- Play from Bloom demo of visual and interactive exploration of the data
- Play from yWorks demo to make precisely selected information of interest, stand out on a graph display
- Play from wrap up and questions
Graphs are a very interesting structure to get the best of human thinking combined with automatic processing. Through a very intuitively graph based use case - genealogy - the presentation takes genealogical researches as an example to illustrate possibilities that can be applied to many domain of research. It is demoing several graph issues and technologies, from data collection to visualization, including data transfer from one app to another:
- documentation collection, in a graph structure, with TheBrain Technologies application,
- Gramps visualizations based on a family tree specific layout algorithm
- Bloom for visual and interactive exploration of data structured in graph and
- yWorks to make precisely selected information of interest, stand out on a graph display
- as well as Neo4j graph database as a pivot technology, to make use of graph topology and graph pattern matching
Data collection and export/import process from TheBrain to Gramps via Neo4j are presented, graph models are discussed.
Speakers: Véronique Gendner
Format: Full Session 30-45 min
Level: Beginner
Topics:
Region: EMEA
Visit neo4j.com/nodes-2022 learn more at neo4j.com/developer/get-started and engage at community.neo4j.com (opens in a new tab)
Resources mentioned
- Watched Duration: 30:06

- Watched Duration: 36:01

- Watched Duration: 47:06

- Watched Duration: 26:09

- Watched Duration: 30:48

- Watched Duration: 34:17
- Watched Duration: 18:21

- Watched Duration: 33:44
