Why Leading Telecoms Use Neo4j: The 5-Minute Interview with Jesús Barrasa, Global Director of Telecoms at Neo4j

Product Marketing Manager, Neo4j
5 min read

“Neo4j not only gives you an accurate and timely representation of your network with all the services and all the elements involved in the delivery of those services, but it’s also a platform where you can build logic that will simplify and accelerate automation,” said Jesús Barrasa, Global Director of Telecoms at Neo4j.
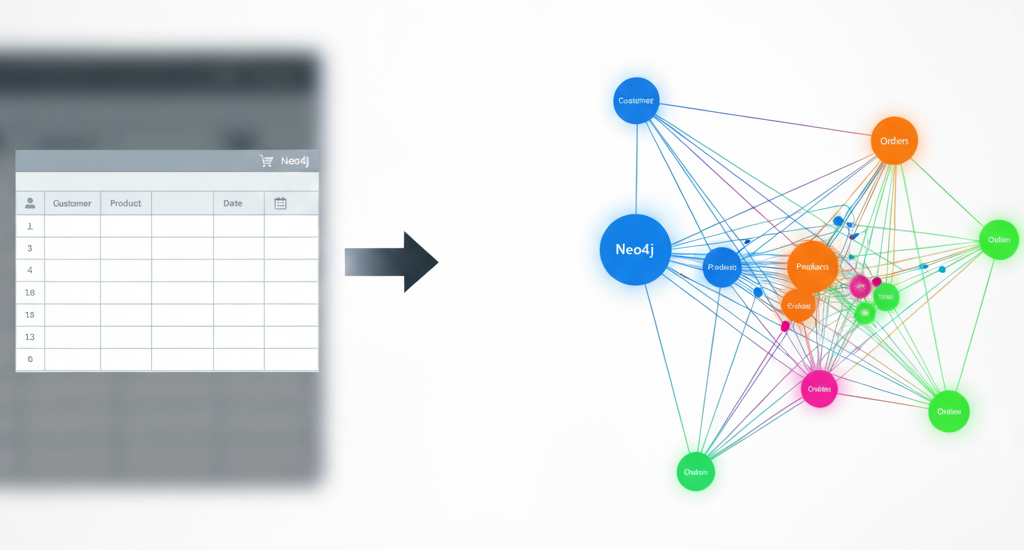
A graph database like Neo4j allows for much greater flexibility than a traditional relational database, and this is especially true in the telecom world, where the flexibility of the graph data model supports rapid evolution and innovation.
In this week’s five-minute interview (conducted at GraphTour NYC 2019), Jesús Barrasa shares his thoughts on why he appreciates the flexibility of the model, how he is amazed by the performance of graphs and the benefits of graph technology in the telecom space.
What is your favorite aspect of working with graphs?
There are two things that I love about graphs, and one of them is the flexibility of the data model. You don’t have to spend weeks coming up with the perfect model, so you can be very agile. You can iterate without having to go through a painful migration every time there’s a change. I like this flexibility a lot.
Another thing that I’m amazed about is the performance of graphs. Native graphs like Neo4j in particular. I’ve been involved in a number of projects at Neo4j over the last four years, but I’m still amazed by the performance of things like path traversals and local queries.
What brought you to Neo4j?
It’s funny because I have spent my whole career in the graph space in a way. When I finished university, I did my PhD in semantic technologies, and semantic technologies interestingly use the same abstraction: they represent the world as graphs, as connected entities.
I was doing graphs from that point on, and I worked for a company that was using the semantic technologies and modeling network topologies. I’ve been working with telcos and graphs for quite a while.
But then I took a break to work on data integration, and interestingly I was following Max De Marzi. He posted a tweet looking for an engineer based in London who loves graphs. I said, that’s me! It’s something that was meant to happen at some point, so that’s the journey. It’s been graphs all the way.
What is unique about learning Neo4j?
I had been through the high level modeling of domains as graphs, so I was familiar with representing things as connected entities. As I mentioned, I came from the RDF world where things are slightly different. For example, relationships in Neo4j are uniquely identified and you can associate properties with them. That was a bit of a change for me.
Another very important element of the learning curve with Neo4j is that you have to understand the engine. You have to understand what we call our secret sauce: how we store data. A good understanding of that enables you to build the right models and to write the right queries so it’s quite simple.
Because graphs are very intuitive, it’s very easy to think that you’re an expert from day one, and it’s true. Simple things are very simple in graphs. But when you start building complex solutions, it’s important to have a deep understanding of not just the model, but the underlying architecture for things like storage and processing of the graphs.
What is the biggest impact graphs can have in telecoms?
Telco is huge of course, and the entire network structure is a graph. From network management, anything that represents the network infrastructure, whether physical, or logical/virtual, all the elements that are involved in delivering a service represent a graph.
Anything that is related is a graph. It’s a no-brainer. And it’s interesting because telco is one of the industries where we have been stronger from day one. It’s not that we had a campaign focusing on telco, but these industries realized the value of graphs from the very beginning. And it’s an obvious match.
Beyond infrastructure, if you look at more consumer or service focused solutions, whether that’s unified inventory management or service impact analysis, all of these problems are graphs.
And I think that’s the area of the biggest impact. And it’s not just my intuition; it’s the reality. I see that the leaders in that space, all the software companies that are producing Operations Support Systems (OSS), the software that all the telcos in the world use to run their networks, base their systems on graphs. All the leading vendors in that space are not only using graphs but specifically using Neo4j. That’s the area where we are stronger and where I anticipate even more growth.
What does the future hold for graph technology?
With 5G coming up – and the Internet of Things will leverage 5G – there’s a huge trend in the direction of automation of services, anything from provisioning a service to reacting to failure. It’s all about being able to automate the response to any of these things. And that’s perfectly aligned with a solution like Neo4j.
Neo4j not only gives you an accurate and timely representation of your network with all the services and all the elements involved in the delivery of those services, but it’s also a platform where you can build logic that will simplify and accelerate automation. I think that’s the area we will see more growth over the next few years.
What advice do you have for someone getting started with Neo4j?
My advice is to download Neo4j or start a sandbox and play with it. But when you are ready to start serious work, just call us. Get an expert’s advice because as I was saying before, easy things are easy, but when it gets complicated, it’s very important to get some help.
I’m not saying people don’t become experts in Neo4j on their own sometimes, but it’s always good to get the advice of experts and learn best practices. I’m sure whatever problem you’re trying to solve, we’ve done it before with some customer or some other user, and that’s something we’d love to share. We produce a lot of content; we love sharing what we learn and what we do.
But yes, reach out to us. That is my advice. Try it, of course. Get your hands dirty, but when you want to start your first serious project, reach out to us.
Want to share about your Neo4j project in a future 5-Minute Interview? Drop us a line at content@neo4j.com


