From Zero to the Connected Enterprise in 45 Minutes

CEO, CluedIn
16 min read

Editor’s Note: This presentation was given by Tim Ward at GraphConnect New York City in September 2018.
Presentation Summary
Tim Ward is the founder of CluedIn, helping companies bring together data scattered across the organization, become much more data-driven – and ultimately become connected enterprises.
In this presentation, he will explain why an enterprise needs to be connected and then breaks down three steps your enterprise must go through to achieve that.
The first step is integrating your data. Whether it’s in real time or not, data integration requires enterprise-level authentication that changes fast but not too fast.
The second step, the most important one, is cleaning and preparing your data. In this step, you need to categorize your data, merge the unnecessary duplicates, correct your data manually to reinforce automated cleaning and use graph visualization to make that process efficient.
The last step is making the data accessible to the business. He will demonstrate how to talk to your data stored in different databases in a universal query language and show you what it really means to be a connected enterprise.
Full Presentation: From Zero to the Connected Enterprise in 45 Minutes
My name’s Tim Ward. I’m an engineer based in Copenhagen, Denmark. My goal in this presentation is to answer four main questions:
- What do you need to do to become a connected enterprise?
- How do you do it?
- What does it look like when you are a connected enterprise?
- And, is it worth all the fuss?
Why Your Enterprise Needs to Be Connected
Let’s start with the problem. Essentially, this is what your business looks like:

Data is scattered across different systems of various qualities. In fact, some systems are just fundamentally broken.
And if you take a look at the data landscape today, and all the components that an enterprise needs to become connected and data-driven, it’s pretty overwhelming:

Components necessary to become a connected enterprise.
Businesses don’t care what cloud provider they’re using. They don’t care if a query will scale or not. But they do care if they can get access to the data that sits across the business and, when they access it, if it’s ready to be deployed for use cases.
Business intelligence, machine learning and all the solutions at the top of the diagram (image above) require access to good quality data.
I’m going to give you the recipe that your enterprise needs to become connected. The bottom line is there’s one ingredient that you can’t leave out: graph database technology.
The First Hurdle: Data Integration
Data integration is easy, right? Any junior developer could probably connect to a system and start pulling data from them within a day. But there is a fundamental difference between that kind of integration and an integration that meets the demands of an enterprise. You need to think enterprise.
Enterprise-Level Authentication
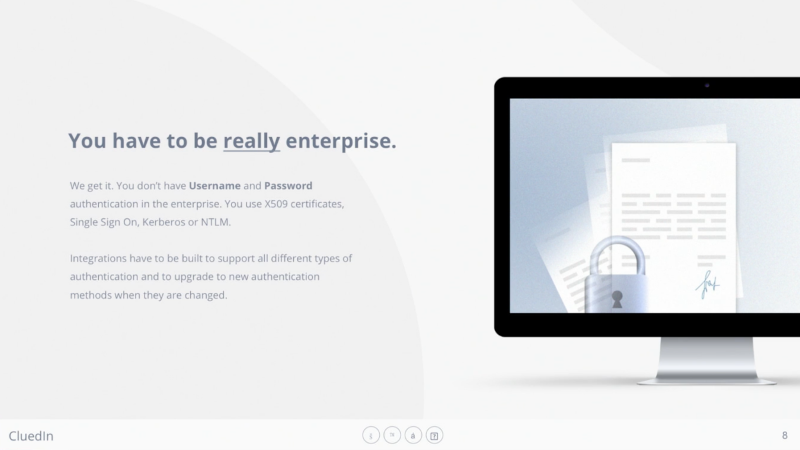
Enterprises don’t authenticate with usernames and passwords; they use NTLM, SCIM, Kerberos. Enterprises grow. They adopt new products. If you want to build a connected enterprise, real-time data is a key piece. If your data integration can’t adapt to new types of authentication methods, the system breaks down.
Adding two accounts may be fine, but adding 100,000 accounts is something completely different. When you’re working with these types of ETL models and pulling in data from dispersed systems, you need to be thinking about working with service accounts, not individual accounts. You need to be thinking about iterating accounts, discovery of new accounts and what happens if your integration fails halfway through.
Fast but Not Too Fast
An enterprise changes all of the time. People leave. New people come in. Data integration needs to be able to support this type of model to stand a chance in the enterprise.
Things need to be fast, but not too fast. The problem is that, if things aren’t too fast with data integration, it will be a year before you even start to see your connected enterprise. Some of our customers have hundreds of thousands of exchange accounts, hundreds of SharePoint sites and terabytes of data. Just for the sheer amount of data, we need a system that has parallelization and distributed processing in mind.
But if you look at most platforms today, specifically SaaS platforms, they all have API throttling built into it. So you need to make sure that you’re adhering to these levels and not going overboard with communicating with different systems.
The same thing happens in an on-premise environment. The network is typically the bottleneck. Businesses still have to run. If you want to connect data from different systems, you need to do it in a live manner. You need to be pulling data from production systems; they need to continue to be up. So there needs to be a fine balance between fast, but not too fast.
Not to mention, in the SaaS world, you’re using something like Salesforce. If you’re pulling data from them too fast, they will just ban your application. Try telling that to your customers: “The reason your data’s not coming in is because we were pummeling it too fast. That’s why your Salesforce data is not hooked into your overall connected enterprise story.”
Real Time or Not?
Another question that comes up with data integration is whether you should leverage it in real time – or not.
Most systems these days give us real-time support – with things like streaming, webhooks and push notifications. And for an on-premise software, maybe not as modern, you can hijack a lot of techniques that exist within those infrastructure systems already. You can use triggers in databases as mechanisms that react to change and push it to the other parts of an enterprise.
Not to mention that scheduled downtimes are just a common thing that happens in an enterprise. Resilience needs to be built into your data integration pipelines that considers there might not always be new data available and you might need to fit it into some type of model.
These are the types of things that come up when you’re actually trying to build a connected enterprise, things that you don’t easily see when you’re building a small proof-of-concept integration of pulling data from one system into another.
The Second (and Biggest) Hurdle: Cleaning and Prepping Data
The second and the biggest hurdle is also something that’s often skipped. There’s no use serving bad quality data to your business. Data preparation and cleaning is a big step that you need to look into.
There are 15 types of database families today. Each of them are designed to solve specific data problems. But most companies are still trying to solve their data problem with one or two, most often: the relational or a columnar database, a data warehouse approach. Data warehouses are great but they don’t connect your enterprise.
Too often, databases are bent to do something that it shouldn’t. At CluedIn, we use five different types of database families to solve your enterprise problems. This polyglot approach utilizes the strengths of different database technologies, fitting the same data into different formats. This becomes handy later on when there’s the need to utilize those data for our business.
There is an automatic part of cleaning data, and there is a manual part. Different modern database technologies makes it possible to automate those processes in the data cleansing environment today.
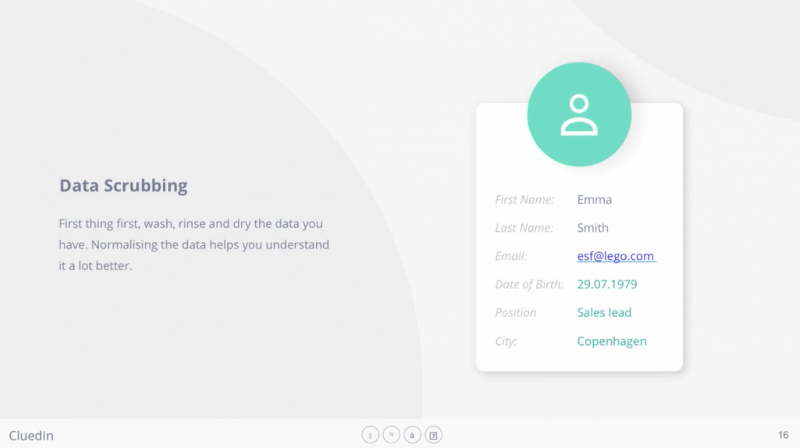
The first thing you need to look at is the classic normalization of data: normalizing dates into a standard ISO format or culture, and normalizing locations into a standard representation of that location. These are pretty common in the data world, but a lot of them can be automated. This is not where codes or those classical ETL cleaning tools necessarily need to come in yet.

One of the next critical pieces to make this work is you need to start scoring your data. At CluedIn, we use six different metrics to score the data: completeness, relevance, validity, staleness, quality and accuracy. These may all sound quite synonymous, but in the data world they’re very different.
As you send this data through the pipeline, you’re going to be moving these scores up and down, depending on the output of different functions. Your end goal is to determine if what you have done in the automatic cleaning part is statistically confident.
Categorize Your Data
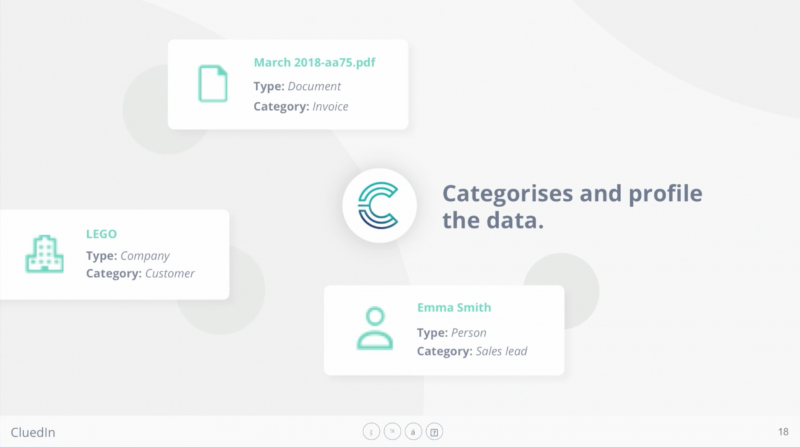
Next comes the stage within the processing pipeline where you want to categorize your data, because you need this data to be strongly-typed for the next stages. Categorizing your data can be something as simple as changing a document into what looks like an invoice or a contract, classifying users as a sales lead or a customer.
Merge the Duplicates
Then you want to start merging data in the graph based on unique references.
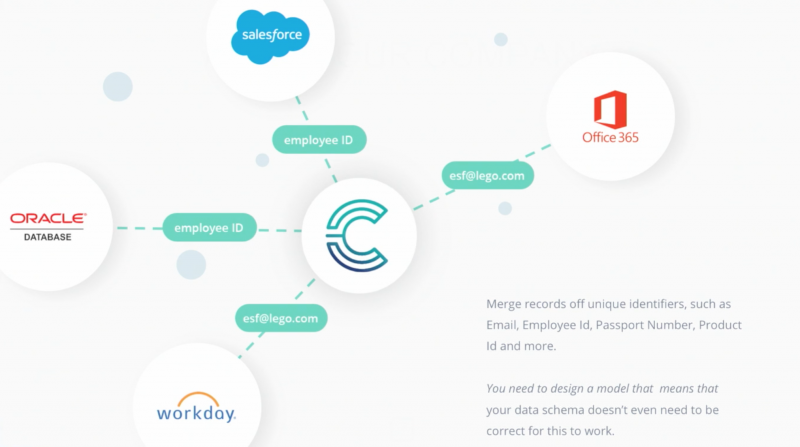
One way you can do this effectively is to work with a data model that doesn’t trust the data source. If you’re shoving the data you want to merge into a relational database, you would have to consider the database schema where you’re pulling this data from. Can it stand the test of time?
What you need to figure out from your data that’s coming in through your integration pipeline is: What is unique? Not: How does it reference to other things within that data source.

When you have two databases where you have a column called “contact” in the first database and one called “email” in the second database (see above image), you look at it and you know they’re the same things. But the referential integrity doesn’t tell you that there’s a connection there.
At this point, you need to use the approach that’s able to highlight a unique reference to an individual. Because this classic ETL process can be flipped into an ELT process where you want to have a full view of all the data before you start looking into finding how these things are related to each other.
One of the optional steps is to utilize external data sources to help you, especially if you work in the data privacy and compliance space. If you want to, say, build a data privacy product, typically the less data you have the better, and the less liable you are. But this process helps you use not only paid services but a lot of online services that have free datasets.
SEC, for example, has a lot of business data on who were the founders, who registered the business, etc. There’s also OpenCorporates, which is an open dataset of companies and business people. You can start to look at these external sources, not only to enrich your data but also to help you triangulate data.
Now, this is the part of the pipeline where data cleaning and preparation really comes in. If you want to use the data that you have across the business, you need to get into the fuzzy merging.
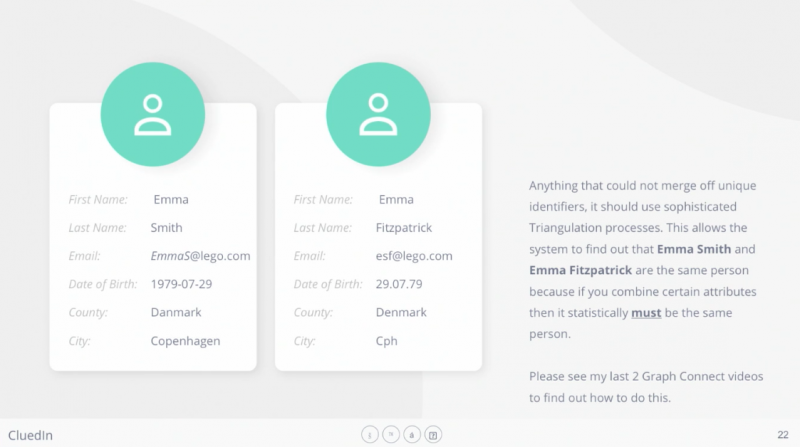
You can probably look at the records (in the image above) and think, “It’s probably the same person.” But it’s much harder for a machine to do that.
So how do you merge these kinds of duplicated records, where there’s no obvious unique overlap or easy way for a machine to tell they’re the same records?
At this point, you need to make sure that you’re also tracking the lineage of every single change that you make. Because, in the nature of data, I can guarantee you, after running in production for five years on enterprise customers, you will always need to revert some data. There are always data decisions, which, in three years, is no longer going to be relevant or correct.
For engineers, the easiest way to think about a proper object model for this is to think about Git, the source control system. Git works off a versioned object graph. It’s essentially a big network, or tree, or graph, of all the different changes of data over time. Using this versioned object graph, it allows you to look at your data history and revert your data, and replay things, or remove components that were necessarily wrong.
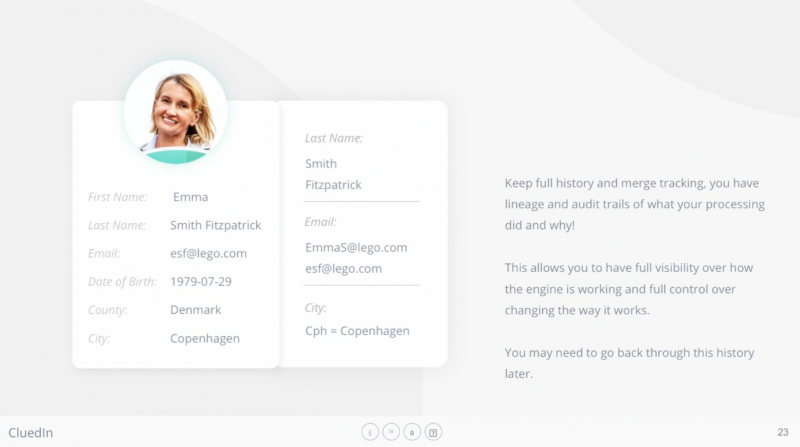
Now, it’s important to track: What has been automatically cleaned? Did “CPH” change into “Copenhagen”? Did the date of birth in the U.S. format turn into the universal format?
As you move along, every choice that you’re making is deciding the scores of accuracy, quality and completeness. If you’re able to improve the quality of something, like a phone number by automatically integrating the country calling code based on where you live, that results in a better representation of data. If you have a CRM record and it’s missing an address and a phone number, it’s an incomplete record.
Graphs Reveal Context
This is the point where most companies have gotten to. They take a metadata approach to cleaning data.
If you take a look at this metadata example, it’s hard even for a person to figure out if they’re the same person – much harder for a computer. But if you start looking at the data around these records, it starts to reveal the context that makes this much easier.
It’s also worth mentioning that this isn’t about solving the problem in one way. This is about using all of the different techniques to build up a statistical confidence over what you’re automating.
If you take a look at the data that’s connected directly or indirectly to these nodes, it becomes much more clear to figure out that maybe “Emma Smith” has something to do with “Emma Fitzpatrick.”
Not to mention that one of the most powerful features that graphs give us is shortest path queries.

Imagine Emma at a completely different, dispersed part of your graph. What you can do is not only query the shortest path algorithms but also, as you traverse through these paths, you want to see: What’s the overlap of records? How many records are overlapping in the paths between these two nodes? Maybe the same company. Maybe the same projects. These are all, once again, more clues for you to determine whether these records should be merged and deduplicated.

And then unstructured data comes in. How are you going to use this unstructured email body to figure out who “Emma Smith” is?
You’re probably taking a natural language processing (NLP) technique, say something like a named-entity recognition to first detect if that’s a person. But if you use most of the libraries that are available online, you’ll know that the models don’t really work very well; so you might want to build these models yourself.
Next, you might do a dependency parsing to basically break up the sentences into subjects, objects, nouns, pronouns, verbs, adjectives, etc. This will help you map the relationships between your data points within the context of this document.
But when you start to step outside the document, there is such better precision that you can get around “Emma Smith.” She might be directly connected to that document via some other reference, not necessarily something you would get in metadata like author of or created by, or last modified by.
Graphs can be utilized to solve this problem of references to individuals, companies and tasks within unstructured content.
But there is no magic to this. There is only so much that you can automatically clean and prepare in your data. At CluedIn, we give two different tools: one for data engineers and one for business users.

If you’ve used tools like Talend, or Pentaho or Google Dataprep, that’s basically what our data engineering tool does as well. We provide a platform where we break out the data that’s dirty and incomplete, we get those data into a tabular view and we give it to engineers. There is a way to let business users curate and steward the data as well.
The interesting part is, if you have mapped your enterprise into a graph and you need to answer a question around a particular node, you know who are the most connected people to that node. They are the people we should be asking the questions to in order to fix this data.
Manual Cleaning Reinforces Automation
Think of CluedIn, Talend, Pentaho, as a kind of classic system that has classic Excel pivoting functions to cluster data, to solve problems like, “What if gender is male, female, M, F, zero, one, unknown, depending where it comes from the different systems?” Because these are sometimes challenging to solve in an automated way.
There is this trend in the data culture: It’s the idea that business people who are close to a particular set of data should help in curating that data, they should play some role in adding context for what essentially may have been entered incorrectly.
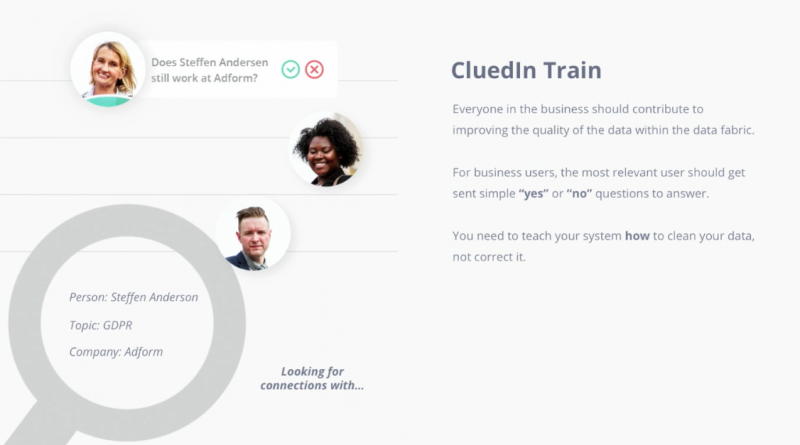
So what you can use is a technique called reinforcement learning. It’s not about asking business users whether they should correct the data. It’s about asking them, “Did we do something right or wrong?”
Without you knowing, you’re actually manually helping the automation in this processing and cleaning pipeline get better over time. Because you’re telling it a mechanism, “You did something wrong. So whenever you try to fix the same type of things in the same way in the future, you might do it wrong.”

Think of reinforcement learning as bringing up a child. If you’re teaching a child, “Don’t touch that knife,” it doesn’t mean that he won’t touch it the next time. But if you drill that into him multiple different times, over time, he will be able to build up that statistical answer of, in this particular case of touching a knife, I should not do it. It doesn’t stop him from doing it, but statistically, it lowers the chance of him trying to touch that knife in the future.
It’s the exact same technique but for data. For example, if you detected that “Spicy Chicken” is a person, you don’t need to type, “No, it’s actually Stephen Chicken.” All you need to do in this technique is say, “No, you did that wrong.”
It’s about building up statistical models, and that’s where machine learning and automation becomes extremely useful.
Correct Your Data with Graph Visualization
Exposing the data to your users for reinforcement learning is another pivotal step. Some data needs to be shown in a network. It cannot be consumed as easily for business users in a tabular or document view. That’s where graphs come in handy as well.
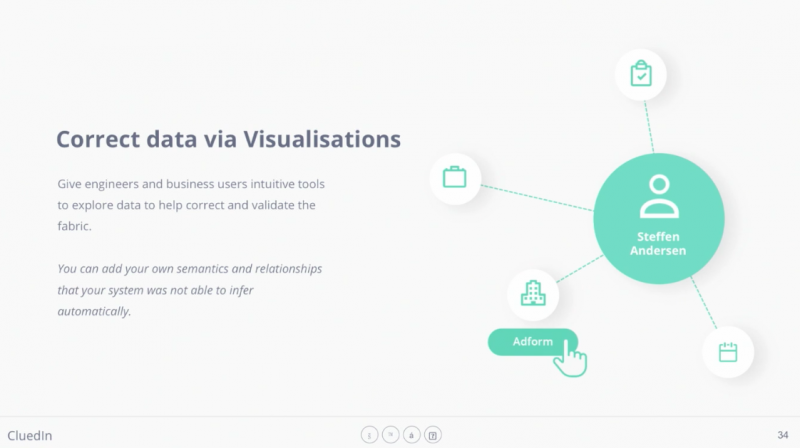
Correcting your data is not about solving everything upfront. This is why most companies don’t start from trying to solve it – it’s too overwhelming.
But as long as you take this approach with mechanisms to improve it over time, it works. This is what allows companies to become a connected enterprise.
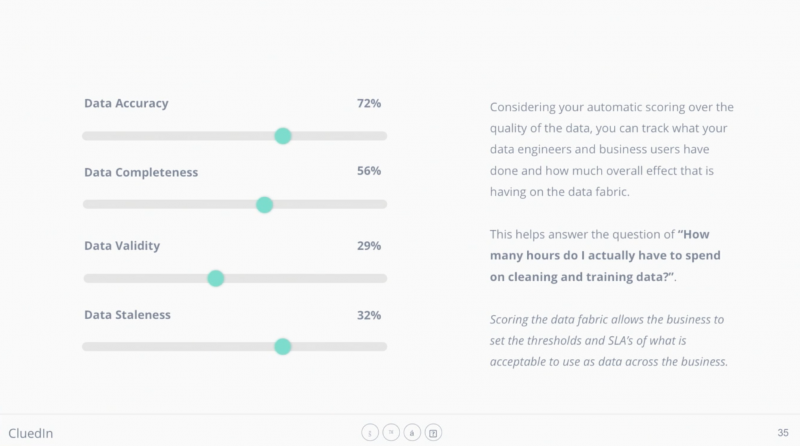
Throughout the whole pipeline, we’ve been moving these values – quality, accuracy, completeness – up and down. And at this point, it’s a business decision. It’s up to the business to set the level of what’s acceptable of data to the business. If the business sets the levels too high, 90% quality, 90% accuracy, do you know what that’s gonna do? It’s gonna generate more data to clean and to train.
The Third Hurdle: Making Data Accessible to the Business
Now you’ve integrated data. When it comes to scheduling, you’ve got fast but not too fast. You’re authenticating with enterprise-level security but also adaptable to changes over time as the enterprise grows.
You have an automation system that can cleans a certain amount of data but not all. Graphs make it possible for you to ask new questions to your data in the cleaning process that you can’t ask a relational database or a document store.
And now, you want to actually use the data.
Talk to Your Data in a Universal Language
There is one query language that makes complete sense in this context: GraphQL. This language has nothing to do with graph databases at all. It’s an inaptly named query language for an object graph – essentially an abstract syntax tree.
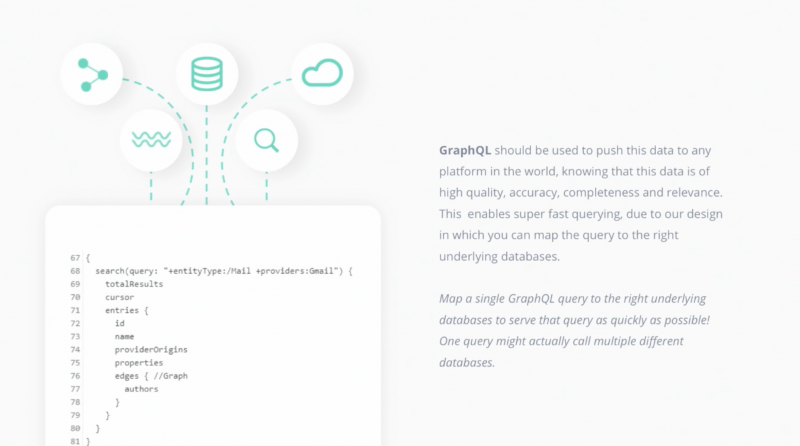
The interesting part is that, if you follow this recipe and store your data in five different databases with CluedIn, different parts of your GraphQL queries can be run by different databases.
For example, Elasticsearch built on Apache Lucene handles languages and problems around what’s called per-field analyzers. It’s a very purpose-built search indexing engine, but it’s not good at serving connections and graphs.
The ability to run a query on different databases makes it not only extremely flexible but also scalable. You can ask the right database to run the right queries that it was designed for.
What this means is that now you have a universal query language to talk to any data source, no matter if it’s a relational database, or a SaaS product, or a Neo4j database – in a consistent query language with a consistent model.
Even if there were records in a CRM and more records in another CRM, it’s pre-joined at this point, so the querying speed is fast. Using streaming technologies, you can even use GraphQL to subscribe to querying of data. When that data comes in from your system and matches the GraphQL query, you can stream it off different services like BI tools or advanced analytics providers.
Conclusion: What It Means to Be a Connected Enterprise
Too often, companies invest in amazing business intelligence tools and connect them directly to the source data. And all of the disorderly, the duplication of data, is often obfuscated because the charts look beautiful.
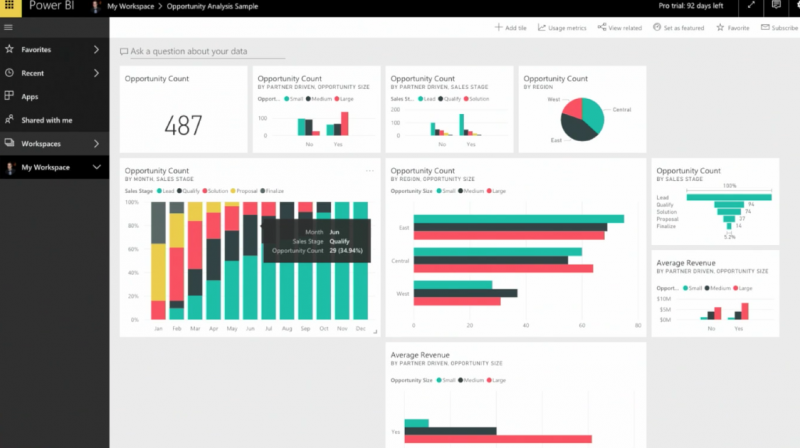
But a connected enterprise is something that has gone to the cleanliness process, in a uniform model, much more ready to use with tools like Power BI, Tableau, Qlik, etc. Not to mention one of the most requested things in business is a unified view of the customer. Graphs are fantastic for that.
You also have governance, the ability to govern data in a universal way across your entire stack, to detect things like PII data, to detect categorization and distribution of data, to detect where there may be breaches of regulations.

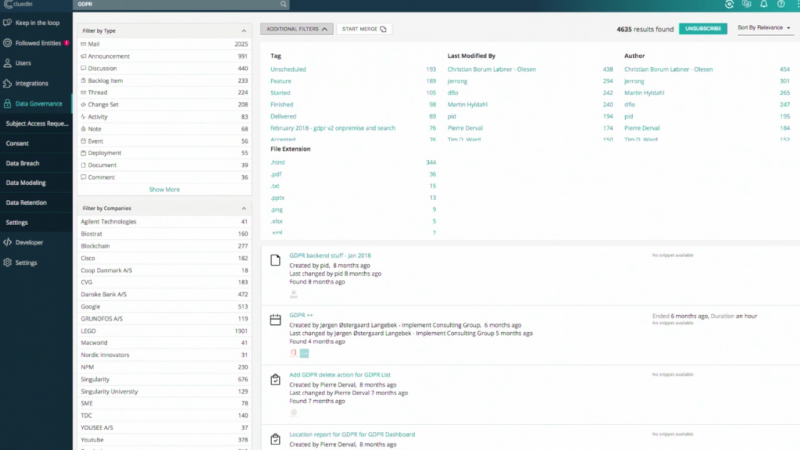
Enterprise search allows you to pivot and search through all your data points across the business from one single place.
And finally, machine learning is nothing without good quality data. Most data scientists spend anywhere from 60 to 80 percent of their time just cleaning and preparing data.

Data comes in, data goes through the cleansing process, potentially the enrichment process, and you have a consistent way to talk to your data. Your business data is now more ready than ever for any of the use cases you need.


