Creating Beauty With Cypher reduce()

Director of Engineering, Neo4j
9 min read
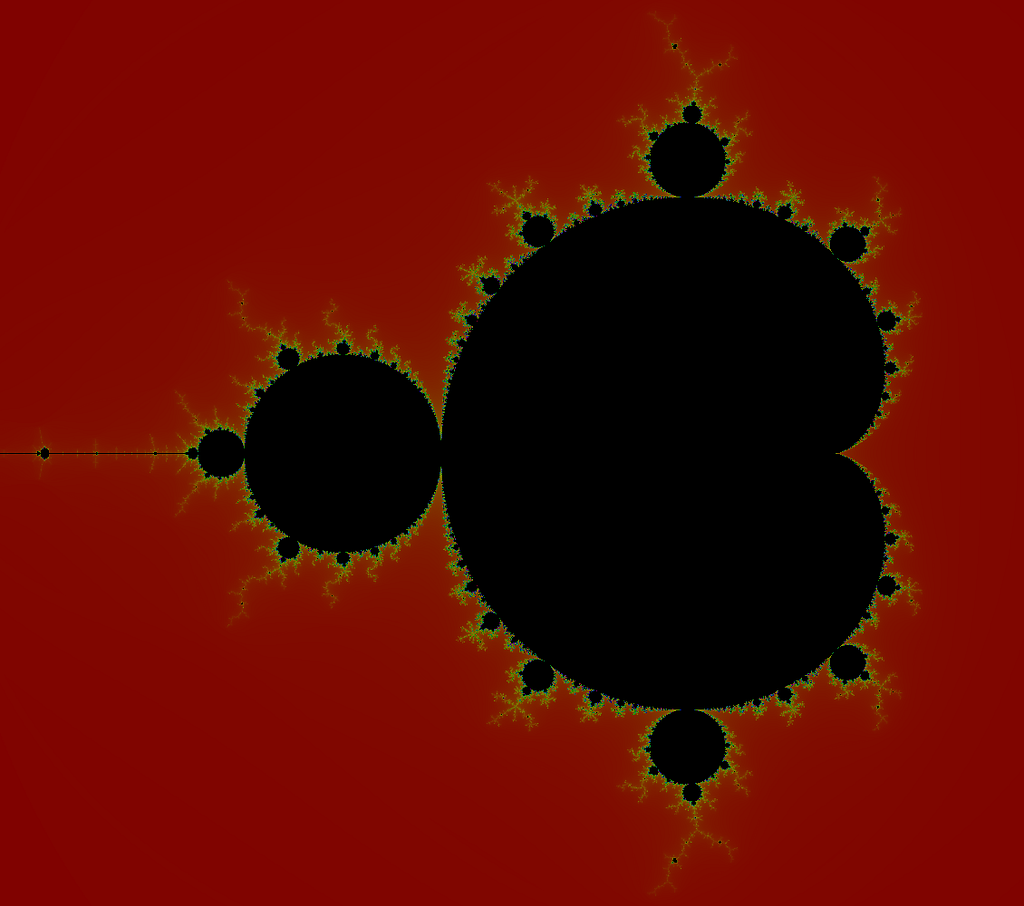
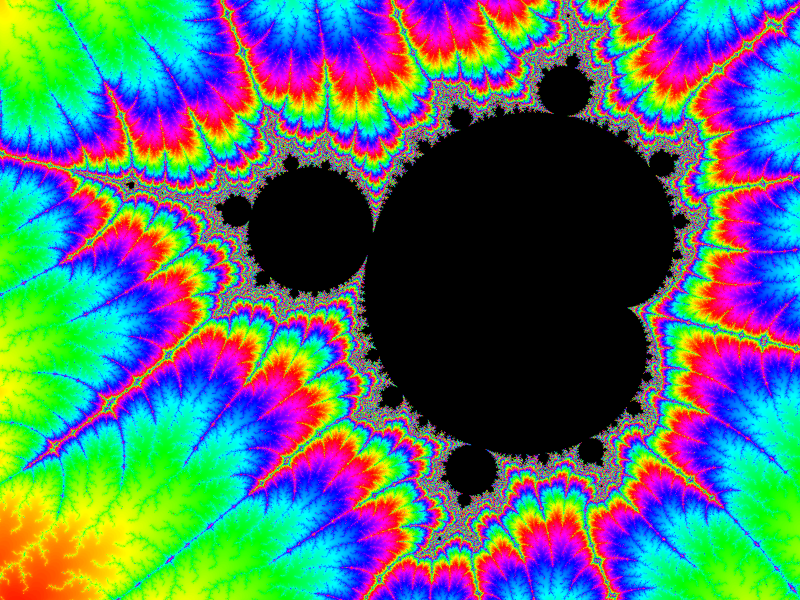
I have always been fascinated by the Mandelbrot fractal for both its beauty and its hidden mysteries. How can such a simple algorithm — such a simple equation — create an intriguing pattern of such elegance?
As with any fractal, you can zoom in and find it repeating itself indefinitely in intricate patterns, which is hard to find a logical explanation of, at least for a non-mathematician like myself.
The equation that is the base of this is as simple as they get:
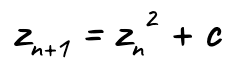
c is a point on the image (in a coordinate system where origin (0,0) is the center of the image) and z in the first iteration — i.e., z(0) — is 0. What the algorithm does is repeat this formula to see if z remains within a distance of 2.0 from the origin forever or if it “escapes” the gravity of the formula. If it remains within 2.0 from origin forever (or as many iterations as we want to test with), we set the pixel to black and otherwise set it to a color depending on how quickly it escaped (how many iterations it took).
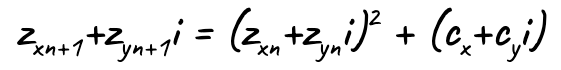
The caveat of it all is that z and c aren’t real numbers — they’re complex numbers. Complex numbers are two-dimensional numbers with a real part and an imaginary part. The imaginary number is i, and the attribute that makes i special is that i squared is -1 (i*i = -1). Wait, what? Any number times itself would be positive! It cannot be negative! Well, i can. This can be hard to grasp because it’s impossible, but for now let’s just accept it as a fact. This means that any complex number can be expressed as a+bi, where a is the real part and bi the imaginary part. And since our Mandelbrot fractal is a 2-D image, let’s consider x to be the real part and y the imaginary part. If we rewrite the equation above like that, we get:
When we resolve this equation, something interesting happens because of this attribute of i. Take just the squaring of z and rewrite it as a multiplication of itself:
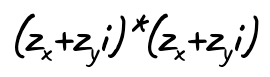
If we resolve this multiplication, we get:
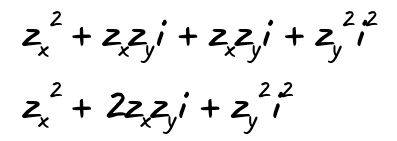
So far nothing other than standard arithmetics. But here comes the interesting part. We see that we have i squared at the end. And we know that i squared is -1. This means that this suddenly changes from the imaginary part to the real part, but with its sign reversed.
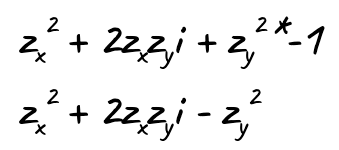
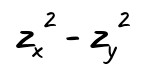
Which in turn means that the new real part is:
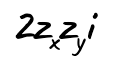
And the new imaginary part is:
Finally, the Mandelbrot equation also added c (the original point in the image) in each iteration, and with that we get:
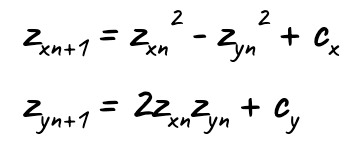
So these are the two equations we repeat and see if the distance between zx,zy and origin ever becomes greater than 2.0. We set the pixel color based on the number of iterations it took, and we set it to black if it remained within 2.0 for as many iterations as we decided to test with. The number of iterations defines the resolution of the fractal, and the more we zoom in, the higher number we need to use to see the details.
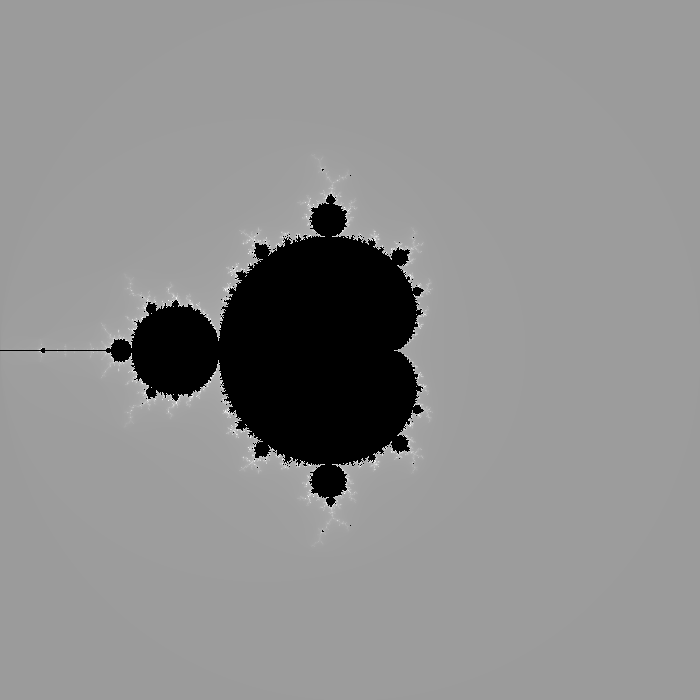
Doing this in Java is simple. All the code we need to do a grayscale Mandelbrot is this:
public static void generateMandelbrot(BufferedImage target) {
 final int maxIterations = 100;

 for (int y = 0; y < target.getHeight(); y++) {
  for (int x = 0; x < target.getWidth(); x++) {
   // Convert to a coordinate system with origin in the center
   double cx = x*4.0/target.getWidth() - 2.0;
   double cy = y*-4.0/target.getWidth() + 2.0;
   double zx = 0;
   double zy = 0;

   // Run iterations until the point has "escaped"
   int i;
   for (i = 0; i < maxIterations; i++) {
    // The Mandelbrot formula
    double xtemp = zx*zx - zy*zy + cx;
    zy = 2.0 * zx * zy + cy;
    zx = xtemp;
    // Pythagorean theorem to calculate distance to origin,
    // but instead of comparing the square root with 2.0, we
    // compare with the square of 2.0 (i.e. 4.0)
    if ((zx*zx+zy*zy) > 4.0) {
     break;
    }
   }

   // Set the color based on the number of iterations we completed
   if (i == maxIterations) {
    target.setRGB(x, y, Color.black.getRGB());
   } else {
    target.setRGB(x, y, new Color(155+i, 155+i, 155+i).getRGB());
   }
  }
 }
}
This gives you a grayscale Mandelbrot fractal. To get the more colorful variant at the start of the blog, we just need some more elaborate converting of iterations to color at the end of the routine above.
It was simple with Java, but the title mentioned Cypher. Cypher is a query language for graph databases, so why would anyone in their right mind want to generate Mandelbrot fractals with that? No one in their right mind would, but I would. 🙂
The purpose — if there is one (does there have to be?) — would be to test implementing an iterative algorithm in a declarative, non-turing complete language like Cypher. As I showed (or actually, my colleague Satia showed) in my blog Tic Tac Toe Challenge in Cypher, you can even do a recursive algorithm in Cypher. We won’t have to go that far here, but unlike that one, we’ll do our query without actually touching the database itself.
We want to do this as a query we can run directly in a tool like Query/Browser or Cypher Shell, so we don’t have the possibility of generating a bitmap or any fancy colors. So instead, we’ll do an ASCII art Mandelbrot.
UNWIND range(0, 31) AS y
UNWIND range(0, 63) AS x
WITH collect({x:x, y:y}) AS grid
WITH reduce( agg=[], v IN grid | agg + [{x:v.x, y:v.y,
    z: CASE reduce( mem=[0.0, 0.0, (v.x-48.0)/32.0, (v.y-16.0)/-12.0, 0], iter IN range(1,100) |
    [
        mem[0]^2 - mem[1]^2 + mem[2],
        2.0 * mem[0] * mem[1] + mem[3],
        mem[2],
        mem[3],
        mem[4] + CASE mem[0]^2 + mem[1]^2 <= 4.0 WHEN true THEN 1 ELSE 0 END
    ])[4] WHEN 100 THEN " " WHEN >5 THEN "*" WHEN >2 THEN "-" ELSE "." END
}]) AS xyz
RETURN reduce(res = "", point IN xyz | res + CASE point.x=63 WHEN true THEN point.z + "n" ELSE point.z END ) AS result
You’ll be able to see something that resembles the Mandelbrot already in the browser output, but it will be a bit distorted since it doesn’t use a mono-sized font. But if you copy the result over to your favorite text editor, you’ll see it more clearly.
................................................................
.................-------------------------------................
..........---------------------------------------------.........
.....-----------------------------------*****---------------....
.---------------------------------------******** *--------------
---------------------------------------***********--------------
-----------------------------------********   ******------------
------------------------------***********       ********--------
--------------------------***** ***********   ****************--
------------------------*******  **                   *********-
---------------------***********                           ****-
------**********************                               *****
-----**********************                                  ***
----*******  *    ********                                   ***
-*********             **                                    ***
*********               *                                   ***-
                                                         ******-
*********               *                                   ***-
-*********             **                                    ***
----*******  *    ********                                   ***
-----**********************                                  ***
------**********************                               *****
---------------------***********                           ****-
------------------------*******  **                   *********-
--------------------------***** ***********   ****************--
------------------------------***********       ********--------
-----------------------------------********   ******------------
---------------------------------------***********--------------
.---------------------------------------******** *--------------
.....-----------------------------------*****---------------....
..........---------------------------------------------.........
.................-------------------------------................
As we see, it makes heavy use of the Cypher function reduce(). This is one of those methods that is a bit complex to comprehend, but once you do, it’s extremely powerful. It iterates over a list, performing an operation on each element, using an accumulator to update the state on each iteration and then returns that accumulator.
So we go through our Cypher query one part at a time and drill down into each of those reduce() uses. We start by creating a list of objects holding an x and y coordinate for each “pixel” of our fractal (we call this list grid). Our resolution is 64*32 (we use this aspect ratio because most fonts are twice as high as they are wide, so it produces a somewhat square result like we see above).
UNWIND range(0, 31) AS y
UNWIND range(0, 63) AS x
WITH collect({x:x, y:y}) AS grid
Now we have our first reduce that produces a new list of objects returned as xyz (temporarily called agg as the aggregator in the reduce). Removing the inner part it looks like this:
WITH reduce( agg=[], v IN grid | agg + [{x:v.x, y:v.y, z: ...}]) AS xyz
We iterate over each element in the list grid, producing the new list of objects that also has x and y, but also a z, which is set to the ASCII character for that “pixel.”
The inner reduce() that builds up z (shown as ‘…’ above) looks like this:
CASE reduce( mem=[0.0, 0.0, (v.x-48.0)/32.0, (v.y-16.0)/-12.0, 0], iter IN range(1,100) |
[
    mem[0]^2 - mem[1]^2 + mem[2],
    2.0 * mem[0] * mem[1] + mem[3],
    mem[2],
    mem[3],
    mem[4] + CASE mem[0]^2 + mem[1]^2 <= 4.0 WHEN true THEN 1 ELSE 0 END
])[4] WHEN 100 THEN " " WHEN >5 THEN "*" WHEN >2 THEN "-" ELSE "." END
This list iterates 100 times (unlike the Java version, we can’t break when the goal is reached, meaning the point has “escaped”). This is done with the iter IN range(1,100) part. As aggregator, it has a list, called mem, of five elements used to hold the variables we need during the Mandelbrot calculation. These five elements are zx (mem[0]), zy (mem[1]), cx (mem[2]), cy (mem[3]), and the number of iterations before it escaped (mem[4]).
zx and zy are initiated to 0, while cx and cy is set like this:
cx = (v.x-48.0)/32.0
cy = (v.y-16.0)/-12.0, 0]
This is again to move origin toward center and to scale into the appropriate range for Mandelbrot. However, we offset the origin a bit, and we don’t scale uniformly on x and y. The reason is that we want to capture the interesting part of the Mandelbrot, which is between -1.5,1.33 and 0.5,-1.33, and to scale so that it fits with the font shape, which was mentioned above.
In each iteration, we simply update mem[0] and mem[1] (zx and zy) with the Mandelbrot equation. Note that we don’t need the xtemp variable we needed in the Java version to prevent zx from changing before zy was calculated. It’s not needed here since Cypher won’t update anything before all parts are calculated.
mem[2] and mem[3] (cx and cy) are kept the same in the iterations (c is not changed when iterating, just z).
mem[4] is increased by 1 if the Pythagorean theorem shows that we’re within 2.0 from origin, otherwise by 0. So at the end, this will be set to the number of iterations (because if a point has ever been further away that 2.0 it will never come back within range again).
This entire reduce() is wrapped inside a CASE on just the last element, mem[4]:
CASE reduce(...)[4]
WHEN 100 THEN " "
WHEN >5  THEN "*"
WHEN >2  THEN "-"
ELSE          "."
END
This returns the ASCII character based on how many iterations we achieved.
After these nestled reduces, another reduce is used to create the output as a single string, based on the xyz output from the outer reduce:
RETURN reduce(res = "",
    point IN xyz |
    res +
    CASE point.x=63
      WHEN true THEN point.z + "n"
      ELSE point.z
    END ) AS result
It iterates over this xyz list, and for each element adding its ASCII character (i.e., z) to the result string, unless it’s the last point of each row (i.e., x = 63), in which case it adds z and a newline.
This is now our final Mandelbrot ASCII output.
I’d like to thank Håkan Löfqvist and Georgiy Kargapolov for helping me construct the query.
Summary and Questions to Ponder
Now that we have completed the technical part — we have the algorithm completed and dissected, and we know every aspect of the reduce() function — let’s go back and marvel at the beauty and mystery of the Mandelbrot fractal. You can see a version where you can zoom in and look at all the details. Remember that once you’ve zoomed in a bit, you have to increase max iterations in the control panel to the left to see all the details.
Why does it work like this? What is it about this simple equation that gives us this beetle-like shape (which is what I’ve always thought it looks like)? Why does it repeat itself in this pattern? And what is it about those repeated circles that make points there unable to escape?
A lot of questions and few answers. Well, at least we have seen the power of the reduce() function in Cypher, and we learned how to wield that power. You can read more about it in the Cypher docs.
Creating beauty with Cypher reduce() was originally published in Neo4j Developer Blog on Medium, where people are continuing the conversation by highlighting and responding to this story.
Share Article


Explore
Related Articles

SumoDB in Neo4j: Chaining Multiple Graph Algorithms in Snowflake — Part 3