What’s invisible in your supply chain could cost you


7 min read
No matter your role in supply chain management, the pressures are all too familiar: new regulations that create technical debt for your organization, disruptions to raw material sourcing, and customer segments with rapidly changing demands, to name a few.
The real cost of these pressures becomes apparent when you cannot respond to delays and optimize your network efficiently. By the time a rule-based system triggers alerts, the damage is already unfolding. Rush freight, spoiled inventory due to delays, tariffs on surgical supplies, or compliance penalties quickly add up. Some estimates suggest companies lose an average of $82 million a year reacting to disruptions that, in many cases, could have been prevented.
Yet nearly half of companies still can’t see beyond their tier-one suppliers. Most supply chain management occurs within data systems that are siloed, providing only a narrow, rules-based view of what’s happening. As a result, teams are forced to spend hours sifting through noisy alerts. Without a big-picture view, the greatest risks in your supply chain can go undetected, keeping your company in reaction mode.
Legacy data systems miss what matters
A shipment delay in Hamburg shifts a production run in Texas. A new regulation in Seoul triggers changes to a supplier contract in Chicago. A raw material shortage in Bangalore stalls a product launch in London. Every aspect of your supply chain is connected, yet most supply chain systems treat these events as unrelated. But why don’t you see those highly connected operations reflected in your systems?
Traditional supply chain software uses threshold-based (or rule-based) alerts that surface symptoms, but not causes. Behind those alerts are ERP systems running on traditional relational databases that store data in separate tables linked by slow, JOIN-heavy queries. As global supply chains expand into multi-tier ecosystems spanning regions and partners, these data systems simply cannot scale to manage the disruptions that flow across them.
See your supply chain the way it actually operates
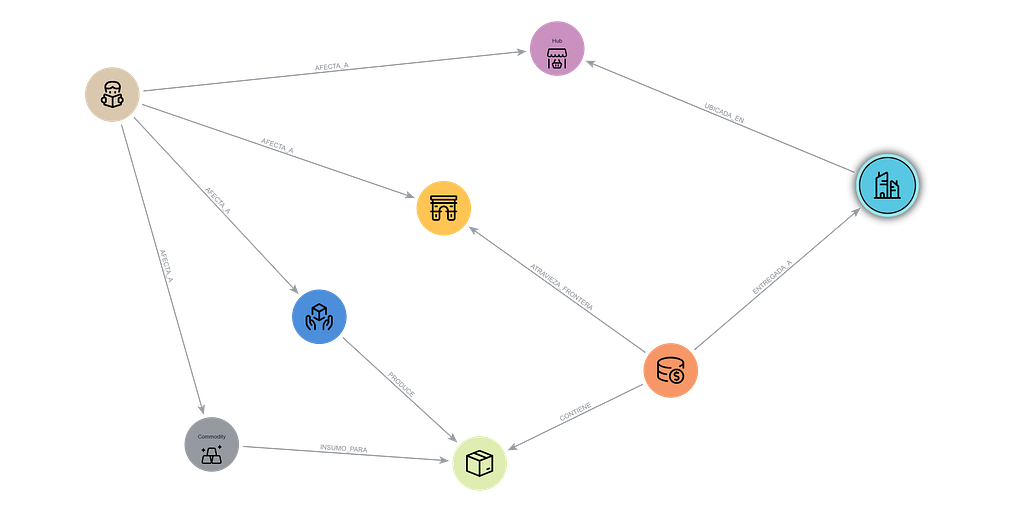
Real-time visibility becomes possible when your systems provide an accurate representation of how your supply chain operates. A graph database, unlike the relational databases that underpin most supply chain software, stores connections between suppliers, shipments, materials, and routes—just as they exist in the real world:
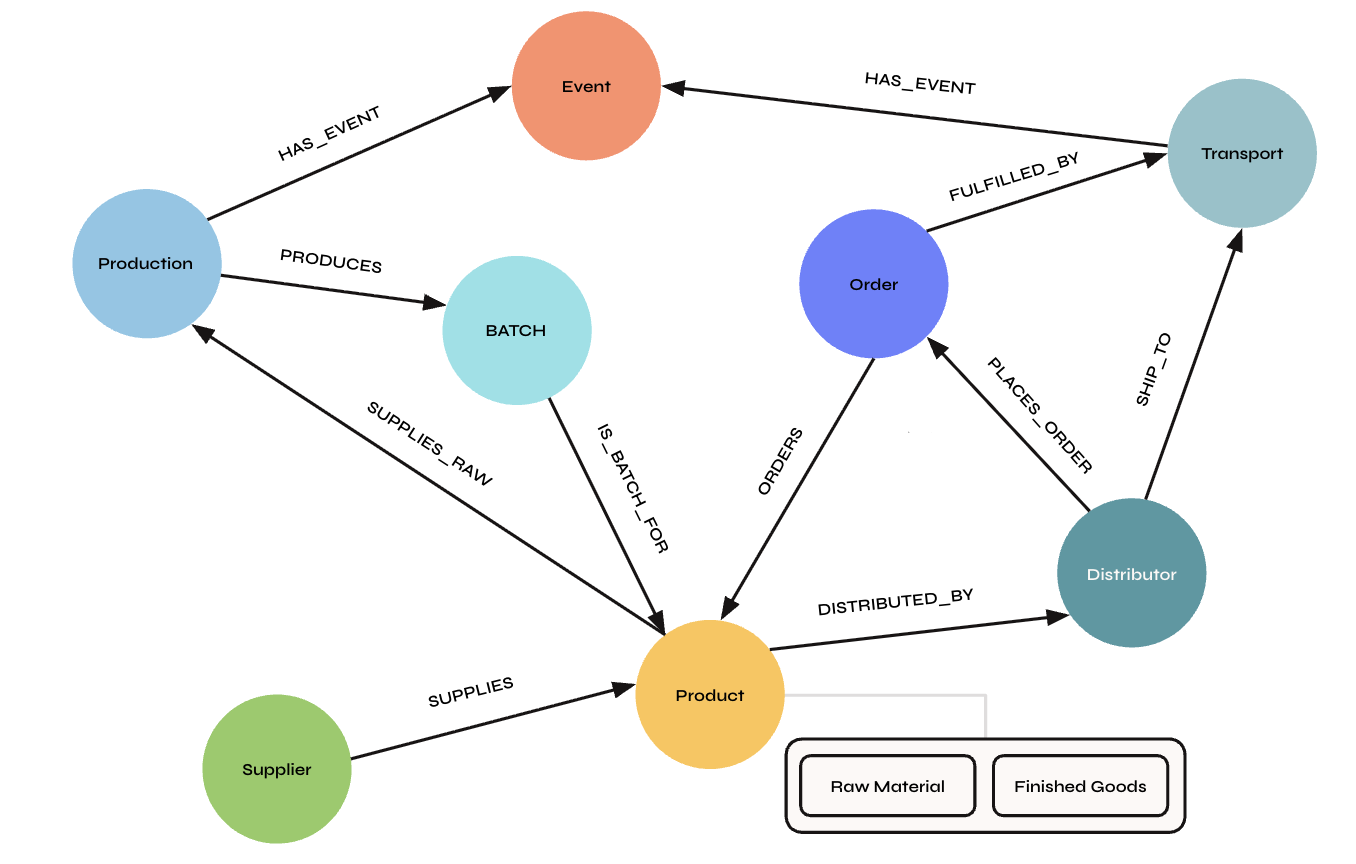
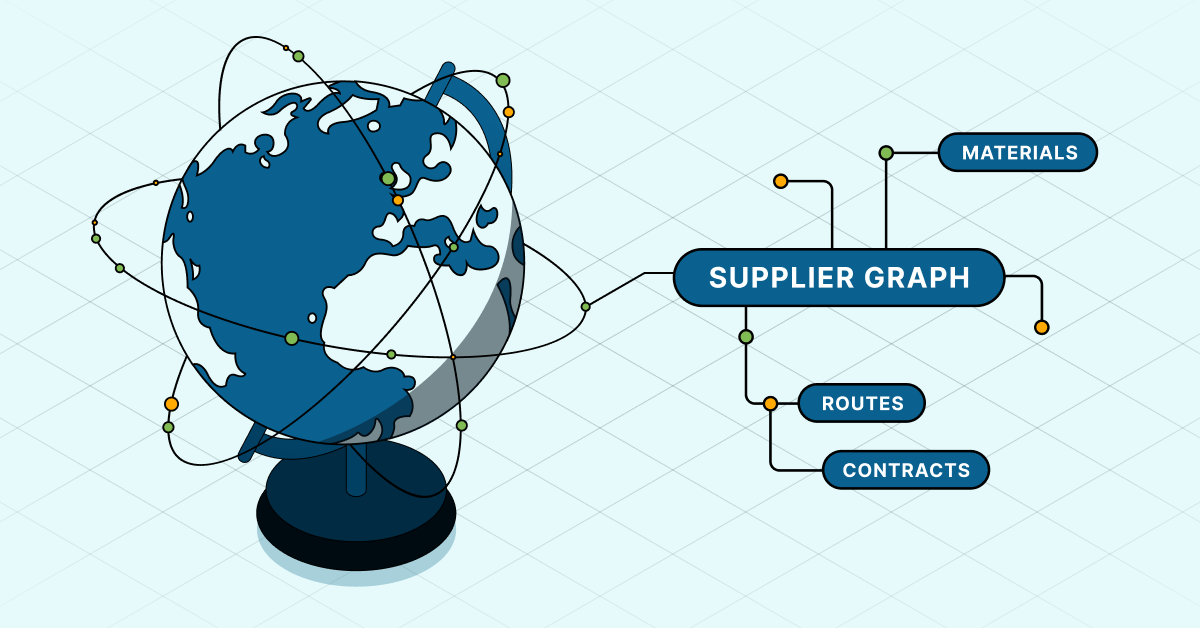
When you model your supplier data in a graph database, it becomes a Supplier Graph: a living, flexible model of your network with all its complex dependencies. This model replaces isolated records and data sources with a single operational view of your supply chain. A Supplier Graph shows how products move, where risks emerge, and how dependencies align across regions and tiers. More than just linking data from disparate sources, it provides context, allowing you to understand where bottlenecks are forming and where to focus first when demand spikes (or supply falls).
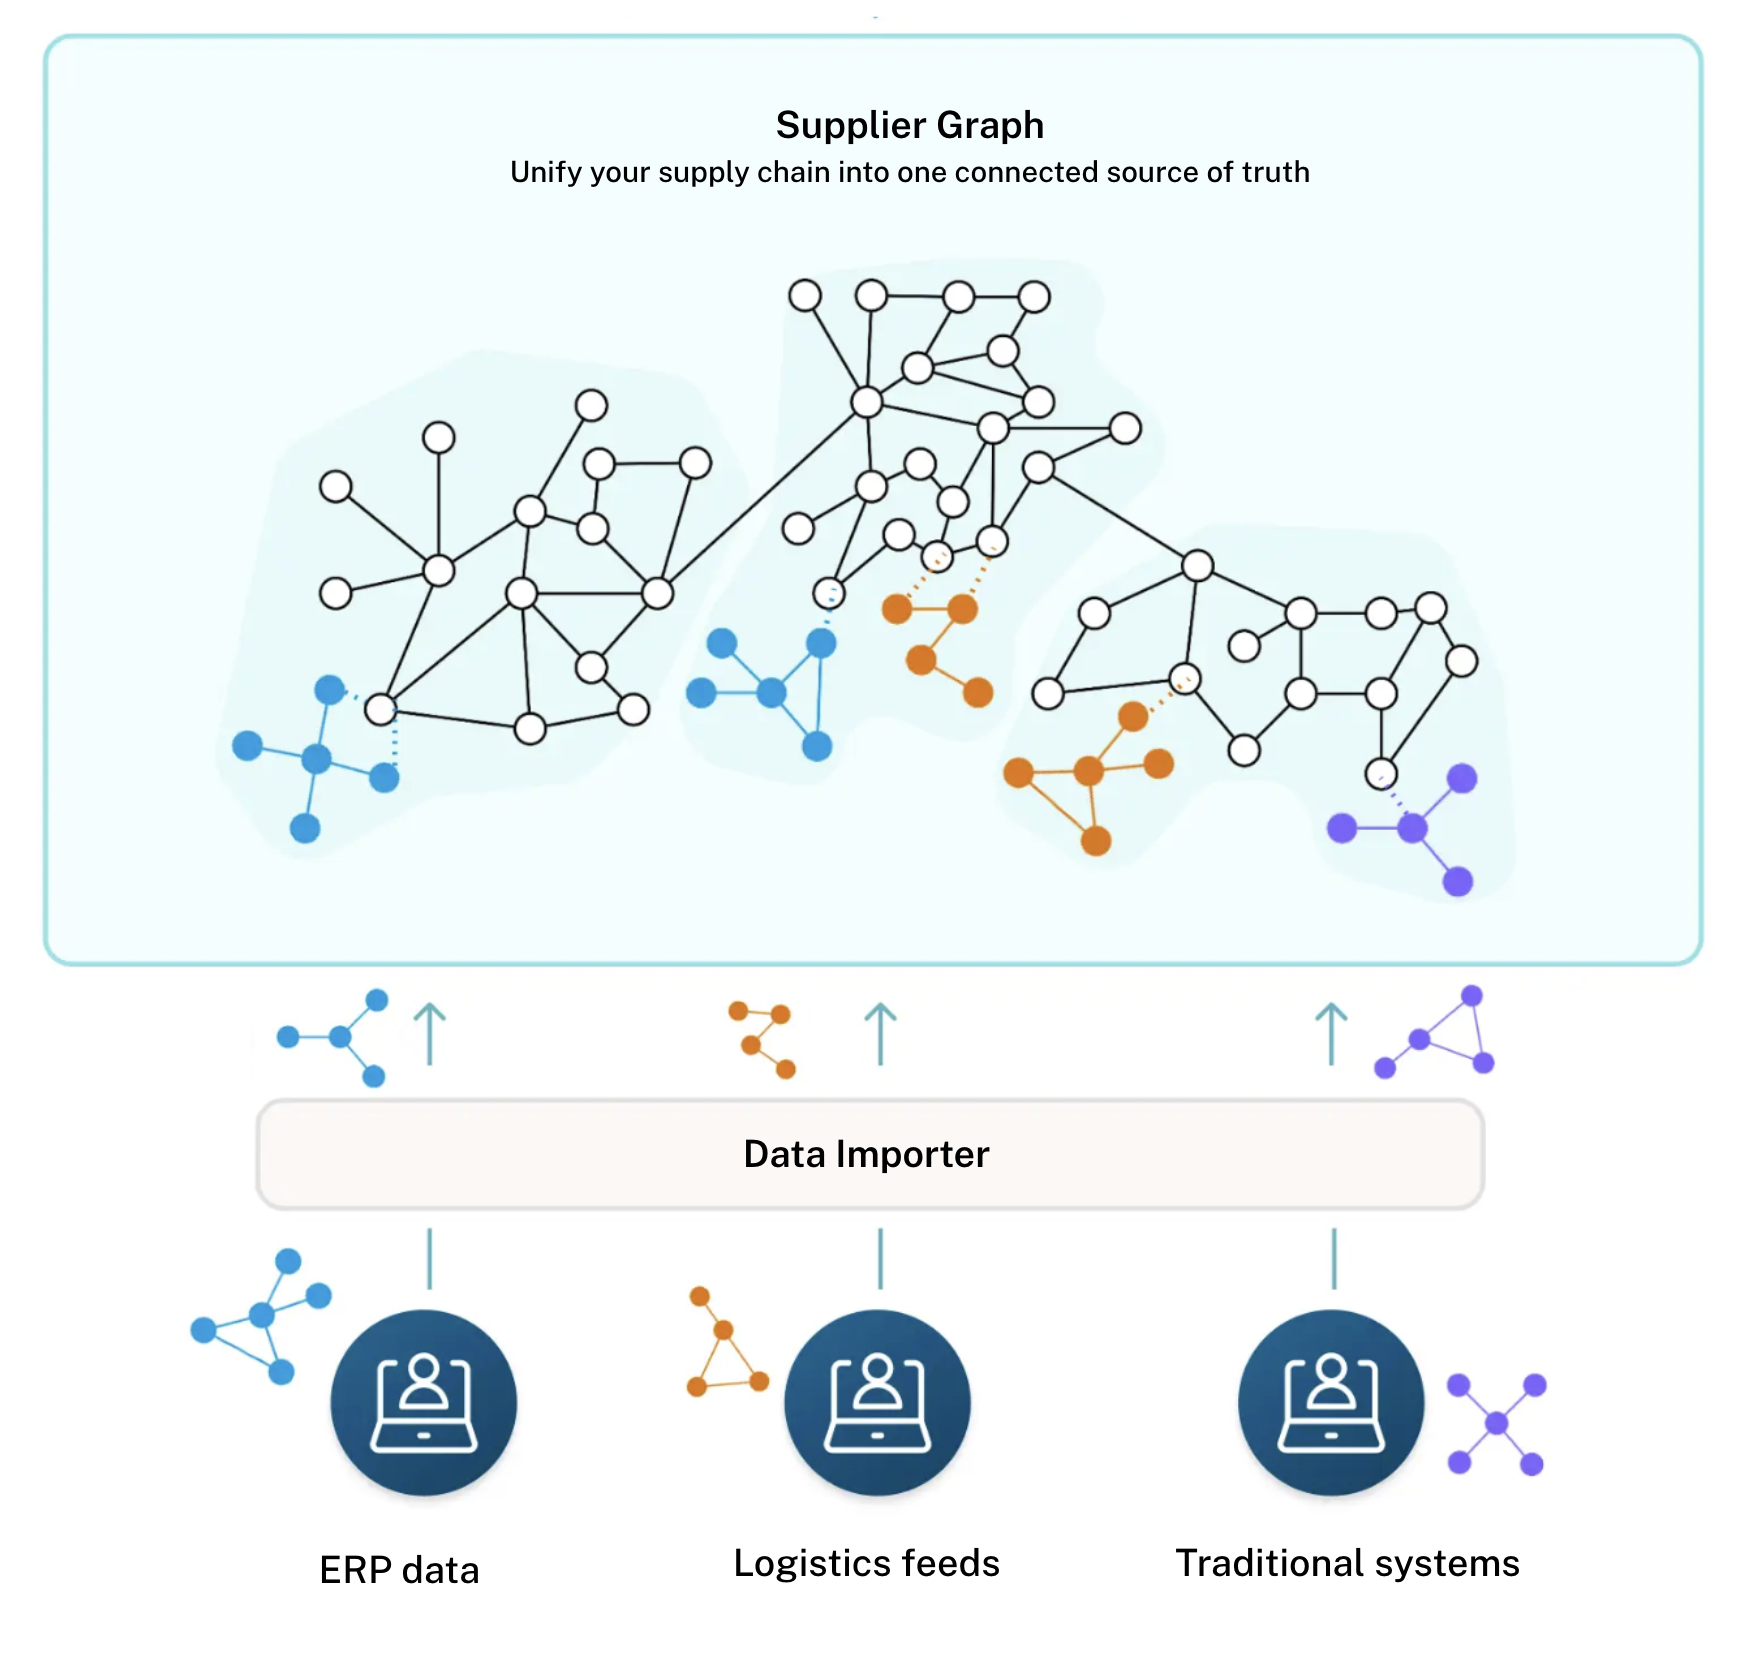
Instead of stitching together reports from ERP, procurement, and logistics systems, teams get a single, comprehensive view of the supply chain. The hours spent reconciling spreadsheets disappear, and are replaced by live insights everyone can trust.
With this common foundation and connected view, teams that handle procurement, planning, quality, manufacturing, and logistics can coordinate decisions instantly, without waiting for data handoff or batch updates. As your supplier network evolves, the Supplier Graph adapts accordingly; there is no need to refactor schemas or rewrite integrations.
When you can identify potential problem areas and act before they spread, the benefits quickly become clear: faster responses to disruptions, fewer stockouts, smarter resource allocation, and shorter planning cycles. Over time, that adds up to greater resilience and lower operational costs.
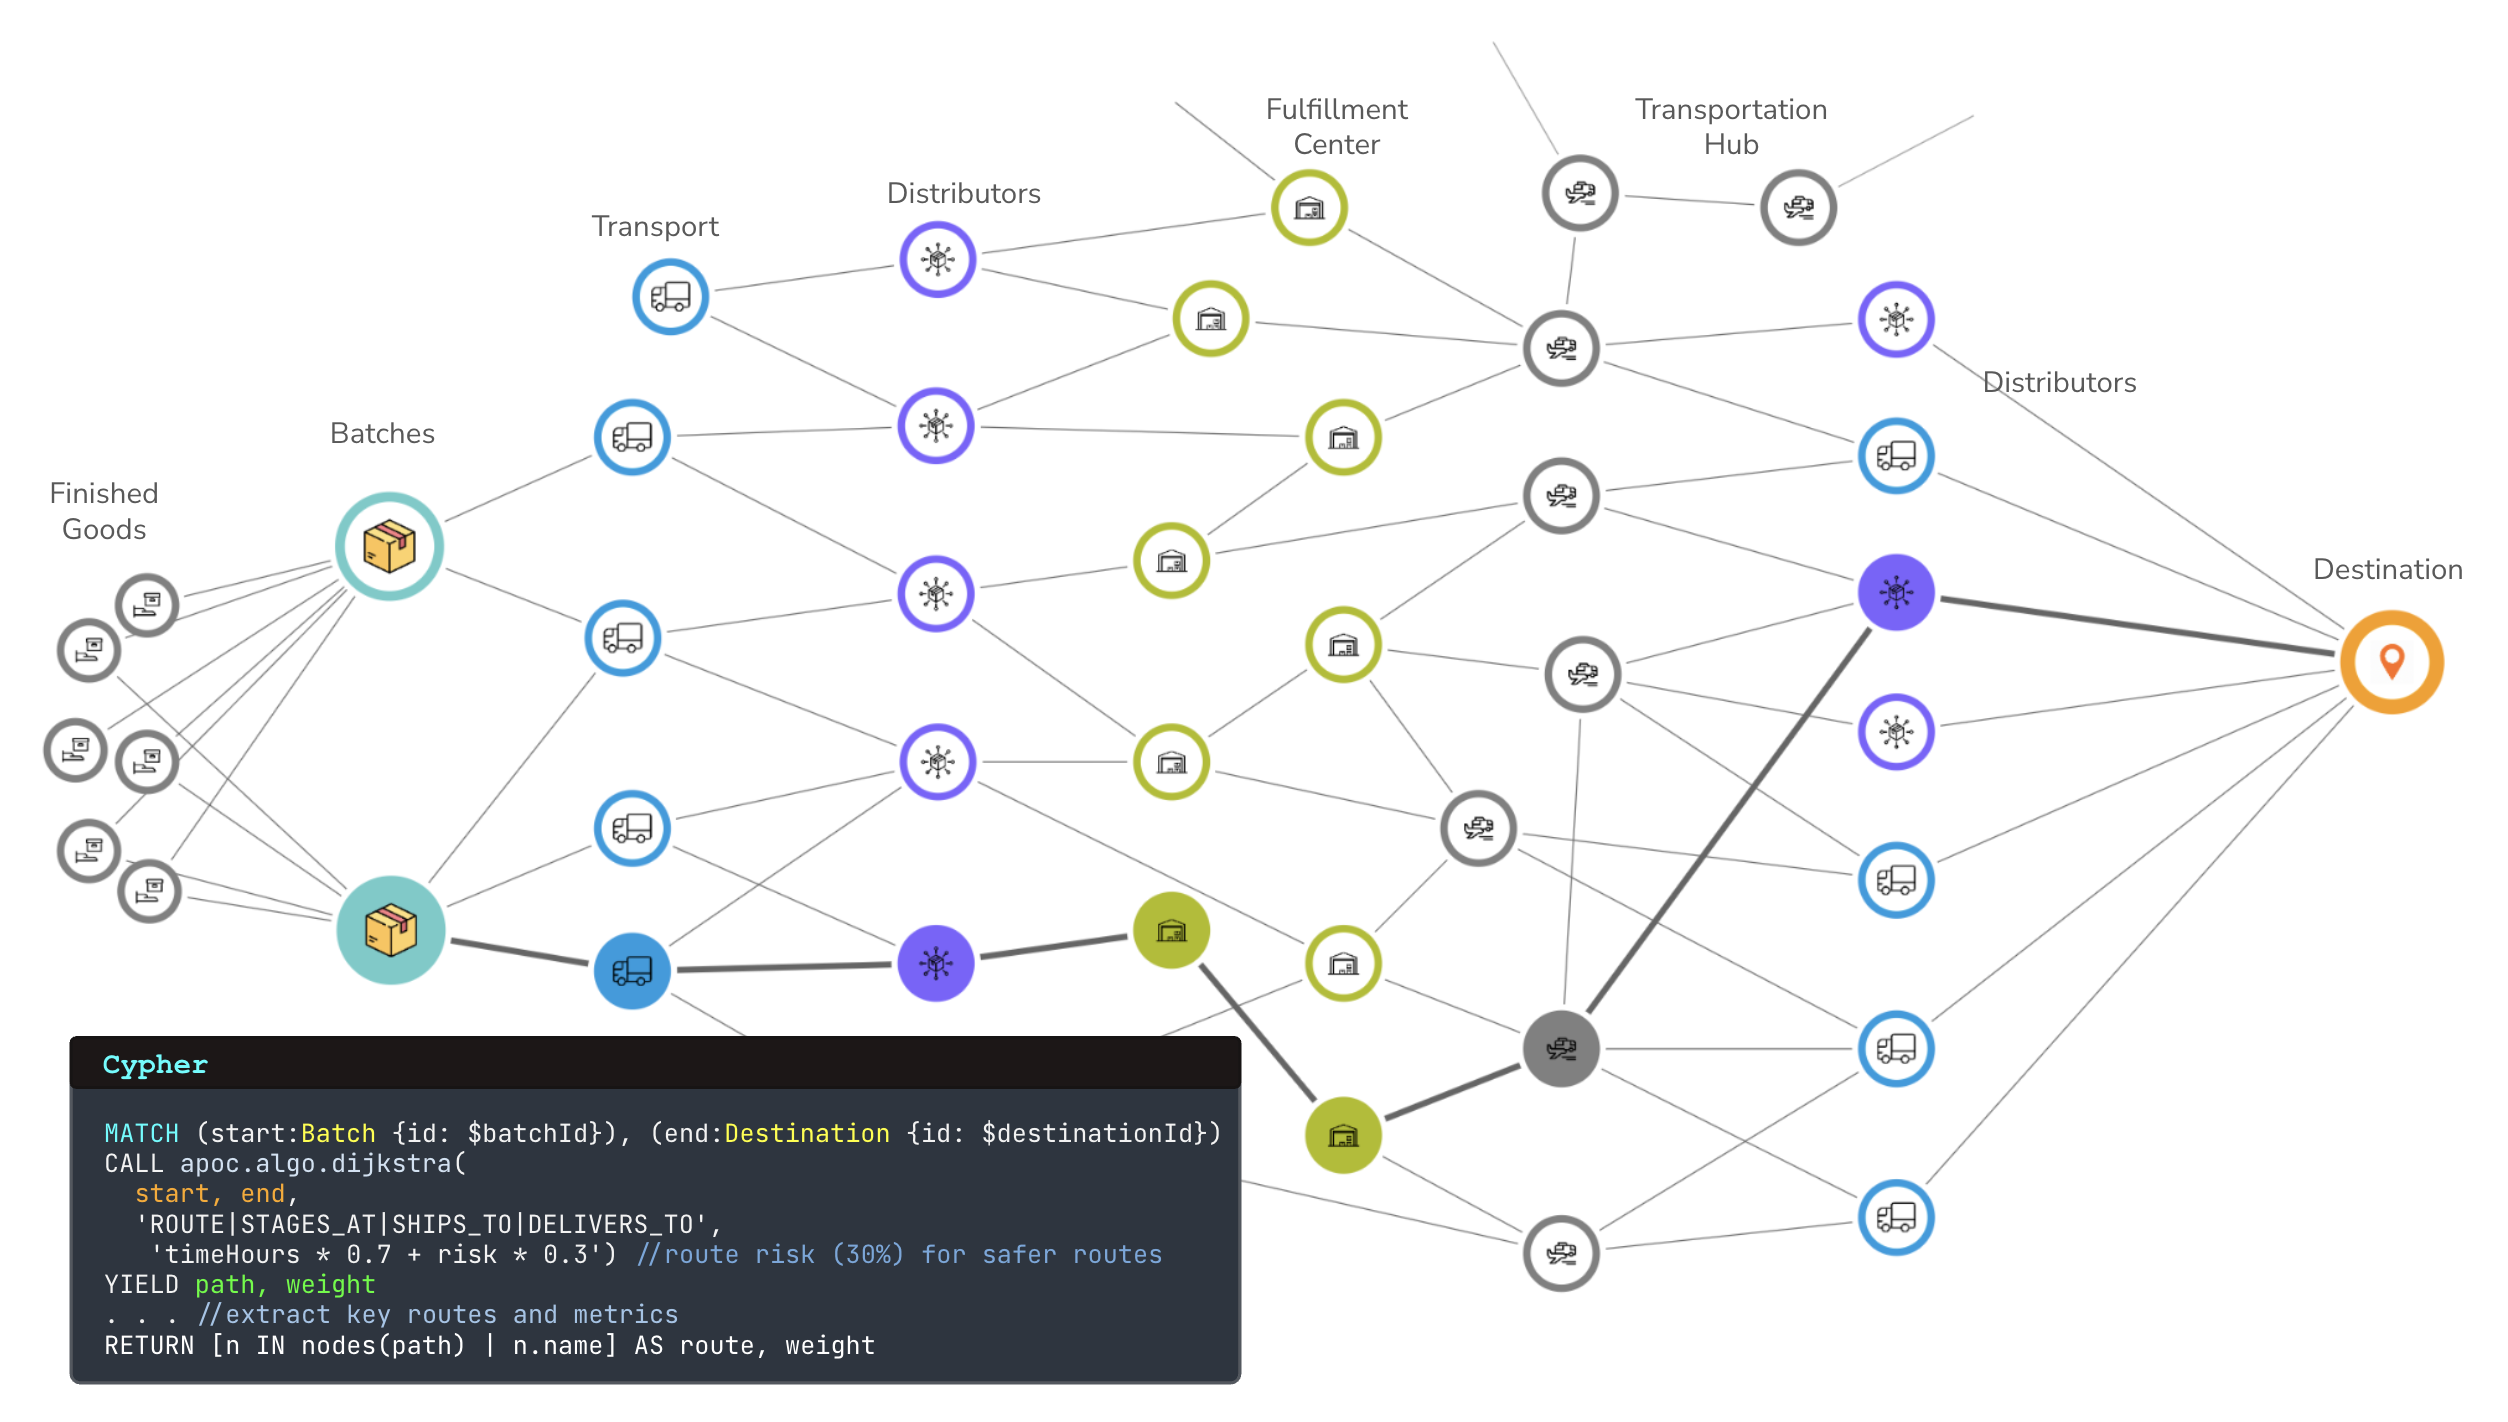
Want to explore what this looks like in practice? Check out a supply chain demo to see how Supplier Graphs are built.
Top companies use Supplier Graphs for real-time insights
Disconnected systems make it hard to see what’s really going on. By modeling relationships and adding context, a Supplier Graph helps teams understand what’s happening and what to do next.
Improving risk analysis during energy volatility
Risk in the supply chain isn’t just about a single point of failure; it’s about how that failure affects everything connected to it. For BASF, with 230 manufacturing sites and 70,000 suppliers worldwide, even minor disruptions can escalate fast.
To manage the complexity, BASF built a graph model containing approximately 1.5 billion nodes across materials, contracts, logistics, and production. When the 2022 EU energy crisis hit, BASF teams used that Supplier Graph to pinpoint products and value chains tied to natural‑gas supply, model pricing and profitability scenarios, and select alternate production or sourcing routes. This allowed them to shift plants and production before shutdowns, and also helped them protect their margins.
“A single change in production schedules creates thousands of downstream effects. Each division could examine their own part of the value chain, but without much upstream or downstream visibility.”
Making ESG compliance measurable and actionable
Sustainability goals lose traction when sourcing, asset, and emissions data live in isolated systems. At J.B. Hunt Transport Services, teams needed to understand how equipment movement and routing decisions collectively affected their carbon footprint and costs.
J.B. Hunt built a Supplier Graph model that linked vehicle-tracking data, equipment usage, and emissions metrics from more than 100,000 assets into a unified view. That model revealed key drivers of cost and carbon impact, such as where trailers were returning empty or sitting idle. With those insights, the team eliminated over six million empty miles and expanded their use of intermodal transport to operate more efficiently and sustainably.
Accelerating inventory planning with real-time insight
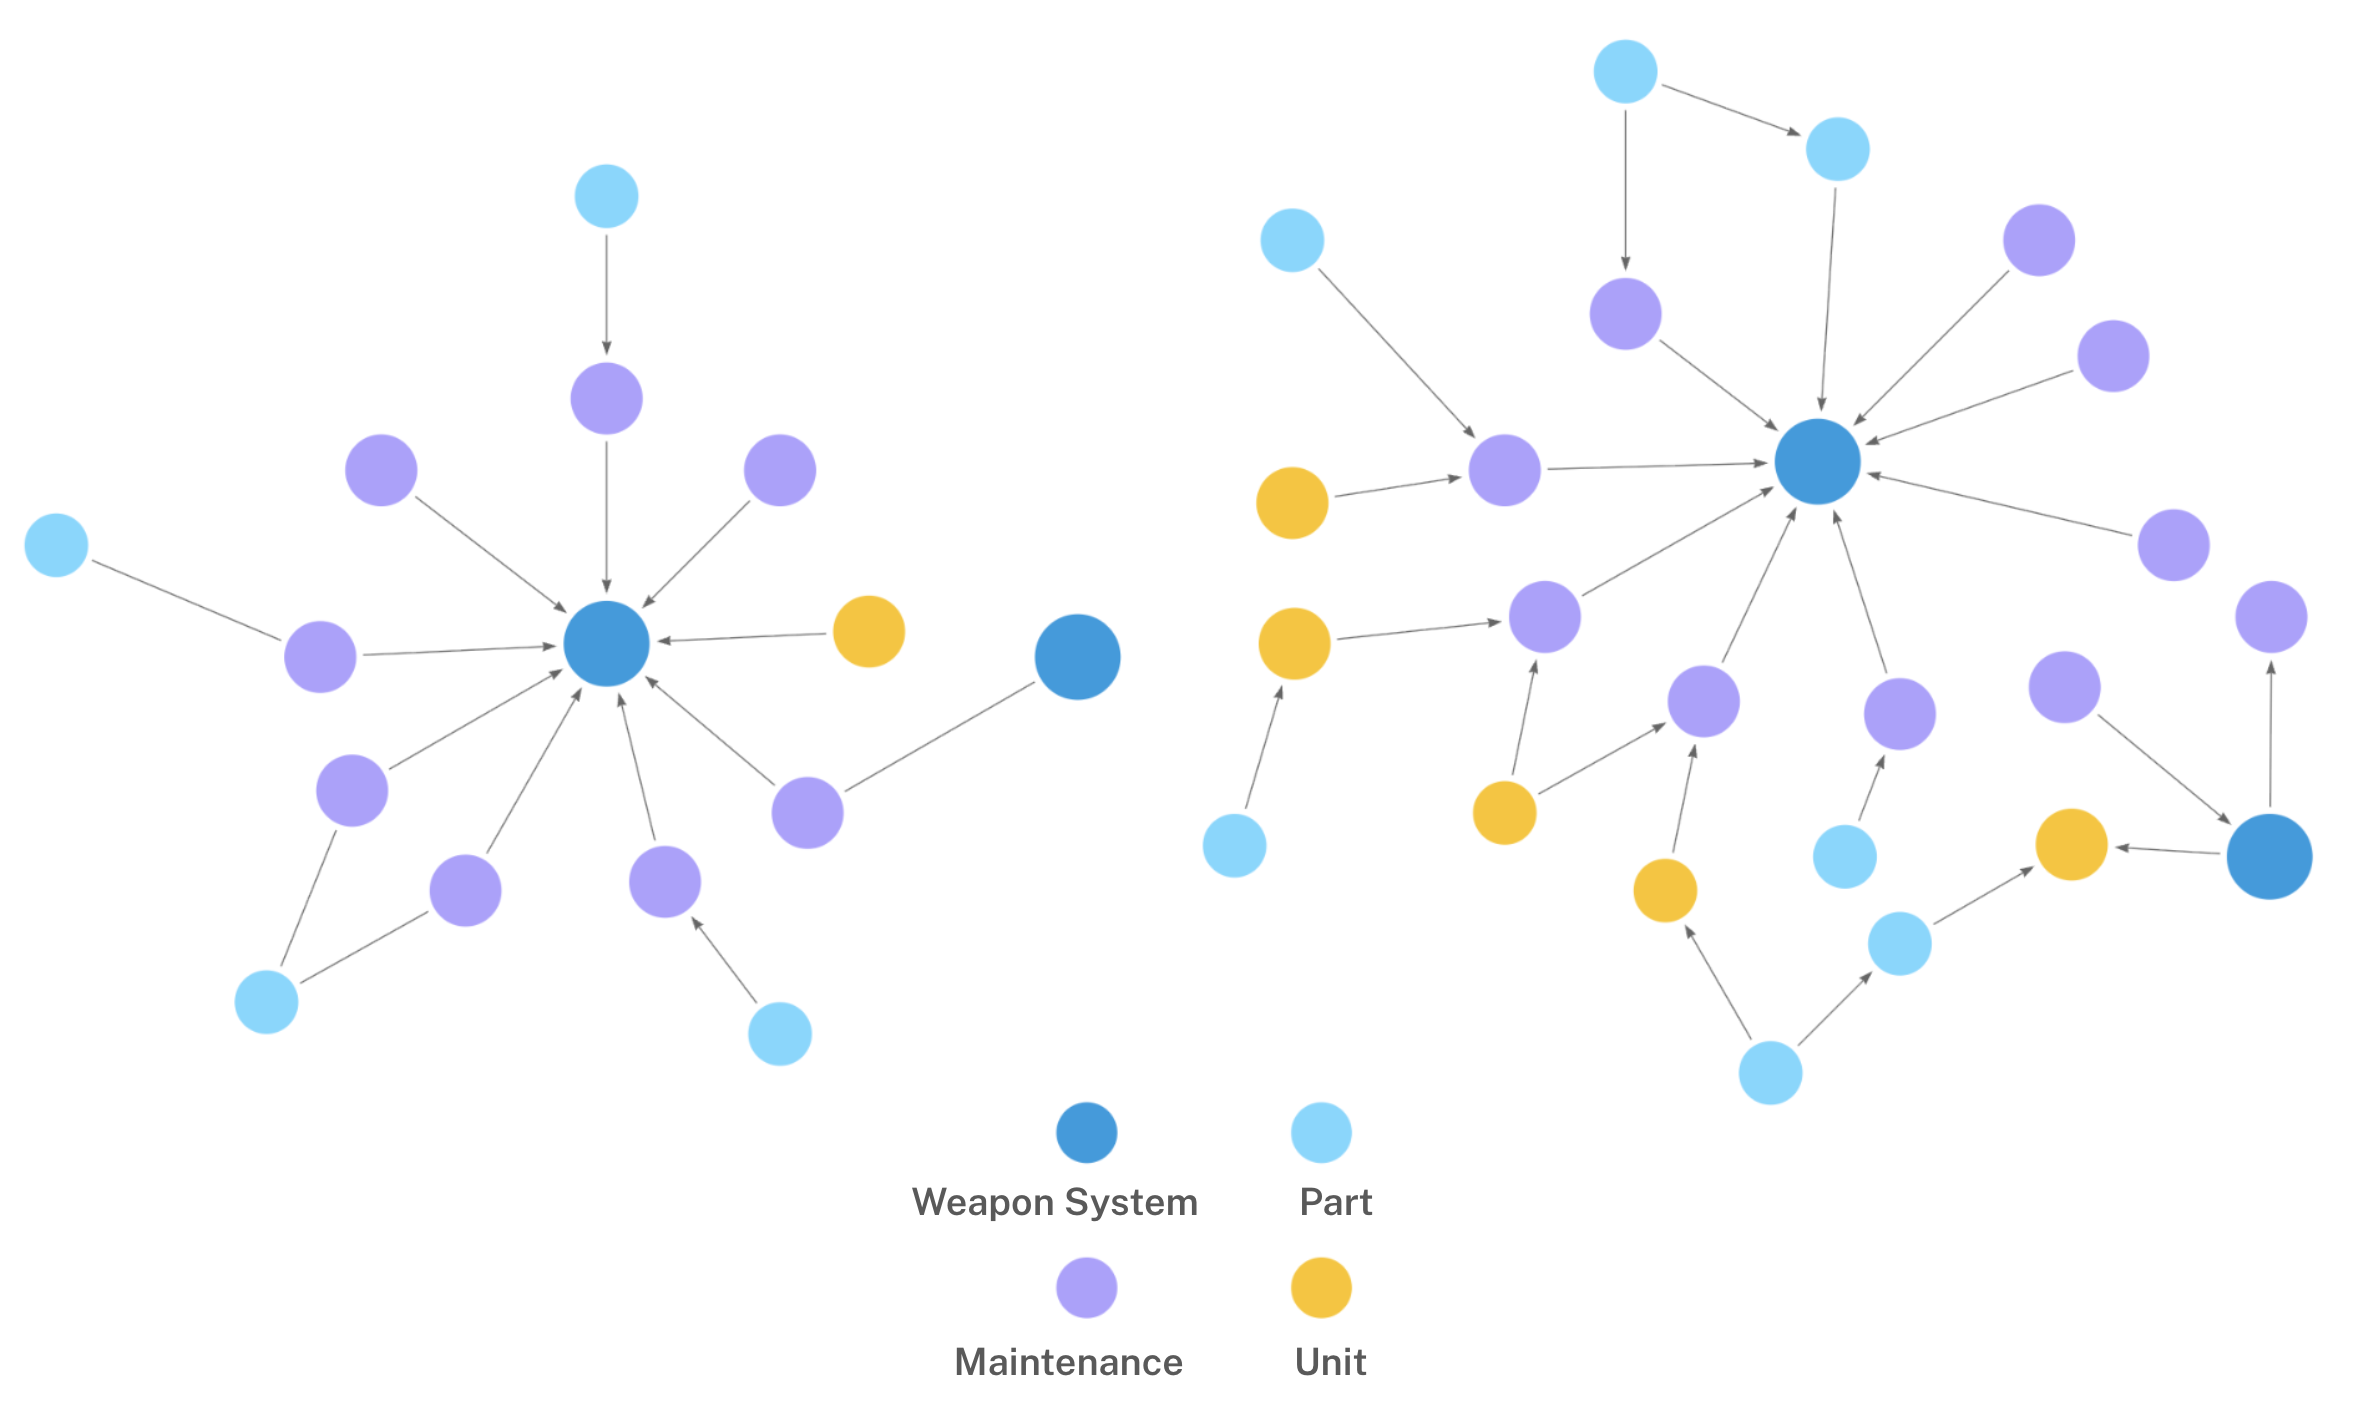
For the U.S. Army, slow logistics decisions weren’t caused by a lack of data, but by the effort it took to put that data in context. Analysts had to pull from systems that didn’t talk to each other, making it hard to evaluate supply risk or adjust plans in real time. With millions of components to manage and lifecycle costs accounting for up to 80% of total system costs, fragmented data kept holding them back.
By creating a Supplier Graph with over 5.2 billion nodes and 14.1 billion relationships, U.S. Army analysts could trace how parts link to vehicles, costs, missions, and maintenance. What once took 60 hours for cost-and-availability modeling now takes fewer than eight. The increased speed and clarity mean more accurate forecasting and better ordering, which in turn has improved the Army’s ability to use assets where they’re needed most.
Explore more supply chain use cases.
Expand visibility across your enterprise
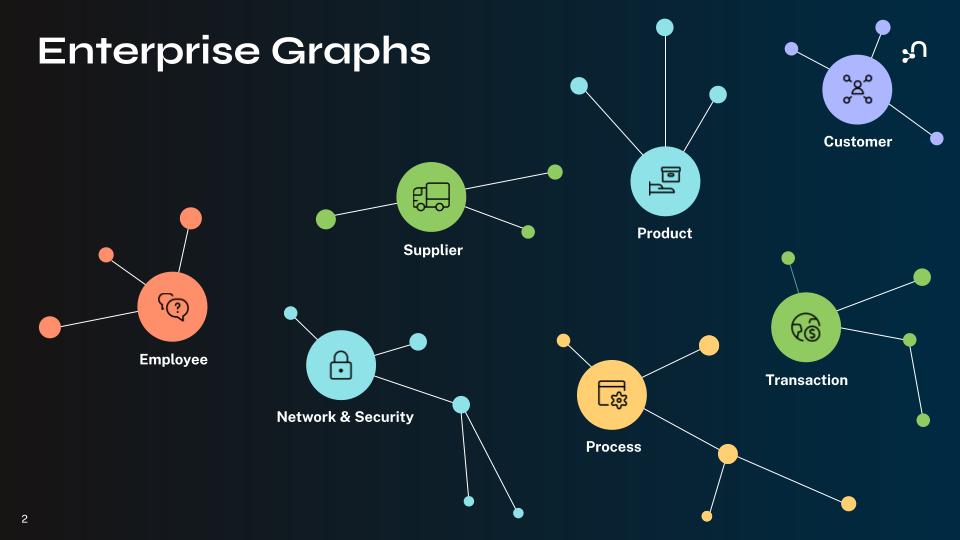
A Supplier Graph helps you solve supply chain challenges, and it’s just the beginning. The same graph-based approach can be used across your organization using any of the core Enterprise Graphs that reflect how people, systems, and resources connect in the real world:
- Customer Graph: Maps relationships across interactions, preferences, and journeys.
- Transaction Graph: Reveals patterns in financial flows and payment relationships.
- Employee Graph: Captures skills, roles, and institutional knowledge.
- Product Graph: Connects offerings, components, and dependencies.
- Process Graph: Visualizes operational workflows and business logic.
- Network & Security Graph: Monitors systems, access patterns, and risk exposure.
- Supplier Graph: Links vendors, materials, and resources across your supply chain.
Together, these Enterprise Graphs provide a clearer and more comprehensive view of your business, along with the key information you need at decision time. Teams can see how one decision affects another, even across departments, making it easier to spot risks and prioritize actions. And because the model adapts as your business (and data) grows, it helps you stay ready for whatever comes next.
Act decisively with supply chain clarity
Blind spots don’t go away on their own. A Supplier Graph gives you the context to see where change is coming from and understand what it affects, so you can make faster, better-informed decisions in the moment.
Instead of reacting after the fact, teams can adapt quickly to stay ahead of risks and inefficiencies and foster long-term supply chain resilience.
End-to-end supply chain visibility with a knowledge graph
Unify your data to build a resilient supply chain. Discover dependencies you didn’t know existed, spot risks, and make smarter decisions.
Share Article


Explore
Related Articles

APRA Just Put the Financial Sector on Notice Over AI. Government Agencies Need to Take Notes.

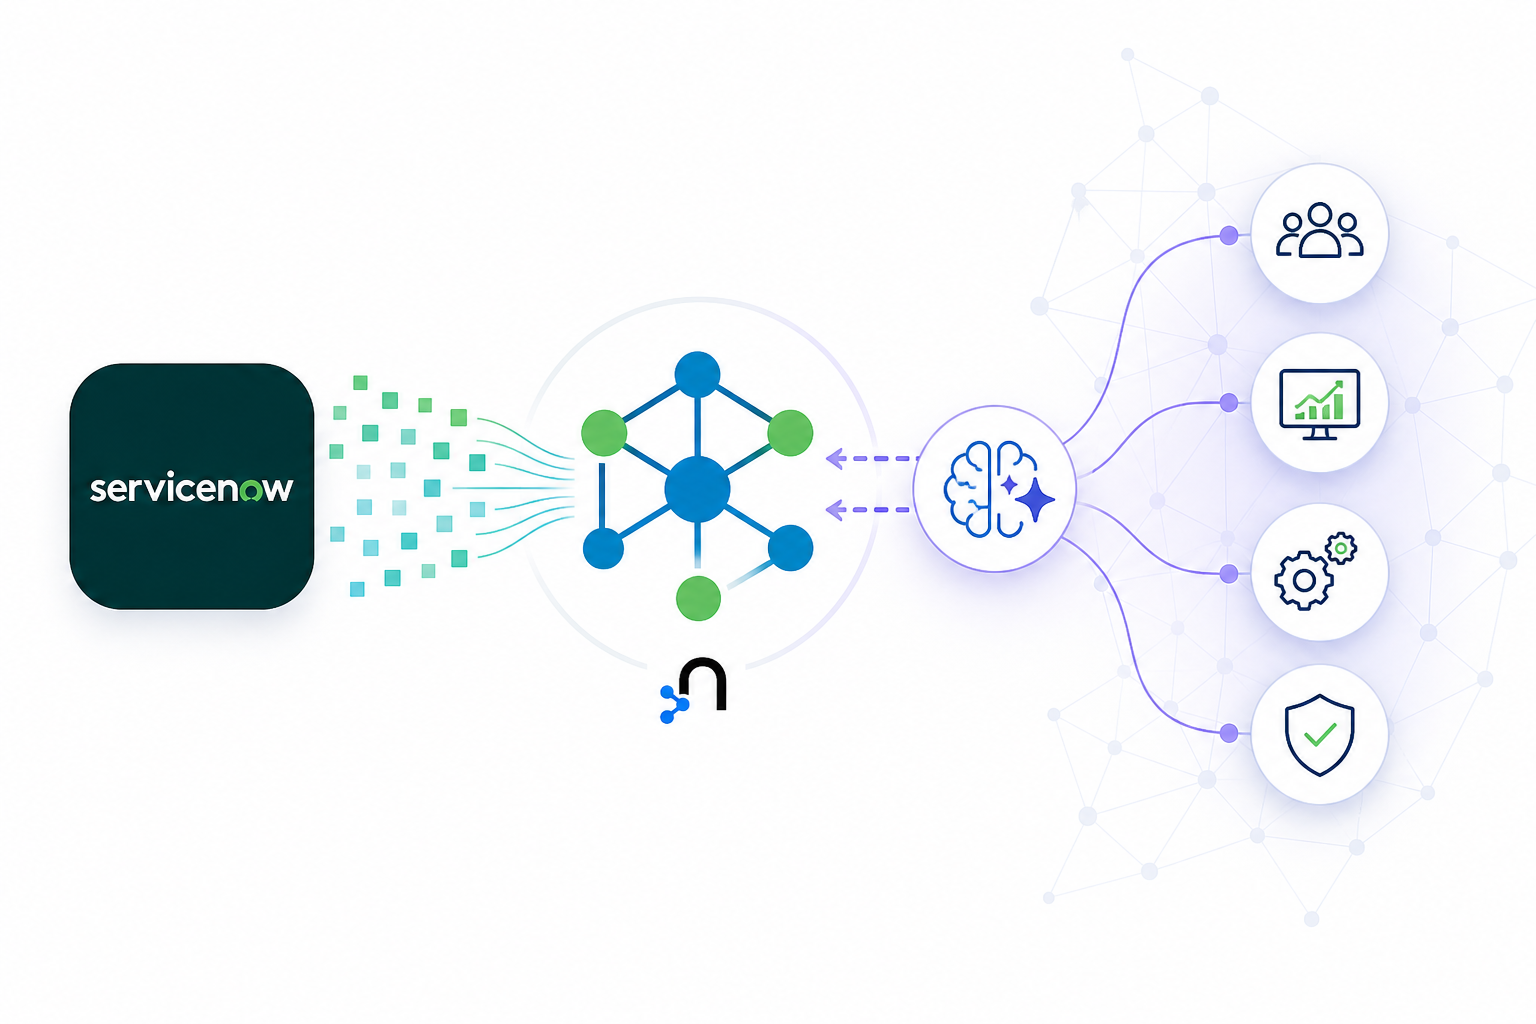
Turning ServiceNow data into connected enterprise intelligence