The data strategy that makes truly personalized customer experiences possible

Graph Database Product Specialist, Neo4j
9 min read
For most CX teams, the pressure to personalize at scale is a constant low-grade fever. For Tchibo—a retailer that changes its entire product catalog every week—it’s a weekly sprint. Imagine changing your entire product catalog every seven days, then try doing it while maintaining a seamless, data-driven customer journey. Even for the most data-rich organizations, this isn’t just a challenge; it’s a high-stakes test of whether your data is an engine that drives action or an anchor that weighs you down.
Most companies face a similar disconnect between siloed data and customer demand for speed, which may explain why customer experience is at an all-time low. According to Forrester’s 2025 US Customer Experience Index, CX quality in North America has declined for the second year in a row. “Customer experience continues to erode worldwide, reflecting a concerning multiyear downward trend and a shift in sentiment from positive to neutral,” said Pete Jacques, principal analyst at Forrester.
Most teams have plenty of data. What they’re missing is the ability to understand how identities, behaviors, and journeys relate to each other in real time. When your systems can’t connect those pieces, every customer touchpoint operates on partial information. Personalization lags behind behavior, customer behaviors become fragmented across channels, and AI tools end up guessing instead of grounding recommendations in real customer behavior.
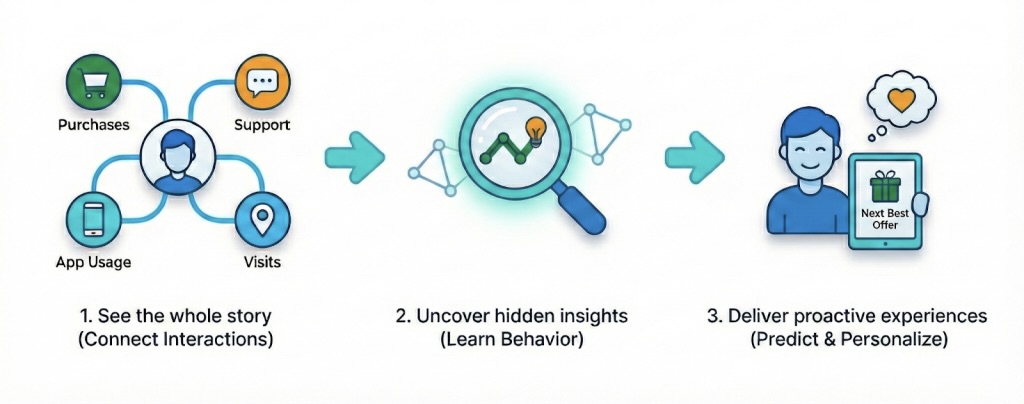
This is why companies like Tchibo turned to a different approach: mapping and storing the relationships between people, products, and actions in the data model itself so they can anticipate what each customer is likely to want, need, or struggle with next and respond in the moment, not hours or days later. And that shift, from simply collecting data to connecting data and finding hidden patterns, is what powers truly real-time, responsive, AI-ready CX.
The symptoms of disconnected CX hide in plain sight
Disconnected data isn’t just a technical problem—it shows up in everyday customer interactions, right at the moments when relevance and continuity matter most. It’s why personalization feels slightly off, support interactions feel repetitive, and AI-powered recommendations miss obvious signals.
Many teams have already consolidated data into a single system. But without real-time connections between identities, behaviors, and journeys, those systems still produce shallow insights and delayed responses. A customer might start a task in your app and complete it on the website, yet those actions are treated as separate events. The same person may appear under multiple identities, obscuring their full history and intent.
These gaps make it easy to miss the moments that matter—early signals of churn, shifts in behavior, or opportunities for timely intervention. Rigid data models and batch-based processes can’t keep pace with how quickly customer context evolves, leaving critical insight locked inside disconnected tools.
The impact starts to show in the metrics: lower retention, slower conversion, flatlining lifetime value, and a shrinking window to experiment and adapt. Teams spend more time stitching together insight than acting on it. And without a connected, real-time view of customer behavior, even the most sophisticated AI tools are forced to operate on partial context—limiting their ability to guide the next best action when it counts.
Customer data platforms (CDPs) fail to deliver what knowledge graphs provide
Customer data platforms (CDPs) are often seen as the answer to disconnected CX. They help unify data from across the business into one centralized view, which is a critical first step. By resolving identities and consolidating activity from marketing, sales, and service channels, CDPs aim to provide teams with a single source of truth.
But CDPs don’t deliver all that’s promised. You might get a static list of attributes that describe what happened, but not why. CDPs don’t natively capture the complex, fast-changing relationships between that data in real time. Because many CDPs rely on a relational database for their infrastructure, it can be quite difficult to adapt to new customer demands as they occur.
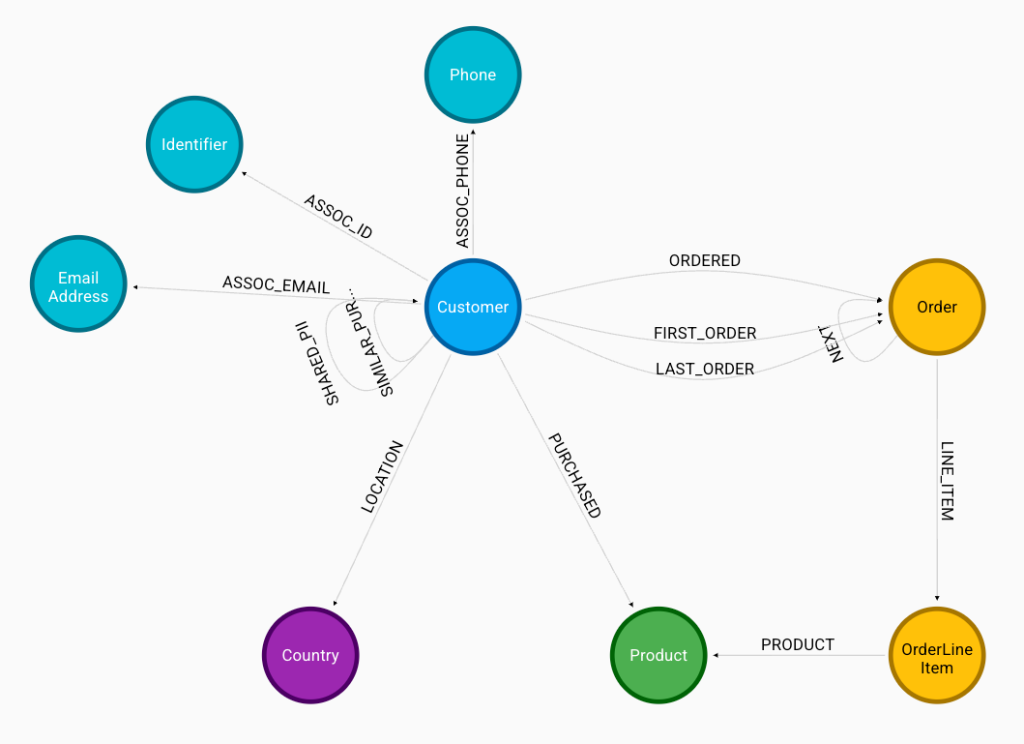
A knowledge graph offers a connected approach that goes beyond a traditional customer database by structuring data as a network of real-world entities (such as people, products, or events) and their relationships to each other. This makes it possible to uncover patterns that might otherwise stay hidden.
A Customer Graph is a type of knowledge graph built for CX. Rather than storing records in separate tables, a Customer Graph maps how people, products, support tickets, web visits, and other touchpoints connect across the customer journey. Because the graph model captures relationships as they’re created or updated, a Customer Graph surfaces patterns and connections the moment the underlying data changes—something traditional systems struggle to do. It connects context to action by making customer behaviors easier to interpret and respond to, so teams can deliver better experiences faster and improve retention and lifetime value.
Three ways a Customer Graph improves CX right now
When you can see how customers, behaviors, and touchpoints connect, you unlock faster, smarter ways to personalize and respond.
Unify identities for true customer 360
Many customer experience bottlenecks start with identity. When customer, behavioral, and verification data live in separate systems, teams waste time reconciling records, decisions slow down, and customers are asked for the same information repeatedly. Prospa faced this challenge as its loan operations scaled. With identity signals scattered across financial data, application metadata, third-party sources, and internal systems, the team spent hours manually confirming which records belonged together—and that friction became the biggest blocker to fast, consistent service.
Prospa solved this by building a Customer Graph that connected every identity attribute and showed how those attributes relate to one another. Instead of treating each field as a standalone datapoint, the graph highlighted which identifiers matched, which behaviors mattered for risk evaluation, and which attributes were truly meaningful for creditworthiness.
That connected context enabled Prospa to automate verification, eliminate repetitive checks, and trust the graph’s unified view of each applicant. This approach reduced manual verification work by 80%, reduced loan approvals from 48 hours to just two, and enabled customers to experience a smoother, more responsive journey.
Serve smarter recommendations in the moment
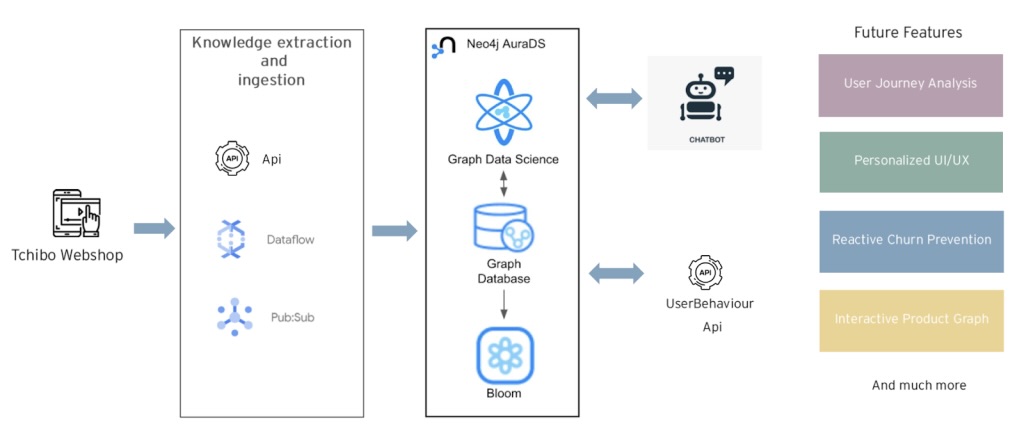
Many customer experience teams struggle to deliver relevant recommendations because their systems rely on static segments or yesterday’s behavior. When product relationships and customer interests shift quickly, batch models trained on past activity can’t keep up—and the experience starts to feel generic. Tchibo, a retailer that refreshes its entire product catalog every week, felt this challenge acutely. With fast-changing inventory and customers constantly browsing new items, traditional recommendation engines had no way to interpret real-time interest or adapt to evolving product relationships.
Tchibo solved this with a Customer Graph that connected products, browsing behavior, purchase history, and session context into a single, relationship-driven model. The graph didn’t just store product data; it mapped how items relate to one another, how customers move between categories, and what signals indicate current intent. That connected context allowed Tchibo to generate hyper-relevant product suggestions as customers browsed, computing affinities in real time (22 milliseconds) rather than relying on outdated history.
Spot churn risks before it’s too late
Most churn signals never appear in one place. They surface as subtle patterns across billing, support, content engagement, and account activity—and when those systems don’t talk to each other, early warning signs go undetected. A technology media company faced this exact challenge as subscriber growth accelerated. Data on declining engagement was stored in their analytics tools, payment issues in billing systems, and support complaints on a separate platform. Without a way to connect these signals, teams could only respond after subscribers had disengaged.
The company addressed this by building a Customer Graph that unified every subscriber signal and exposed the relationships between them. The graph revealed how specific events combine to indicate churn risk, such as a drop in usage linked to a recent support issue or a billing change connected to declining content consumption. By layering a natural-language insights interface on top of the graph, teams could query subscriber behavior instantly and surface emerging risk patterns without manual analysis. This approach produced a 10× increase in analytics speed, cut manual work by 92%, and enabled teams to identify and act on churn indicators much earlier, improving retention and strengthening customer relationships.
Want to dive into other customer 360 uses of a knowledge graph? Explore additional graph use cases or watch a Customer Graph demo to see the technology in action.
Make your CX strategy more connected and responsive
Disconnected data slows you down and stands in the way of delivering the experiences your customers expect. A Customer Graph helps you break through that barrier by connecting the people, products, and touchpoints that define each journey. With that context in place, you can personalize faster, act earlier, and trust the insights that drive your decisions.
Neo4j Graph Intelligence Platform provides the tools to build your Customer Graph. It gives your teams the ability to model customer relationships in real time, adapt to new behaviors without waiting on rigid schemas, and use graph-native tools to query, analyze, and integrate insights into CX workflows.
And while CX is a key area that benefits from a connected data approach, a Customer Graph is just one part of your enterprise data management strategy. The same model for managing connected data applies to other parts of your business. You can connect product, transactional, and process data to create visibility and support more intelligent decisions across your enterprise.
Fix fragmented CX with a knowledge graph
Unify your data. Spot patterns. Deliver experiences people actually love.
Share Article


Explore
Related Articles
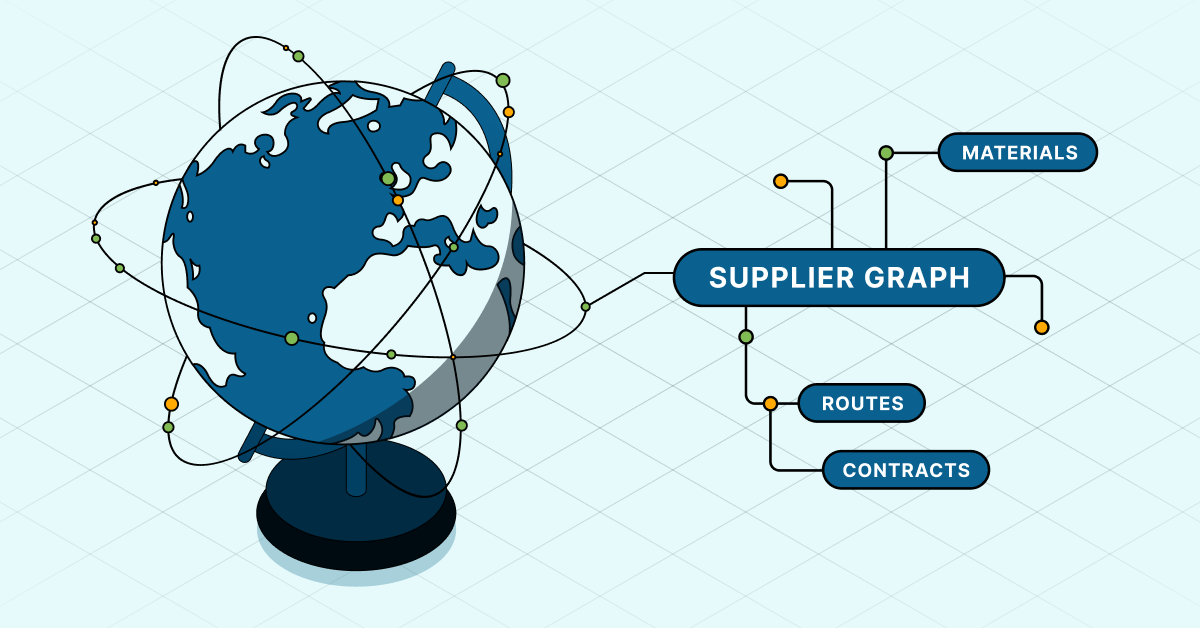
What’s invisible in your supply chain could cost you

APRA Just Put the Financial Sector on Notice Over AI. Government Agencies Need to Take Notes.

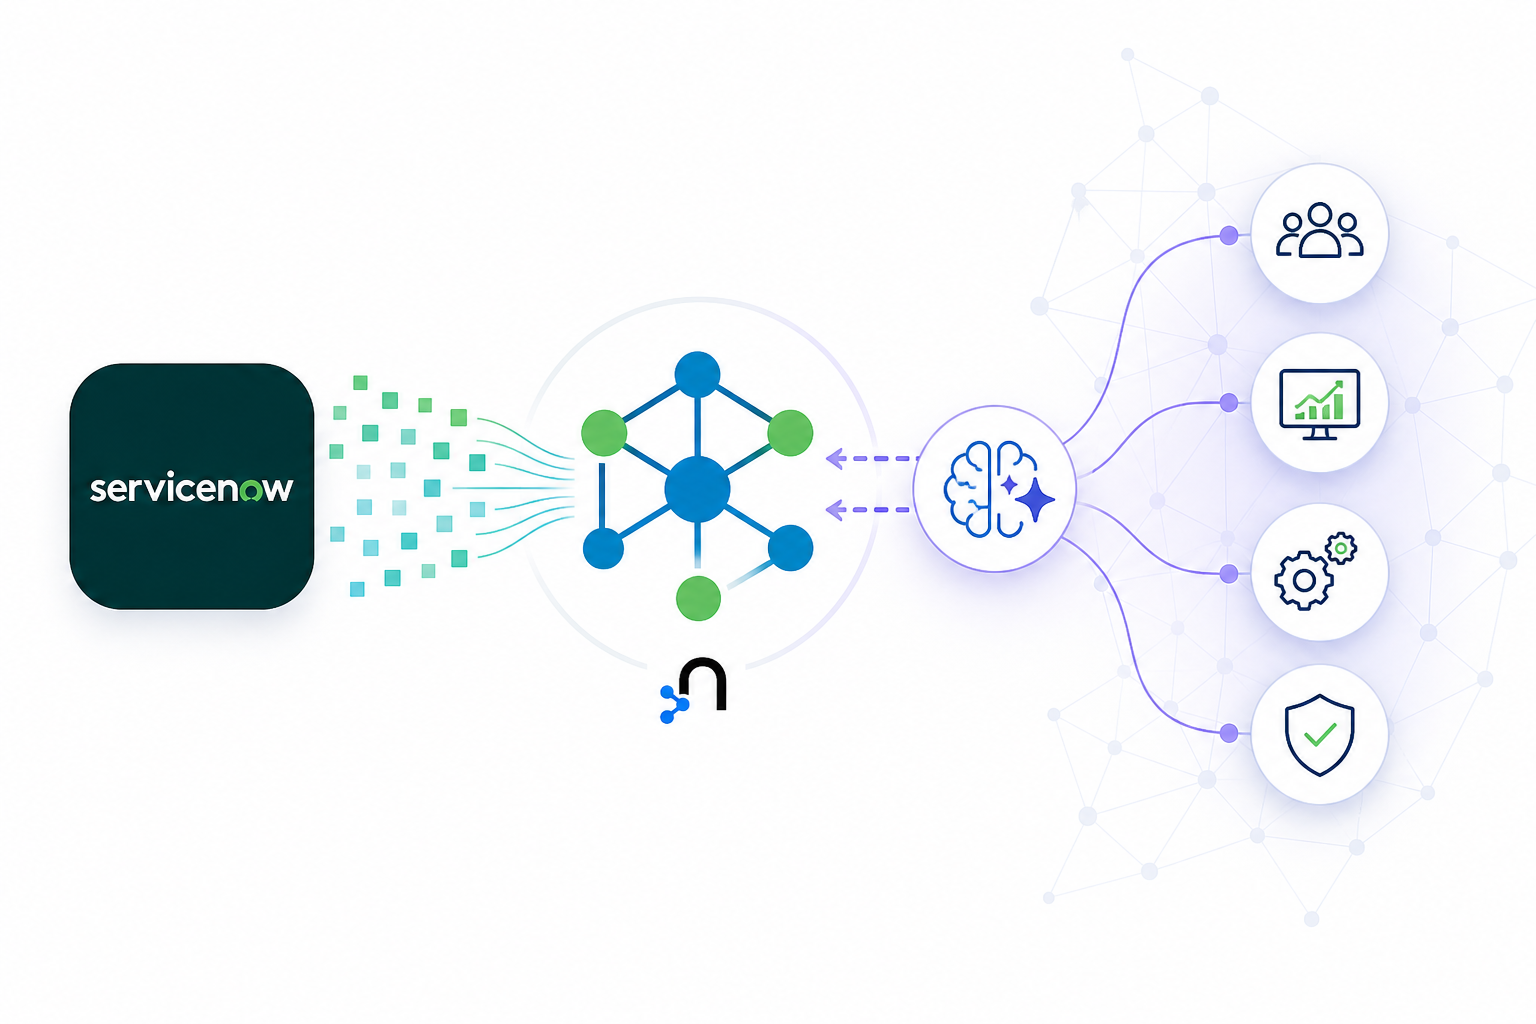
Turning ServiceNow data into connected enterprise intelligence