
Government agencies at any level operate as dense, interconnected systems. Citizen touchpoints, employee engagement, supplier networks, operational flows, and IT systems form living networks that change continuously.
Some of the most valuable insights about these networks of data elements come from the relationships between them – showing how people, processes, systems, and events are actually connected and how changes in one area impact another.
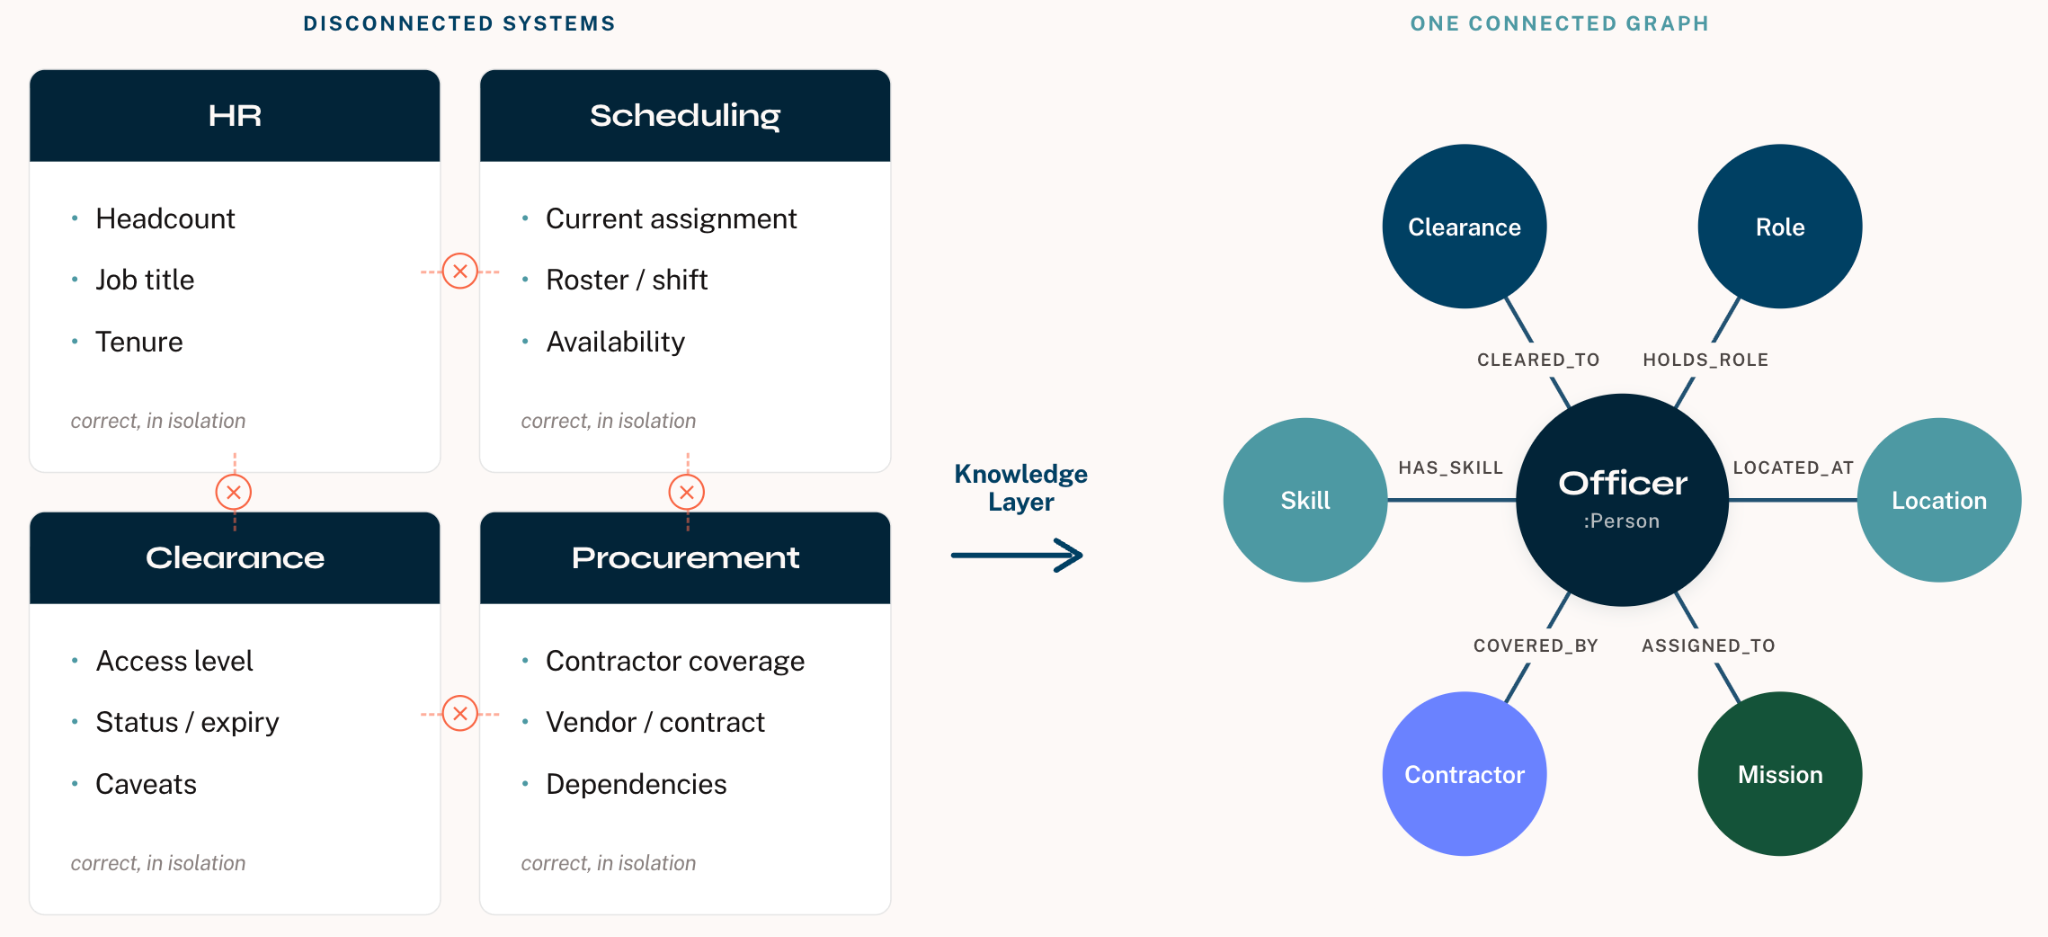
Yet most enterprise data is still managed as if these connections don’t matter—locked in traditional row-and-column data management systems, optimized for reporting rather than understanding. These systems fail to represent the presence and character of relationships within the data.
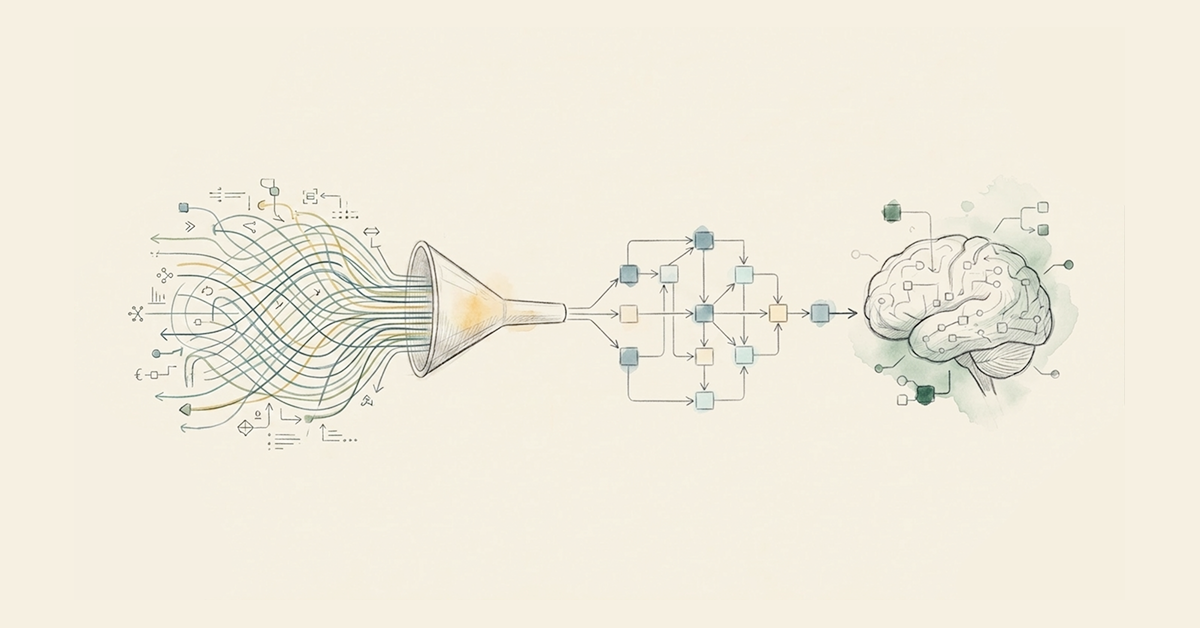
As agencies push AI and agentic AI applications from their pilot phase into production, this mismatch is becoming a limiting factor. Models can generate fluent answers, but without context and accuracy, those answers often fail to help teams that need to act on them.
Graph technology provides missing context by explicitly modeling relationships alongside data entities, creating a connected network optimized for traversal and analysis.
With graph, the way data is stored, queried, and analyzed mirrors how leaders naturally describe how their agency works. Context is no longer reconstructed after the fact—it is embedded directly in the data layer.
When AI misses the mark
Decades of investment in relational and NoSQL databases have produced rigid silos that are expensive to change and difficult to connect. Relationships only become implicit or inferred at query time through joins that require development time, carry a query performance cost, and are hard to adapt as organizations change.
Traditional data management systems work for static reporting. However, they struggle—and often fail—when teams need to trace dependencies, assess impacts, or reason across systems.
Consider a common supply chain risk management scenario:
A team asks an AI assistant: “How exposed are we to this supplier?” The model summarizes documents, pulls recent reports, and produces a confident answer. But it misses indirect supplier dependencies, shared components across products, and recent incidents tied to subsidiaries.
The response is accepted and acted on. Weeks later, a bottleneck emerges when multiple suppliers are discovered to rely on the same constrained sub-supplier.
Departments, like the Army and the Navy, face disruptions to maintenance and readiness—along with increased operational risk—when mission critical paths and dependencies remain hidden.
The issue isn’t a lack of data. It’s a lack of visibility into the relationships between data. By the time a dependency is uncovered, missions absorb the impact.
Making mission complexity understandable with graph
A graph database changes this by representing primary entities as nodes, with connections between them as relationships which are also considered to be first-class data elements.
For example, personnel, suppliers, components, systems—are stored as node data elements. Relationships are used to capture the complex network representing which suppliers provide which components; which suppliers source from others; and which systems share common components from different suppliers.
Analysts surface contextual findings captured in the graph using powerful traversal queries which reveal insights in the form of paths and patterns across the data.
Graph databases are not typically subject to schema restrictions that are inherent to relational systems. This makes graph representation an ideal approach for unifying disparate data sources into a single, navigable data network that reflects operational reality.
The result is faster insights, deeper analysis, and the ability to reason across the organization in near real time—spotting inefficiencies,improving program impact, and responding to change with confidence.
Why this matters for AI
AI systems are only as reliable as the knowledge in which they are grounded. Large language models are inherently probabilistic. Enterprises, however, need precision, traceability, and governance—particularly in regulated and mission-critical environments.
Here is where knowledge graphs become foundational. In a graph-enabled AI architecture, the graph serves as the factual layer of record. The model generates queries and synthesizes results, but the graph performs knowledge discovery: traversals, search, vector similarity, and inference.
This shift delivers tangible benefits:
- Answers grounded in verified enterprise data
- Clear provenance and explainability
- Full auditability of prompts, queries, and responses
- Faster root-cause analysis when outcomes fall short
Instead of approximate summaries, teams get exact answers they can act on—with confidence in how those answers were derived.
From retrieval to reasoning with agents
Agentic AI raises the bar further. Rather than a single retrieval step, agents plan, iterate, and refine across multiple tools until a question is resolved. In practice, this means combining vector search, graph traversals, structured queries, and direct system calls within a controlled loop.
Graph becomes the knowledge engine that makes this possible. It gives agents an explicit map of the enterprise—entities, relationships, constraints, and dependencies—so they can reason, not just retrieve.
The strategic advantage
Government agencies are already networks. Treating them as such is imperative.
Graph technology provides the connective layer that turns AI into an enterprise capability—improving accuracy, reducing dead ends, and enabling AI systems to adapt as missions, operational needs, and data evolve.
The question is no longer whether your organization is interconnected. It’s whether your AI can see those connections clearly enough to generate actionable information.
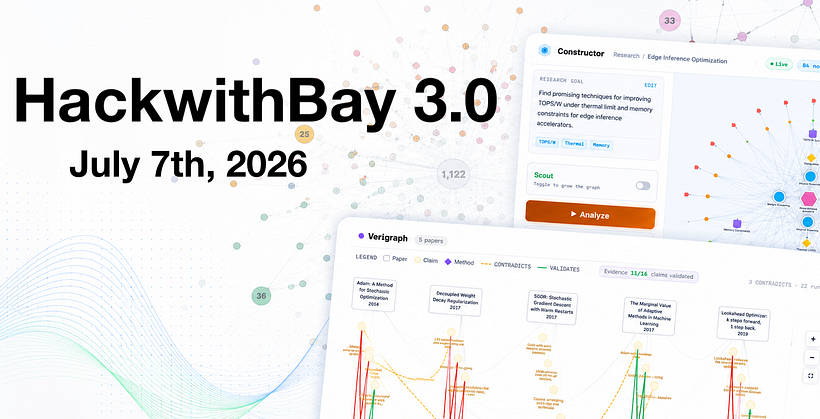
Accelerate mission outcomes
This guide shows how government agencies transform siloed data into real-time, trusted insights. learn how graph technology outperforms traditional databases.
Share Article


Explore
Related Articles
Connected Intelligence: Operationalizing Production-Grade Graph Solutions Across Enterprise Networks