Graph algorithms are well regarded for providing better recommendations to customers, solving supply chain problems in manufacturing and distribution, and detecting fraudulent transactions or insurance claims. In this blog, we will combine a graph algorithm with Graph Machine Learning (GraphML, for short) to take prediction capabilities to the next level.
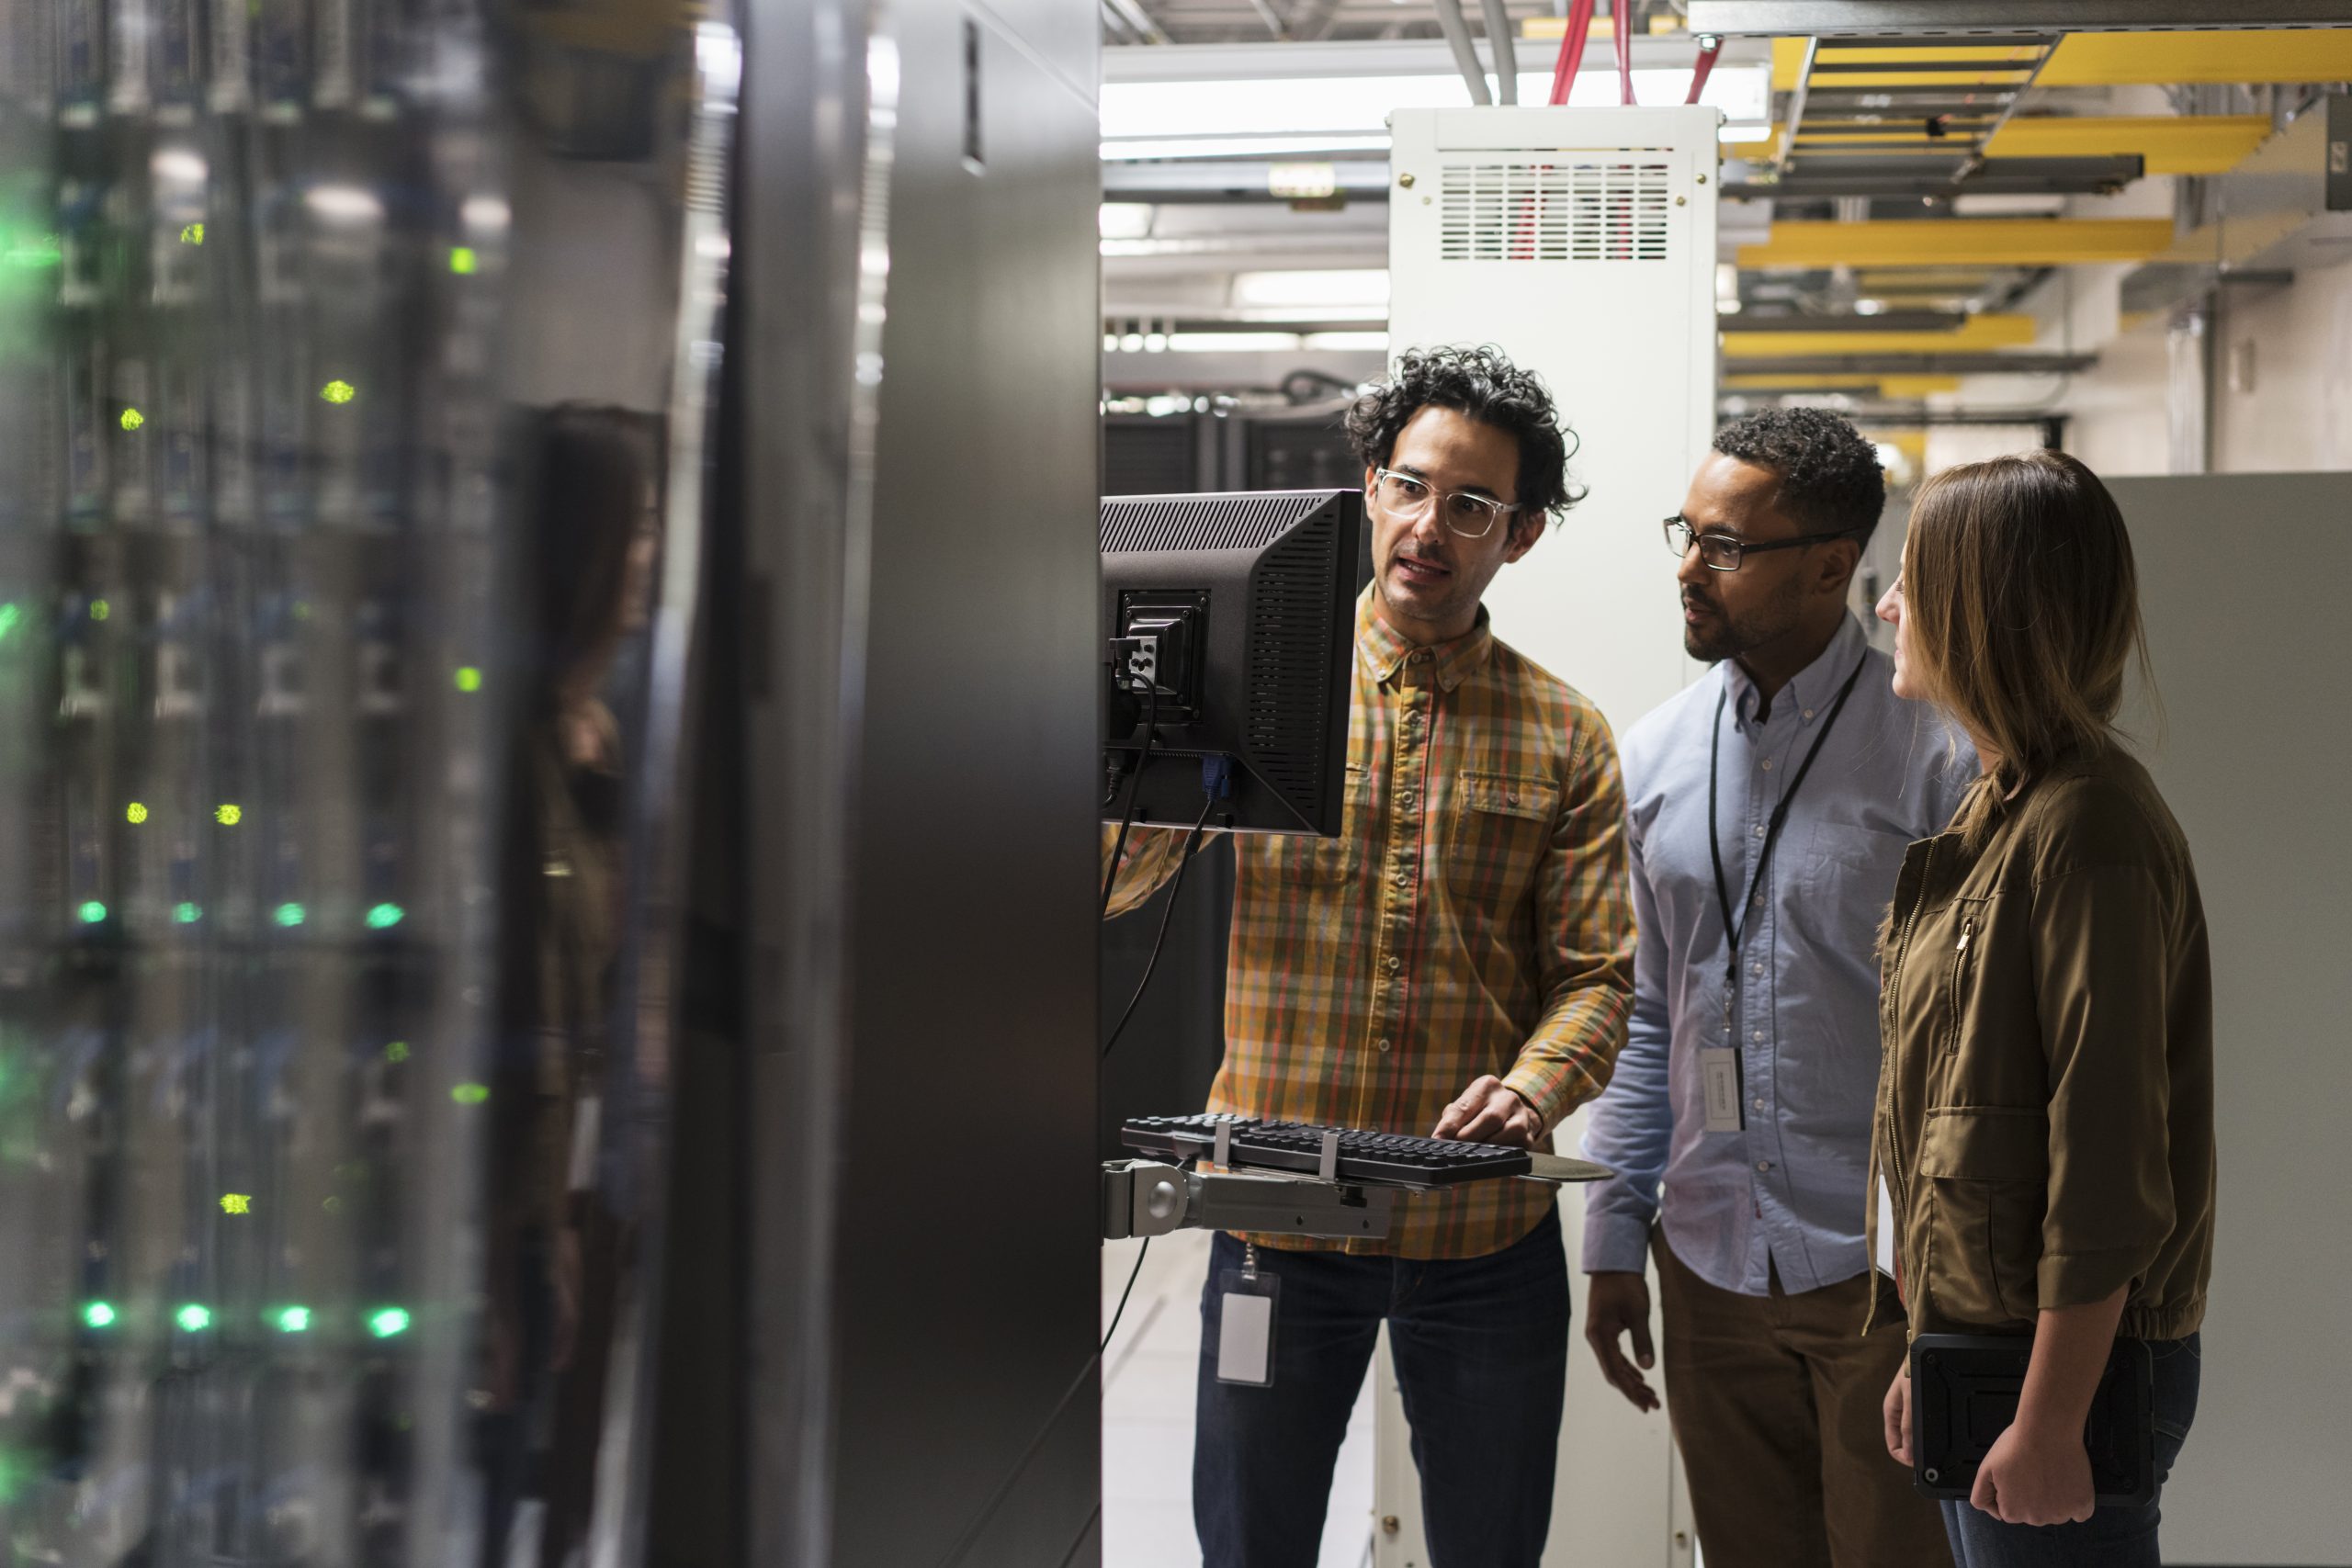
Olga Razvenskaia and I explain how to spot attacks, i.e., intrusions, in an Internet of Things (IoT) network using the K-Nearest Neighbours (KNN) graph algorithm and GraphSAGE in GraphML. Using Neo4j Graph Analytics for Snowflake, we can do this while your data remains securely in the Snowflake enclave.
Special Thanks
I want to give a huge shout-out to the authors of the academic paper “Optimizing IoT Intrusion Detection — A Graph Neural Network Approach with Attribute-Based Graph Construction”. Tien Ngo, Jiao Yin, Yong-Feng Ge, Hua Wang proved the effectiveness of this approach in the Special Issue Data Privacy Protection in the Internet of Things.
It was their thorough research at the Institute for Sustainable Industries and Liveable Cities, Victoria University, Australia, that inspired this blog.
Gratitude also goes to Mohanad Sarhan, Siamak Layeghy, and Marius Portmann, the curators of the underlying data set, who kindly granted us permission to use it in our blog. Good public data sets are hard to find, so we really appreciate the great work at the University of Queensland, Australia.
Why graph, and why KNN and GraphSAGE?
Tien Ngo, Jiao Yin, Yong-Feng Ge, and Hua Wang’s own words explain the challenges with traditional models best and how their approach solves the business problem.

Highlights from the paper’s abstract
“complexity and heterogeneity of the Internet of Things (IoT) ecosystem present significant challenges for developing effective intrusion detection systems. …
existing approaches primarily construct graphs based on physical network connections which may not effectively capture node representations…. (Ed. this is also why relational databases arent suitable.)
Instead of relying on physical links, the TKSGF constructs graphs based on Top-K attribute similarity (Ed. find the most similar), ensuring a more meaningful representation of node relationships…
maintaining scalability. Furthermore, we conducted extensive experiments to analyze the impact of graph directionality (directed vs. undirected), different K values, and various GNN architectures and configurations on detection performance….
benchmark demonstrated that our proposed framework consistently outperformed traditional machine learning methods “
K-Nearest Neighbour (KNN) is a simple, fast, supervised machine learning method that can be used to classify data. KNN works by identifying labelled data points (intrusions) that are closest to a new, unlabeled data point, which could be a benign or malicious event. The algorithm creates relationships for classification.
You could use KNN to classify inventory, insurance claims or customers who interact with your services. For intrusion detection, we will create a series of relationships among the most similar intrusion events. Because KNN is a “lazy learner”, it computes the predictions as it goes and does not store the resulting model.
GraphSAGE (Graph Sample and Aggregated) is different to most graph algorithms. It’s an inductive learning* model that generates embeddings by sampling and aggregating features from the surrounding structure of the graph. This approach captures the chain of events that lead to the system’s compromise. Since events are labelled as attacks (see below), we can run supervised machine learning. Unlike KNN, GraphSAGE stores the resulting model, which you can then use for prediction time and time again.
*Inductive learning derives general rules, patterns, or principles from specific observations, data points, or examples.
Note: Neo4j’s GraphSAGE implementation, which uses the Python runtime to perform
- Unsupervised learning, for when you don’t have labelled data.
- Semi-supervised machine learning, where you have a mix of labelled and unlabelled data.
What do you need to follow along
- Snowflake account (including free accounts).
- Neo4j Graph Analytics for Snowflake — a native application that runs in your Snowflake account — comes with a 30-day free trial.
- CPU (CPU_X64_L) and GPU (GPU_NV_S) instances in Snowflake’s Snowpark Container Services (SPCS. GPUs are optional; you can use the less powerful and therefore slower X64 CPU instances.
- IoT-BoT-data downloaded from here, the data preparation scripts are provided below.
Anatomy of the source data set
- Number of nodes in the network: 0.6M nodes: IP addresses of the devices, protocols, ports, L7 devices.
- Relationships: source data set contains zero, KNN creates 5.4M relationships for use with GraphSAGE.
Attacks
- Benign event – A legitimate network event, not classified as a form of attack.
- Reconnaissance — A technique for gathering information about a network host, also known as a probe.
- DDoS — Distributed Denial of Service — is an attempt similar to DoS, but with multiple distributed sources.
- DoS — Prevents access to a system or its data by overloading the system’s resources.
- Theft — A group of attacks that aims to obtain sensitive data, such as data theft and keylogging.
Features
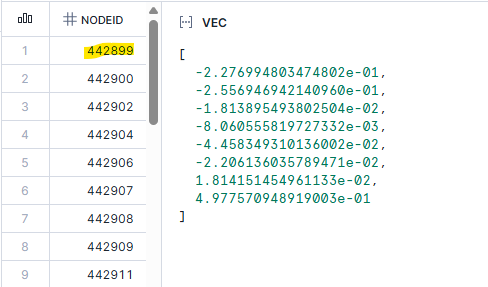
The model encodes the data in the IOT table as an 8-dimensional vector, with a float per feature. This enables us to use cosine to measure the distance (or difference) between the data points.
- PROTOCOL — IP protocol identifier byte
- L7_PROTO — Layer 7 protocol (numeric)
- IN_BYTES — Incoming number of bytes
- OUT_BYTES — Outgoing number of bytes
- IN_PKTS — Incoming number of packets
- OUT_PKTS — Outgoing number of packets
- TCP_FLAGS — Cumulative of all TCP flags
- FLOW_DURATION_MILLISECONDS — Flow duration in milliseconds

Step 1: Data preparation, scaling data
Download the IoT-BoT-data from here, upload it to a stage in Snowflake and copy it into a database table, e.g. NETFLOWDATASET.DATA.NF_BOT_IOT. The row_id is a unique identifier for a “connection event”, i.e., the node in the graph. The Rand function is used to split the data into training and test sets.
CREATE OR REPLACE TABLE NF_BOT_IOT_PREP AS
SELECT
    ROW_NUMBER() OVER (ORDER BY FLOW_DURATION_MILLISECONDS) AS ROW_ID,
    *,
    UNIFORM(0,1,RANDOM()) AS RAND
FROM NF_BOT_IOT;

CREATE OR REPLACE TABLE IOT_TRAIN_RAW AS
SELECT *
FROM NF_BOT_IOT_PREP
WHERE RAND <= 0.7;

CREATE OR REPLACE TABLE IOT_TEST_RAW AS
SELECT *
FROM NF_BOT_IOT_PREP
WHERE RAND > 0.7;

CREATE OR REPLACE TABLE IOT_SCALER_STATS AS
SELECT
    AVG(PROTOCOL) AS PROTOCOL_MEAN,
    STDDEV(PROTOCOL) AS PROTOCOL_STD,

    AVG(L7_PROTO) AS L7_PROTO_MEAN,
    STDDEV(L7_PROTO) AS L7_PROTO_STD,

    AVG(IN_BYTES) AS IN_BYTES_MEAN,
    STDDEV(IN_BYTES) AS IN_BYTES_STD,

    AVG(OUT_BYTES) AS OUT_BYTES_MEAN,
    STDDEV(OUT_BYTES) AS OUT_BYTES_STD,

    AVG(IN_PKTS) AS IN_PKTS_MEAN,
    STDDEV(IN_PKTS) AS IN_PKTS_STD,

    AVG(OUT_PKTS) AS OUT_PKTS_MEAN,
    STDDEV(OUT_PKTS) AS OUT_PKTS_STD,

    AVG(TCP_FLAGS) AS TCP_FLAGS_MEAN,
    STDDEV(TCP_FLAGS) AS TCP_FLAGS_STD,

    AVG(FLOW_DURATION_MILLISECONDS) AS FLOW_DURATION_MILLISECONDS_MEAN,
    STDDEV(FLOW_DURATION_MILLISECONDS) AS FLOW_DURATION_MILLISECONDS_STD

FROM IOT_TRAIN_RAW;

CREATE OR REPLACE TABLE IOT_TRAIN_DATASET AS
SELECT
    f.ROW_ID,

    (f.PROTOCOL - s.PROTOCOL_MEAN) / s.PROTOCOL_STD AS PROTOCOL,
    (f.L7_PROTO - s.L7_PROTO_MEAN) / s.L7_PROTO_STD AS L7_PROTO,
    (f.IN_BYTES - s.IN_BYTES_MEAN) / s.IN_BYTES_STD AS IN_BYTES,
    (f.OUT_BYTES - s.OUT_BYTES_MEAN) / s.OUT_BYTES_STD AS OUT_BYTES,
    (f.IN_PKTS - s.IN_PKTS_MEAN) / s.IN_PKTS_STD AS IN_PKTS,
    (f.OUT_PKTS - s.OUT_PKTS_MEAN) / s.OUT_PKTS_STD AS OUT_PKTS,
    (f.TCP_FLAGS - s.TCP_FLAGS_MEAN) / s.TCP_FLAGS_STD AS TCP_FLAGS,
    (f.FLOW_DURATION_MILLISECONDS - s.FLOW_DURATION_MILLISECONDS_MEAN)
        / s.FLOW_DURATION_MILLISECONDS_STD AS FLOW_DURATION_MILLISECONDS,

    f.LABEL

FROM IOT_TRAIN_RAW f
         CROSS JOIN IOT_SCALER_STATS s;
Next, create the unlabelled data set
create or replace table IOT_CONNECTIONS_NO_LABEL as
SELECT
    ROW_ID as NODEID,
    ARRAY_CONSTRUCT(
            PROTOCOL::FLOAT,
            L7_PROTO::FLOAT,
            IN_BYTES::FLOAT,
            OUT_BYTES::FLOAT,
            IN_PKTS::FLOAT,
            OUT_PKTS::FLOAT,
            TCP_FLAGS::FLOAT,
            FLOW_DURATION_MILLISECONDS::FLOAT
    ) as VEC
from IOT_TRAIN_DATASET
union all
SELECT
    ROW_ID as NODEID,
    ARRAY_CONSTRUCT(
            PROTOCOL::FLOAT,
            L7_PROTO::FLOAT,
            IN_BYTES::FLOAT,
            OUT_BYTES::FLOAT,
            IN_PKTS::FLOAT,
            OUT_PKTS::FLOAT,
            TCP_FLAGS::FLOAT,
            FLOW_DURATION_MILLISECONDS::FLOAT
    ) as VEC
from IOT_TEST_DATASET;
Step 2: Install and configure Graph Analytics to use the data inside Snowflake
Neo4j Graph Analytics for Snowflake is available in the Snowflake Marketplace as a native application that runs on Snowpark Container Services (SPCS). It installs a series of compute pools, enabling you to use the size that best suits the data set. Use the estimation procedure to identify a suitable compute pool. The application provides a set of procedures to run an algorithm over data from your Snowflake tables and write the results to new tables.

Once you have installed, granted and activated the application, click launch and run the grants below so it can read and write to the database tables.
Note: The following assumes you kept the application’s default name during installation.
USE ROLE ACCOUNTADMIN;

-- Create a consumer role for users of the Graph Analytics application
CREATE ROLE IF NOT EXISTS GRAPH_USER_ROLE;
GRANT APPLICATION ROLE NEO4J_GRAPH_ANALYTICS.app_user TO ROLE GRAPH_USER_ROLE;
SET MY_USER = (SELECT CURRENT_USER());
GRANT ROLE GRAPH_USER_ROLE TO USER IDENTIFIER($MY_USER);

-- Grants needed for the app to read consumer data stored in tables and views, using a database role
USE DATABASE netflowdataset;
CREATE DATABASE ROLE IF NOT EXISTS GRAPH_DB_ROLE;
GRANT USAGE ON SCHEMA netflowdataset.data TO DATABASE ROLE GRAPH_DB_ROLE;
GRANT SELECT ON ALL TABLES IN SCHEMA netflowdataset.data TO DATABASE ROLE GRAPH_DB_ROLE;
GRANT SELECT ON ALL VIEWS IN SCHEMA netflowdataset.data TO DATABASE ROLE GRAPH_DB_ROLE;
-- Future tables also include tables that are created by the application itself.
-- This is useful as many use-cases require running algorithms in a sequence and using the output of a prior algorithm as input.
GRANT SELECT ON FUTURE TABLES IN SCHEMA netflowdataset.data TO DATABASE ROLE GRAPH_DB_ROLE;
GRANT SELECT ON FUTURE VIEWS IN SCHEMA netflowdataset.data TO DATABASE ROLE GRAPH_DB_ROLE;
GRANT CREATE TABLE ON SCHEMA netflowdataset.data TO DATABASE ROLE GRAPH_DB_ROLE;
GRANT CREATE VIEW ON SCHEMA netflowdataset.data TO DATABASE ROLE GRAPH_DB_ROLE;
GRANT DATABASE ROLE GRAPH_DB_ROLE TO APPLICATION NEO4J_GRAPH_ANALYTICS;
GRANT DATABASE ROLE GRAPH_DB_ROLE TO role GRAPH_USER_ROLE;

-- Ensure the consumer role has access to tables created by the application
GRANT USAGE ON DATABASE netflowdataset TO ROLE GRAPH_USER_ROLE;
GRANT USAGE ON SCHEMA netflowdataset.data TO ROLE GRAPH_USER_ROLE;
GRANT SELECT ON FUTURE TABLES IN SCHEMA netflowdataset.data TO ROLE GRAPH_USER_ROLE;

use role accountadmin;
GRANT USAGE ON WAREHOUSE DEFAULT_WH TO ROLE GRAPH_USER_ROLE;
GRANT USAGE ON WAREHOUSE DEFAULT_WH TO APPLICATION NEO4J_GRAPH_ANALYTICS;
Step 3: Train & Test the Model on Snowflake GPUs
We treat every row in the original dataset as a connection event. We use KNN to determine similarity between pairs of events stored as vectors.
Instead of relying on physical links, the TKSGF constructs graphs based on Top-K attribute similarity, ensuring a more meaningful representation of node relationships
The system connects nodes if their cosine similarity exceeds 0.8 (similarityCutoff: 0.8). It limits each node to a maximum of 9 connections (topK: 9). By using a sampleRate of 0.5 (the default), the system checks only 50% of all possible pairs for every node. This improves the runtime of the algorithm without impacting the quality of the results.
Neo4j Graph Analytics for Snowflake enables us to run these complex algorithms directly where the data lives — inside Snowflake. When you run KNN, the system projects the data into memory within the Large X64 SPCS instance and writes the results to the REL_IS_SIMILAR table.
CALL NEO4J_GRAPH_ANALYTICS.graph.knn('CPU_X64_L', {
    'defaultTablePrefix': 'NETFLOWDATASET.data',
    'project': {
        'nodeTables': ['IOT_CONNECTIONS_NO_LABEL'],
        'relationshipTables': {}
        },
    'compute': {
        'topK': 9,
        'similarityCutoff': 0.8,
        'nodeProperties': {
            'VEC': 'COSINE'
            },
        'resultProperty': 'score',
        'resultRelationshipType': 'SIMILAR'
        },
    'write': [{
        'outputTable': 'REL_IS_SIMILAR',
        'sourceLabel': 'IOT_CONNECTIONS_NO_LABEL',
        'targetLabel': 'IOT_CONNECTIONS_NO_LABEL',
        'relationshipType': 'SIMILAR',
        'relationshipProperty': 'score'
        }]
    });
KNN run took 0m 45s to compute the similarities of 600100 nodes, and write the data back to the output table REL_IS_SIMILAR; for use with GraphSAGE.
Next, we create the connections (i.e., actual relationships) between the IoT devices. Adding a label column to the data, and converting the VEC column from an array type to a VECTOR(FLOAT,8) type.
create or replace table IOT_CONNECTIONS as
SELECT
    ROW_ID as NODEID,
    ARRAY_CONSTRUCT(
            PROTOCOL::FLOAT,
            L7_PROTO::FLOAT,
            IN_BYTES::FLOAT,
            OUT_BYTES::FLOAT,
            IN_PKTS::FLOAT,
            OUT_PKTS::FLOAT,
            TCP_FLAGS::FLOAT,
            FLOW_DURATION_MILLISECONDS::FLOAT
    )::VECTOR(FLOAT, 8) as VEC,
    LABEL::integer as label
from IOT_TRAIN_DATASET
union all
SELECT
    ROW_ID as NODEID,
    ARRAY_CONSTRUCT(
            PROTOCOL::FLOAT,
            L7_PROTO::FLOAT,
            IN_BYTES::FLOAT,
            OUT_BYTES::FLOAT,
            IN_PKTS::FLOAT,
            OUT_PKTS::FLOAT,
            TCP_FLAGS::FLOAT,
            FLOW_DURATION_MILLISECONDS::FLOAT
    )::VECTOR(FLOAT, 8) as VEC,
    NULL as label
from IOT_TEST_DATASET;
GraphSAGE is computationally intensive (essentially deep learning on graphs), we will use Snowflake’s GPU_NV_S compute pool. You can use one of the CPU instances if you don’t have access to GPUs, but it will take longer.
GraphSAGE is run with the following tables
- The node table IOT_CONNECTIONS; the labels set to NULL for the events you want to predict.
- The relationship table
REL_IS_SIMILARcreated by KNN. The REL_IS_SIMILAR connects up to 9 events num using Samples = [9,9] that meet the 0.8 cutoff.
To build a persistent model in SPCS storage called gs_tksgf_iot, using supervised machine learning and node similarity. Persisting the model to storage enables you to use it in your pipelines to make predictions whenever you want.
# Run GraphSAGE supervised training

CALL NEO4J_GRAPH_ANALYTICS.graph.gs_nc_train('GPU_NV_S', {
    'defaultTablePrefix': 'NETFLOWDATASET.data',
    'project': {
        'nodeTables': ['IOT_CONNECTIONS'],
        'relationshipTables': {
            'REL_IS_SIMILAR': {
                'sourceTable': 'IOT_CONNECTIONS',
                'targetTable': 'IOT_CONNECTIONS',
                'orientation': 'UNDIRECTED'
                }
            }
        },
    'compute': {
        'modelname': 'gs_tksgf_iot',
        'classWeights': False,
        'epochsPerVal': 1,
        'numEpochs': 50,
        'epochsPerCheckpoint': 5,
        'randomSeed': 42,
        'activation': 'relu',
        'aggregator': 'mean',
        'hiddenChannels': 32,
        'learningRate': 0.01,
        'numSamples': [9, 9],
        'dropout': 0.5,
        'layerNormalization': True,
        'splitRatios': {'TRAIN': 0.7,'VALID': 0.15,'TEST': 0.15},
        'trainBatchSize': 512,
        'evalBatchSize': 512,
        'targetLabel': 'IOT_CONNECTIONS',
        'targetProperty': 'label'
        }
    });
Our graph is composed of attacks, and relationships are formed based on their similarity to other attacks.
Note on the configuration:
splitRatios’: {‘TRAIN’: 0.70, ‘TEST’: 0.15, ‘VALID’: 0.15}.
The native app’s configuration splits the data into 70% for training, 15% for testing, and 15% for validation. This split is for measuring the training progress — this is not connected to the train/test split we introduced above.
It took about 5 Minutes to train the model, gs_tksgf_iot, which is stored within SPCS.
Note: Graph Analytics for Snowflake won’t overwrite existing models. Please refer to the ‘Model Catalog Operations’ for procedures for dropping and listing models.
Step 4: Predict on Snowflake GPUs
We can now use the trained model to predict whether an event in the test set is malicious or benign. When you start pulling operational event data from your network, you can use the model to predict whether it is under attack.
#Run GraphSAGE prediction

CALL NEO4J_GRAPH_ANALYTICS.graph.gs_nc_predict('GPU_NV_S', {
    'defaultTablePrefix': 'NETFLOWDATASET.data',
    'project': {
        'nodeTables': ['IOT_CONNECTIONS'],
        'relationshipTables': {
            'REL_IS_SIMILAR': {
                'sourceTable': 'IOT_CONNECTIONS',
                'targetTable': 'IOT_CONNECTIONS',
                'orientation': 'UNDIRECTED'
                }
            }
        },
    'compute': {
        'modelname': 'gs_tksgf_iot'
        },
    'write': [{
        'nodeLabel': 'IOT_CONNECTIONS',
        'outputTable': 'RESULT_GS_NC_PREDICT'
        }]
    });   });
It took 1m43s to make the predictions.
Step 5: Results
To calculate the prediction results and compare them with the findings in the paper.
WITH joined AS (
SELECT
g.LABEL AS actual,
p.PREDICTED_CLASS AS predicted,
TO_ARRAY(p.PREDICTED_PROBABILITIES)[1]::FLOAT AS prob_1
FROM IOT_TEST_DATASET g
JOIN RESULT_GS_NC_PREDICT p
ON g.ROW_ID = p.NODEID
),
cm AS (
SELECT
COUNT_IF(actual = 1 AND predicted = 1) AS TP,
COUNT_IF(actual = 0 AND predicted = 0) AS TN,
COUNT_IF(actual = 0 AND predicted = 1) AS FP,
COUNT_IF(actual = 1 AND predicted = 0) AS FN,
COUNT_IF(actual = 0) AS N0,
COUNT_IF(actual = 1) AS N1
FROM joined
),
metrics AS (
SELECT
TP, TN, FP, FN, N0, N1,
TP/(TP+FP) AS precision_1,
TP/(TP+FN) AS recall_1,
TN/(TN+FN) AS precision_0,
TN/(TN+FP) AS recall_0
FROM cm
),
f1_calc AS (
SELECT
*,
2*precision_1*recall_1/(precision_1+recall_1) AS f1_class1,
2*precision_0*recall_0/(precision_0+recall_0) AS f1_class0
FROM metrics
)
SELECT
TP, TN, FP, FN,
precision_1,
recall_1,
f1_class1,
f1_class0,
(f1_class0 + f1_class1) / 2 AS macro_f1,
(f1_class1 * N1 + f1_class0 * N0) / (N0 + N1) AS weighted_f1
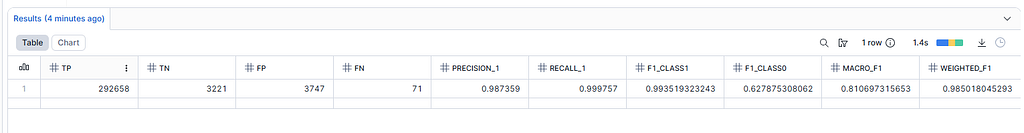
FROM f1_calc;Macro-F1 score of 0.811 reported in the results table below vs 0.821 reported in the paper. The weighted F1-score reported is 0.985 vs. 0.985 from the paper. This means we have reproduced the results in the Academic paper, validating their research and our implementation on Snowflake.
Working with models
The application creates GraphSAGE’s models in SPCS storage; the models can be managed with the following commands. Documentation available here.
-- Working with models on the stage
// check a model exists
CALL Neo4j_Graph_Analytics.graph.model_exists('gs_tksgf_iot');
// list the models
CALL Neo4j_Graph_Analytics.graph.show_models();
// drop an existing model
CALL Neo4j_Graph_Analytics.graph.drop_model('gs_tksgf_iot');
Conclusion
In this blog, Olga Razvenskaia and Stu Moore demonstrated that Neo4j Graph Analytics for Snowflake is highly effective at detecting network intrusions.
- SQL data stored in Snowflake.
- Create the entire pipeline by calling our application with only 3 SQL commands
- Run KNN on CPU.
- Train GraphSAGE on GPU-based instances.
- Predict with GraphSAGE on GPU-based instances.
- Store the results back in Snowflake.
- Validated the results in “Optimizing IoT Intrusion Detection — A Graph Neural Network Approach with Attribute-Based Graph Construction” by Tien Ngo, Jiao Yin, Yong-Feng Ge, Hua Wang.
If you want to give it a go?
Neo4j Graph Analytics for Snowflake is available in the Snowflake Marketplace and includes a 30-day free trial.
Plus, there are lots of other great examples available on GitHub and Snowflake’s Developer Guides and check out our new Product Page on Neo4j.com for more resources.
Graph Intelligence: Network Intrusion Detection with Neo4j and Snowflake was originally published in Neo4j Developer Blog on Medium, where people are continuing the conversation by highlighting and responding to this story.
Share Article


Explore
Related Articles

SumoDB in Neo4j: Chaining Multiple Graph Algorithms in Snowflake — Part 3