Precise economic policy in a world of chaos

Solutions Engineer, Neo4j
13 min read
Why the future of macro-risk is agentic and interconnected
The phone rang at 3:14 AM. For Roberto, who owns a high-volume beverage distribution firm in a bustling Commercial Hub in San Salvador, that sound usually means one of two things: a warehouse alarm went off, or his inventory is stuck.
“Don Roberto,” the voice on the other end crackled. It was his logistics lead. “The crossing at El Amatillo is backed up for miles. Protests on the Honduran side. Our shipment of soft drinks isn’t moving for at least forty-eight hours.”
In the old days, Roberto would have poured a stiff coffee and started guessing. He’d call the beverage manufacturer in Honduras to see if they could reroute. He’d check his warehouse levels for raw sugar, wondering if his supplier’s production would halt too. He’d pray the shelves in San Salvador didn’t go empty.
But this morning, Roberto didn’t guess. He opened his laptop.
Mapping the ripple: From raw sugar to the hub
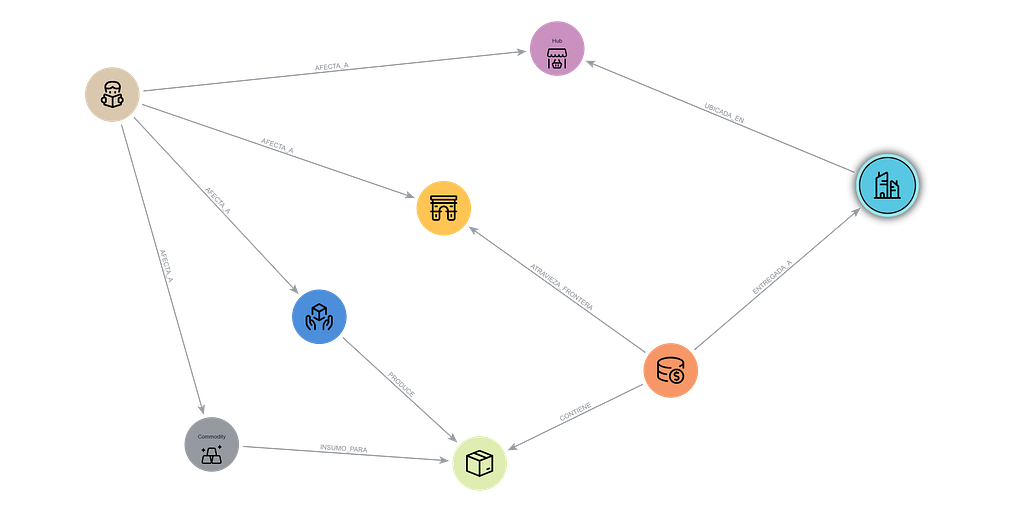
Roberto doesn’t just see a “truck.” He sees a Knowledge Graph. To him, the delay at the border isn’t a static event; it’s a node in a living web. The visual below isn’t just a map; it’s a semantic layer where the relationship is the primary data point and treats every border crossing, commercial hub, and supplier as an interconnected node.

By mapping these dependencies, the system can instantly propagate a disruption at El Amatillo (pointed at) across the entire network, transforming a mess of unstructured news, macroeconomic indicators, and logistics logs into a predictive, traversable digital twin of the Central American economy.
Take a look at the graph model below. This isn’t just a collection of nodes, it’s a blueprint of economic causality.
At the edge of the network, News Articles (tan nodes) act as the primary triggers — sentiment and events that ripple through Commodities, Suppliers, Border Crossings, or Commercial Hubs. In this ecosystem, commodities serve as the essential raw inputs for the Products that Suppliers bring to market. Businesses (light blue nodes) are anchored to specific Commercial Hubs, and the entire system culminates in a Transaction: the moment value is exchanged between a business and a supplier as a product physically traverses a Border Crossing.

When that border node turns red, the graph calculates the velocity of the disaster. Because the truck is stuck, Roberto’s inventory in San Salvador will hit “critical low” in 48 hours. But the graph shows him something deeper: the Honduran manufacturer is also running low on raw sugar due to the same bottleneck. Even if the trucks move tomorrow, the supplier’s production line is about to stall.
When we zoom out from Roberto’s warehouse, the graph reveals a much more systemic vulnerability. This isn’t just one man’s inventory problem; it’s a structural threat to the city’s commercial pulse.
In the model, Raw Sugar acts as a highly dependent node. By traversing the graph, we see that this single commodity is the lifeblood for three distinct finished goods. These three products alone power hundreds of individual transactions daily across the district.
The ripple effect terminates at seven major businesses within the San Salvador hub that depend on these goods to keep their doors open. When the sugar node is “choked” at the border, the graph doesn’t just show a delay; it calculates a synchronized downturn. If those seven businesses lose their primary products, the commercial hub sees a measurable drop in economic velocity, potentially leading to localized labor hour reductions or price hikes that affect the end consumer within days. Through the lens of the graph, a single stalled truck at El Amatillo is directly linked to the empty shelves of seven different retailers in the heart of the capital.

Agentic synthesis: Autonomous intelligence in the graph
Moving from a static map to a predictive engine requires more than just data; it requires an Agentic Framework that understands the specific context of each economic entity. Instead of a single AI trying to solve everything, we deploy a squad of specialized domain agents that act as the digital eyes of the network.
Each agent is primed with a specific mission and a set of Relationships that define how they interact with incoming information:
- The Border Crossing Agent: Monitors news for civil unrest, weather alerts, or administrative strikes at specific transit points.
- The Provider Agent: Scans for corporate news, labor disputes, or manufacturing delays. It connects news about a parent company to a subsidiary supplier.
- The Commodity Agent: Watches global markets and environmental reports. It knows that a drought in the region isn’t just “weather”, it’s a future shortage of the raw sugar needed for production.
- The Commercial Hub Agent: Focused on the “last mile.” It monitors local municipal news in San Salvador, such as road closures or power grid failures that could stall distribution.
Here is the sample code for the commodity agent. Notice how we first find all news nodes with a relationship to a commodity node, then traverse the graph.
commodity_risk_traversal_query = """
        MATCH (n:Noticia)-[:AFECTA_A]->(c:Commodity)
        WITH score, c, n
        MATCH (c)-[:INSUMO_PARA]->(p:Producto)<-[:CONTIENE]-(t:Transaccion)-[:ENTREGADA_A]-(e:Empresa)
        RETURN
        n.texto AS news_content,
        n.severidad as severity,
        n.titulo as headline,
        c.nombre as commodity,
        collect(p.descripcion) as ProductsImpacted,
        count(distinct e.id) AS businessesImpacted,
        sum(distinct t.valorUSD) as dollarImpact,
        score AS SimilarityScore,
        elementId(n) AS Metadata_ID
"""

commodity_retriever = VectorCypherRetriever(
    driver,
    index_name="news_vector_index",
    embedder=embedder,
    retrieval_query=commodity_risk_traversal_query
)
The result of this traversal is then used as context for the agent to reason and provide an answer. Here is a sample code using OpenAI
response = embedding_client.chat.completions.create(
        model="gpt-4o",
        messages=[
            {"role": "system", "content": prompts[risk_type]},
            {"role": "user", "content": f"Analyze these news alerts for risk:\n\n{news_context} Indicate dollar amount, product, and business impact"}
        ],
        temperature=0
    )
And here is a visual representation of that context: it begins with a News node (the external trigger) linked to a Commodity (the raw input). That commodity is mapped to a Product, which serves as the anchor for one ore more Transactions, ultimately terminating at Businesses within a commercial hub.

Ultimately, when Roberto prompts the Commodity Agent to filter for specific high-signal events , like a transport strike or a harvest failure, he isn’t just getting a list of headlines. He’s getting a weighted impact analysis. Because the agent understands the graph’s topology, it doesn’t just find the news, it identifies the specific “dependency path” from the strike to his bottom line, providing an answer that is as strategically sound as it is technically precise.
Based on the news alerts provided, here is an analysis of the potential risk and price volatility for the impacted commodities:

1. **Hard Red Winter Wheat (ZW)**
   - **Headline:** Geopolitical Tensions Impact ZW Pricing
   - **Severity:** High
   - **Dollar Impact:** $815,754.97
   - **Products Impacted:** Wheat Flour, Sweet Biscuits
   - **Business Impact:** No specific businesses mentioned as impacted.
   - **Analysis:** The uncertainty in international markets has led to speculative buying, which is destabilizing local costs. This could lead to increased price volatility for products derived from Hard Red Winter Wheat, such as wheat flour and sweet biscuits. The geopolitical tensions are likely to cause fluctuations in supply and demand, impacting prices.

2. **Corn (Maize) (ZC)**
   - **Headline:** Logistics Crisis at ZC Infrastructure
   - **Severity:** High
   - **Dollar Impact:** $1,065,036.03
   - **Products Impacted:** Carbonated Soft Drinks, Poultry Meat
   - **Business Impact:** No specific businesses mentioned as impacted.
   - **Analysis:** The breakdown in specialized transport systems has left cargo stranded, which could lead to supply chain disruptions. This is likely to cause short-term price increases and volatility for corn-based products, including carbonated soft drinks and poultry meat, as supply becomes constrained.

3. **Raw Sugar (SB)**
   - **Headline:** Transport Strike Targets SB Carriers
   - **Severity:** High
   - **Dollar Impact:** $1,543,928.18
   - **Products Impacted:** Carbonated Soft Drinks, Sweet Biscuits, Cane Sugar
   - **Business Impact:** No specific businesses mentioned as impacted.
   - **Analysis:** The strike by trucking unions demanding higher insurance coverage is likely to disrupt the transportation of raw sugar. This could lead to supply shortages and increased costs for products containing sugar, such as carbonated soft drinks, sweet biscuits, and cane sugar. The strike may result in significant price volatility until the issue is resolved.

Overall, the high severity of these events suggests a substantial risk of price volatility for the affected commodities and their derivative products. Businesses involved in the production or sale of these products should prepare for potential cost increases and supply chain disruptions.
Notice the difference when asking the Border Agent for news that mention strikes, delays, or closures
The news alerts indicate significant disruptions at various Aduana facilities, each with varying degrees of severity and impact on border crossings and transactions. Here's an analysis of the potential risks and impacts:

1. **Aduana La Hachadura Facility Explosion**
   - **Severity:** Critical
   - **Impact:** The indefinite shutdown of this key site due to an explosion will severely disrupt the handling and processing of goods. This will likely lead to delays in border crossings and transactions for the affected products.
   - **Dollar Amount:** $934,019.55
   - **Products Impacted:** Sweet Biscuits, Cane Sugar, Cement Clinkers, Portland Cement, Wheat Flour, Ethyl Alcohol (Ethanol), Poultry Meat
   - **Number of Businesses Impacted:** 7

2. **Aduana San Cristóbal Flooding**
   - **Severity:** High
   - **Impact:** The destruction of storage facilities due to flooding will cause significant supply chain disruptions and potential shortages in the region. This could lead to increased prices and delays in transactions.
   - **Dollar Amount:** $975,010.44
   - **Products Impacted:** Cane Sugar, Poultry Meat, Sweet Biscuits, Wheat Flour, Cement Clinkers, Portland Cement, Ethyl Alcohol (Ethanol)
   - **Number of Businesses Impacted:** 7

3. **Aduana Anguiatú Warehouse Fire**
   - **Severity:** Medium
   - **Impact:** The fire has destroyed a major distribution center, affecting the supply of several products. This will likely result in temporary shortages and increased costs for businesses relying on these supplies.
   - **Dollar Amount:** $1,140,795.04
   - **Products Impacted:** Portland Cement, Sweet Biscuits, Cement Clinkers, Poultry Meat, Ethyl Alcohol (Ethanol), Cane Sugar, Wheat Flour
   - **Number of Businesses Impacted:** 6

Overall, these events pose significant risks to border crossings and transactions, with potential delays, increased costs, and market instability. Businesses involved in the affected products should prepare for disruptions and consider alternative supply chain strategies.

border_risk_traversal_query = """
MATCH (n:Noticia)-[:AFECTA_A]->(c:Frontera)
WITH c, n
MATCH (c)<-[:ATRAVIEZA_FRONTERA]-(t:Transaccion)
MATCH (t)-[:CONTIENE]->(p:Producto)
MATCH (t)-[:ENTREGADA_A]->(e:Empresa)
RETURN n.texto AS news_content,
        n.severidad as severity,
        n.titulo as headline,
        collect(distinct p.descripcion) as Products,
        count(distinct e) AS BusinessCount,
        sum(distinct t.valorUSD) as DollarAmount
"""
Beyond the individual warehouse, the true breakthrough lies in the Hidden Risk Agent, a high-level supervisor designed for macroeconomic oversight. While Roberto focuses on his soda, this agent treats the entire graph as its context, scanning for structural fragility that no human analyst could spot. It doesn’t just wait for a strike; it identifies hidden dependencies , like a single bridge in Guatemala that, if closed, would halt 40% of all beverage transactions in San Salvador. For a Minister of Economy or a central banker, this is the ultimate policy tool. It transforms risk mitigation from a game of whack-a-mole into precise strategy, allowing leaders to fortify the specific nodes (commodities, border crossings, suppliers) that hold the entire regional economy together. By the time a crisis hits the news, the policy response has already been simulated, tested, and deployed.
Here is one last example using the Hidden Risk Agent to look for risks in the textile industry
hidden_risk_query = """
  MATCH (n:Noticia)-[:AFECTA_A]->(direct_entity)
  OPTIONAL MATCH (direct_entity)-[:INSUMO_PARA|PRODUCE|CONTIENE|UBICADA_EN*1..2]-(hidden_target)
  WHERE hidden_target <> direct_entity
  WITH n, direct_entity, hidden_target, labels(hidden_target)[0] as type
  RETURN
    n.titulo AS NewsHeadline,
    direct_entity.nombre AS DirectImpact,
    collect(DISTINCT {
        entity: hidden_target.nombre,
        type: type,
        risk_chain: labels(direct_entity)[0] + ' -> ' + type
    }) AS HiddenDependencies,
    count(DISTINCT hidden_target) AS TotalHiddenEntities
"""

The disruptions in the textile commodity sector are highlighted by
the news of a speculative bubble bursting for Gildan Activewear.
This incident directly impacts Gildan Activewear and is associated
with hidden dependencies related to products, transactions, and commodities,
specifically Upland Cotton.

The situation may lead to broader implications for the textile industry,
affecting supply chains and pricing.
From business survival to national strategy: A tool for economic policy
Traditional economic policy is often like steering a massive tanker by looking at the wake behind it. You see the GDP dip after the quarter ends. You feel the inflation after the prices have already spiked. A knowledge graph changes the temporal nature of governance from reactive to predictive.
By leveraging the graph, policymakers can move beyond broad, “blunt-force” interventions, as mentioned above, and instead utilize precise strategy application:
- Precision Infrastructure: Instead of general road funding, the graph identifies which specific border crossings or commercial hubs are “single points of failure” for the highest volume of downstream transactions. Policy follows the path of maximum economic impact.
- Tariff Impact Modeling: Before a trade agreement is signed, the graph can simulate the “Blast Radius” of a new tariff. It identifies exactly which domestic businesses will face higher input costs allowing the government to negotiate exemptions or prepare targeted relief before the shock hits.
- War and Geopolitical Stress Tests: By adding a “News Article” node representing a global conflict into the model, the graph maps how a disruption in Baltic grain or Middle Eastern energy cascades through local suppliers and commodities, surfacing hidden vulnerabilities in national food or energy security.
Precise Economic Policy in a World of Chaos was originally published in Neo4j Developer Blog on Medium, where people are continuing the conversation by highlighting and responding to this story.
Share Article


Explore
Related Articles


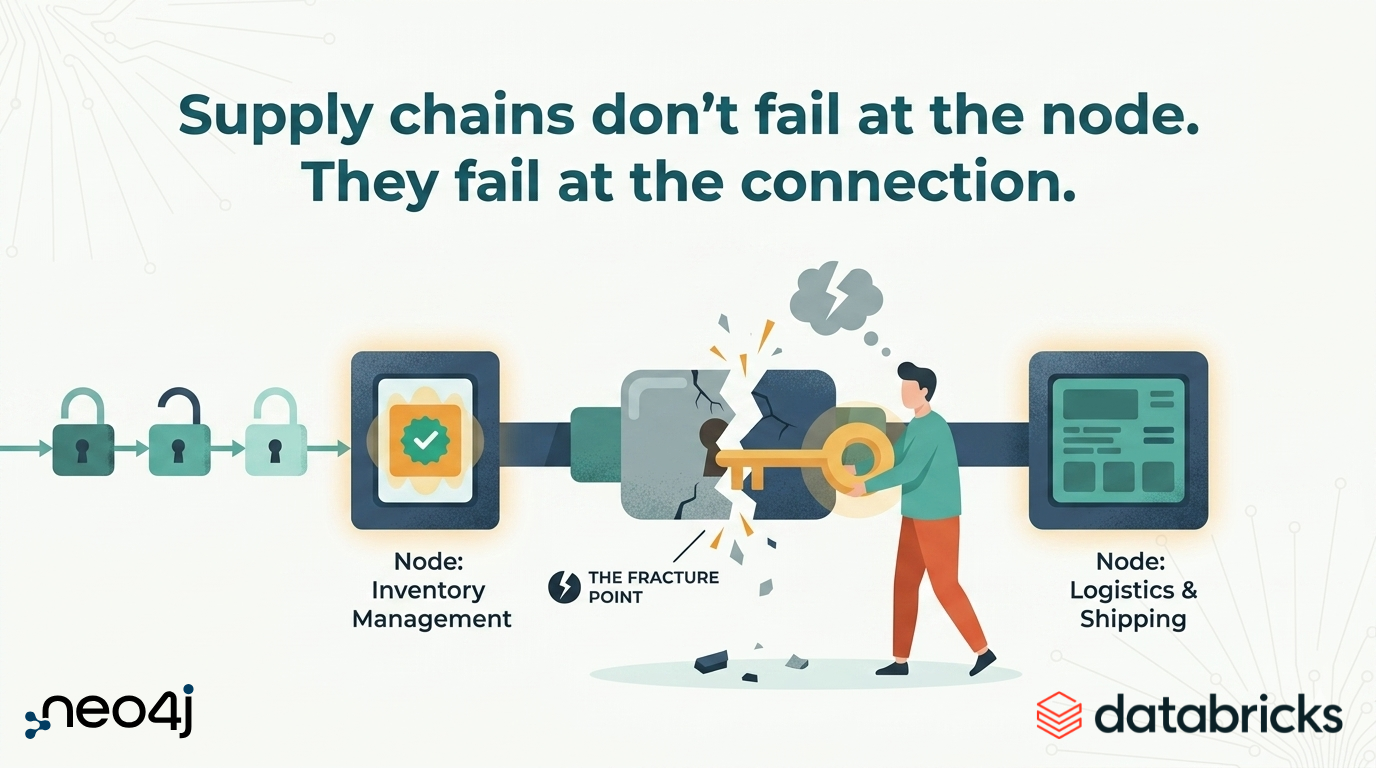
Supply chains don’t fail at the node. They fail at the connection.

SumoDB in Neo4j: Chaining Multiple Graph Algorithms in Snowflake — Part 3