Editor’s Note: This presentation was given by Mark Kvamme and Clark Richey at GraphConnect San Francisco in October 2016.
Presentation Summary
Enterprises are faced with a variety of challenges when it comes to managing data, largely due to the disparate storage of a data in aging infrastructure. This results in companies using huge amount of resources — personnel, time, hardware and money — bringing this data together in an attempt to glean insights.
By creating a DataFabric using tools such as the Neo4j graph database, enterprises are able to transform into dynamic, scalable and modern enterprises. With FactGem, you can start on Neo4j immediately — just load your data into Neo4j and build an application.
Full Presentation: The Emergence of Enterprise DataFabric
What we’re going to be talking about today is the best way to introduce graphs to enterprises, and all the typical enterprise challenges graphs can solve:
Enterprise Data Challenges
Mark Kvamme: Big data is becoming a challenge for enterprises for a variety of reasons. Often it’s stored in a variety of places in old, complex structures that make it difficult to glean data insights.
Take the company Procter & Gamble as an example. They have 4,200 business analysts pulling data from their databases into Excel or Microsoft Access to analyze the data and deliver insights. But this can take months to do, which simply isn’t good enough for today’s dynamic world. The goal is to obtain insights as quickly as possible:
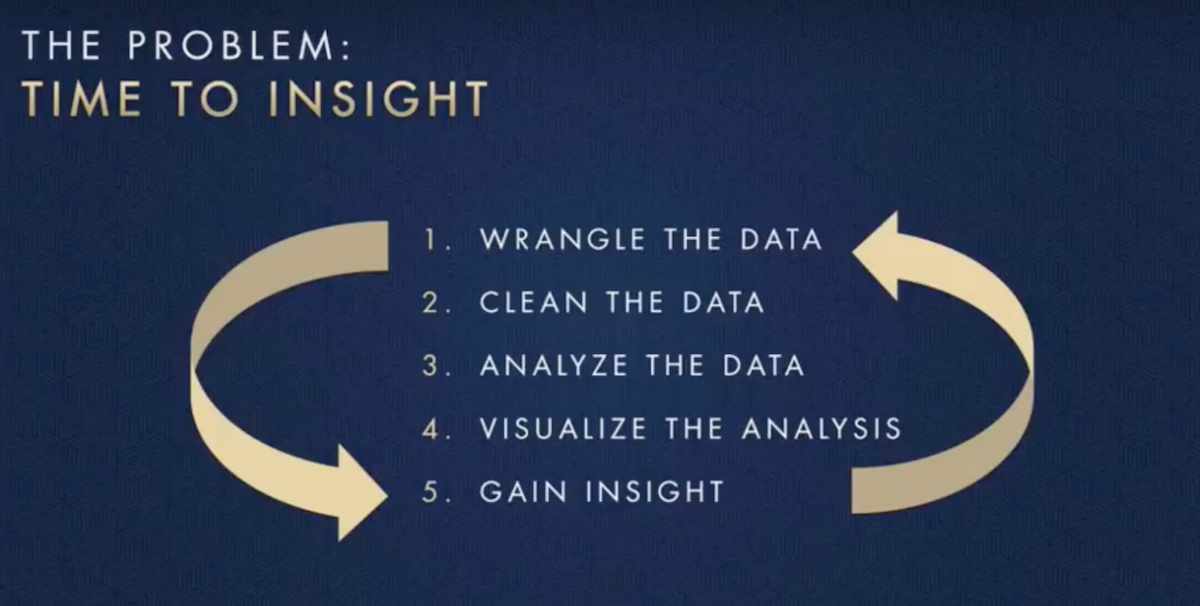
Data science is one of the new fields emerging in enterprises. It didn’t exist in this context even five years ago, but now it’s one of the fastest growing roles in corporate America. Unfortunately, because of the way many companies store their data, these data scientists can spend as much as 85 to 90% of their time wrangling data.
They often have to pull information together from a number of different places; analyze the data with tools such as Excel, Python and R; and manually create data visualizations. After presenting to executive leadership, they are often tasked with the same process but asked to explore different insights. They have to go back to the data, re-analyze everything and present new insights a few weeks later — an extremely inefficient process.
The other day I visited a FactGem customer, and there were three floors of people in rows of cubes with only one job: to query data warehouses and databases and dump the data into Excel.
Clark Richey: I talk to people about graphs and how you can bring your data together to solve these complex problems, but what I hear all the time is, “We have too much data. We can’t do that.”
The great irony is that relational databases are terrible with relationships. But all data is inherently related. Relationships matter, and relational databases just don’t get you there.
After about three JOINs, you’re dead in the water. And even though there is a bunch of great technology out there like HDFS (Hadoop), which is a great storage technology, it’s not a database or an an accessible analytical tool. It still requires talented engineers running complex query languages and doesn’t scale well for companies.
Given all of these options — why Neo4j? After all, every 15 years or so, some new technology comes out — like RDF triple stores. We heard that it was going to solve all our problems and finally be the Semantic Web, but that never happened.
And unfortunately it’s never going to happen because it’s a non-property-based graph that doesn’t scale, and also requires a programming language — SPARQL — that is incredibly unwieldy. And who wouldn’t rather work with Cypher?
And then there are other technologies out there that only apply a thin veneer of graph on top of something like Cassandra or an RDBMS database. But putting a graph layer on top of an RDBMS database doesn’t provide scalability or relationships. Only Neo4j has that pure property graph that let’s you solve these problems.
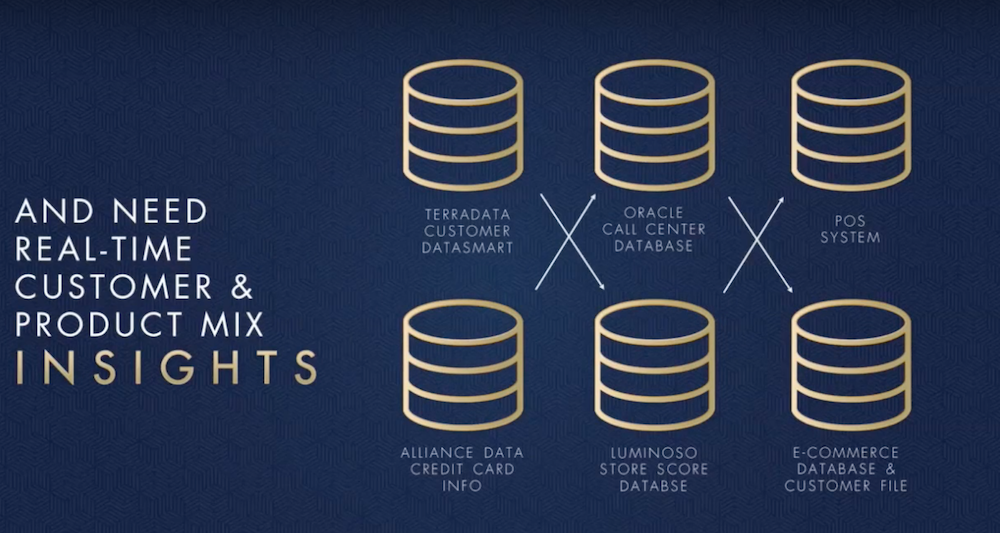
Kvamme: Every business has unique data, but their data architecture — and challenges — ends up being very similar. I was in London the other week talking to IT specialists from a number of different companies, and they each had this big piece of graph paper showing the connections between all of their different systems – including Salesforce, Oracle and POS systems. But it was in a huge jumble — like a bunch of spaghetti. We built the below to organize and demonstrate this complexity:
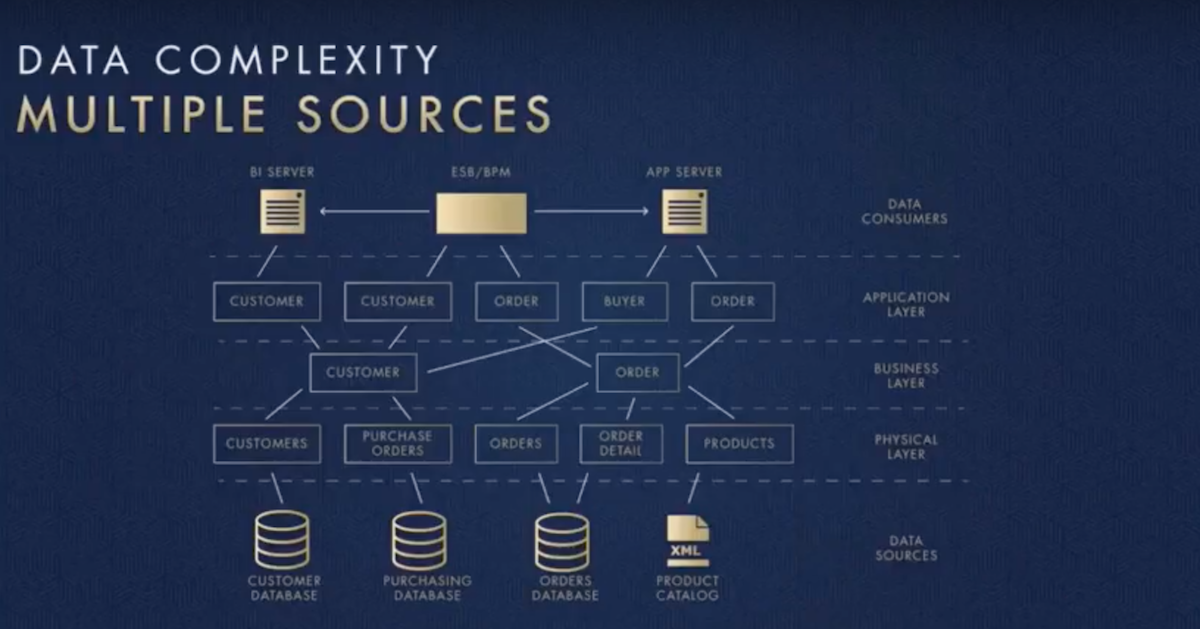
The challenges of a Fortune 500 company are very, very different. Most of these companies have been around for decades, so they have important applications sitting in all kinds of databases like Oracle, MySQL and COBOLT. Below is an example from a company that has their data stored across six different databases:
They wanted to bring this information together as quickly as possible, but the only way they were able to do so was in the way we already described: manually pulling together all of the data and searching for insights.
The main reason you can’t pull all of this data together in a SQL database is because it doesn’t handle relationships well. Once you end up with more than two JOINs, the system just doesn’t operate quickly enough. And the way people try to solve this problem is with time, people and hardware.
A lot of it:
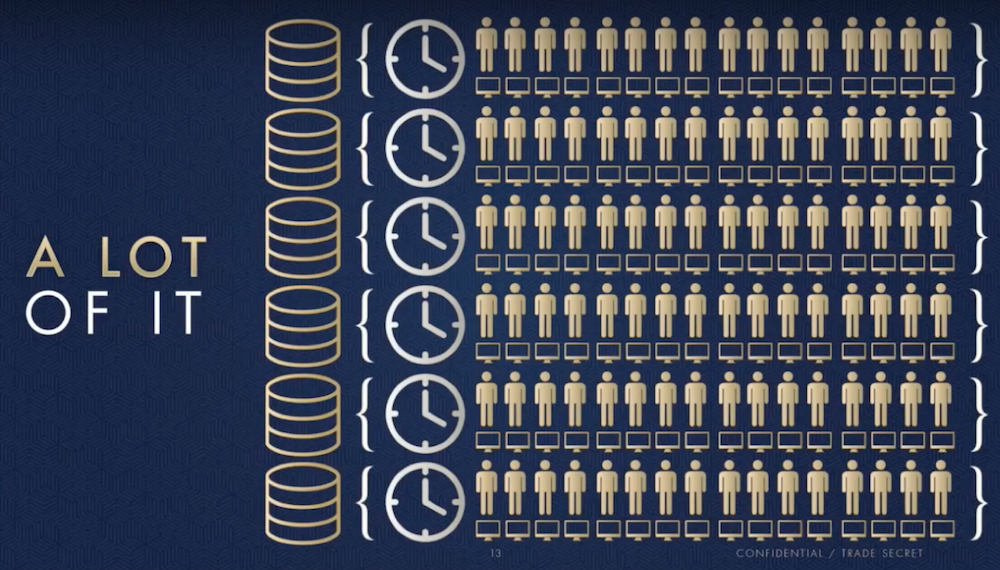
We work with a company in Columbus, Ohio that has 600 people performing business data analytics using the inefficient method mentioned above. Not only does this require more people; it requires more hardware and time, which in combination impact a company’s bottom line. We even have one device team with half of their 900 person IT department on the phone all day trying to coordinate the connection of data. It’s clear that this process needs to be refined so that we can transform these companies into scalable, modern enterprises.
And even though many of these enterprises have a huge amount of resources, their solutions can only be scaled so far. Analyzing data through traditional JOINs is simply not possible when you have huge volumes of data.
But we fundamentally believe in the power of graph technology, and combining all of your information together into a DataFabric. The core of this DataFabric can be Neo4j, a graph structure or something else entirely. The important thing is that you link all of the data together in your legacy enterprise, and that you do it quickly.
Some of this data stored in applications across enterprises can have hundreds of entities, each of which can be represented as a node. Another necessary component of creating a DataFabric is being able to determine which data is truly necessary. While many people believe they need to incorporate every single data point, this simply isn’t true.
For example, maybe you only need a person’s first name, last name and address — not whether or not they have a dog. And you pick which column, which node, which element you need and then put them all together.
In the graph technology world, you have to challenge yourself to think about data differently. When I was a programmer I thought about data in a very structured, two-dimensional way. But with a graph, you can continuously change your ideas and the ways in which you fit everything together, which allows you to try new graphs and graph data models in real-time.
Richey: And while we know the power of graphs, one of the big hurdles is that people don’t know what graphs can do. For the most part, there’s not a tremendous amount of Neo4j expertise out there, but because we believe graphs are so important, we want to help bring them to enterprises.
It’s easy to show someone very quickly what graphs can do, by providing data insights that weren’t available in their old data systems. This helps people immediately see the value of graphs, and makes them more willing to put resources towards adopting graphs.
The FactGem Advantage
We built a platform through FactGem that lets you start on Neo4j immediately — just take your company’s or customer’s data, load it into Neo4j and build an application. We put a schema on top of Neo4j as a reference.
And NoSQL doesn’t mean you don’t have a schema, it just means you don’t have to have a schema. If you’re going to write an application, you have to know what’s in your database, no matter what it is or how you want to use the data. So we essentially let you draw it like you would on a whiteboard, have a schema, load up the data, show the value of the graph and build the dashboard by dragging the profiles.
This immediately shows people that they can query six, seven, eight, nine degrees down in the graph and discover things they hadn’t seen before. Once people see it work in real time, they immediately see the power of graph technology for their enterprise. So not only does Neo4j provide the power of a NoSQL, no-schema database; it also offers the support, regulation and comfort of having a schema on top.
Kvamme: They key thing is that a lot of people are skeptical of new technologies. We can cut through this by going to customers, taking as much data from as many different databases that they can hand to us, build a graph model, load the data and return insights — all in under two hours. Providing insights this quickly really drives home the value of graph databases.
How are we able to build a model so quickly? Take a look at the demo below:
After all the clean data has been returned, you can upload it via our UploadR tool. This app takes the data from the CSV file in real time and creates an identity match, and once the data is uploaded, it picks the nodes the data connects to.
This allows you to build a query-able graph database in a really short amount of time. It also allows for flexibility — because circumstances, queries and questions are continuously changing.
Last but not least, you want to be able to actually visualize these relationships:
Clark and the team have built a REST API that allows you to build any custom application on top of your data stack. One of the most important things to remember is to start small. Start with something you can get your hands around, demonstrate insight as quickly as possible, and build the application on top of that.
I think all existing applications are eventually going to be data services, similar to how web design is done today with Google Analytics, LinkedIn connectors and so on. Imagine all of your legacy databases as data service providers.
You could also have an enterprise warehouse, you could have Hadoop, anything — you just put it on top of the DataFabric and create apps from there. So far we’ve created three apps we think are great: a customer 360 app, a fraud detection app and a supply chain app.
Richey: The concept of turning existing legacy databases into data services is really important when trying to encourage a company to adopt a new type of database. Most enterprises have invested a lot of money in their technology, especially in fields like finance and healthcare and have to follow strict regulations.
Let companies keep their investment — just help make their technology work better. Because through the DataFabric, you can provide them with value they didn’t have before.
Share Article


Explore
Related Articles
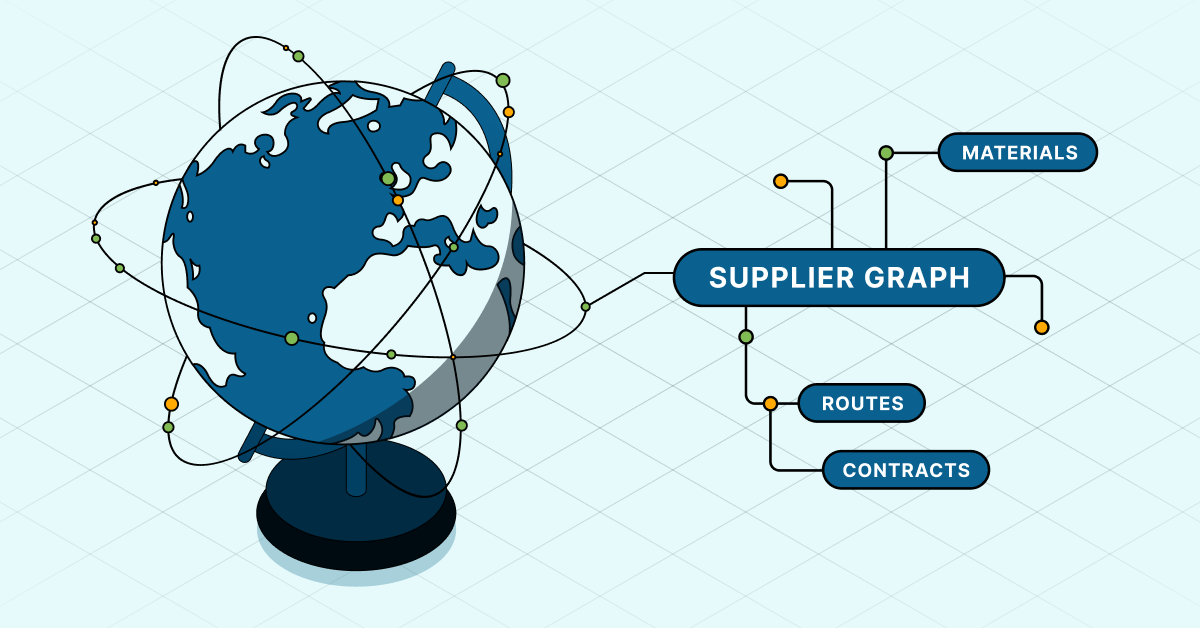
What’s invisible in your supply chain could cost you

APRA Just Put the Financial Sector on Notice Over AI. Government Agencies Need to Take Notes.
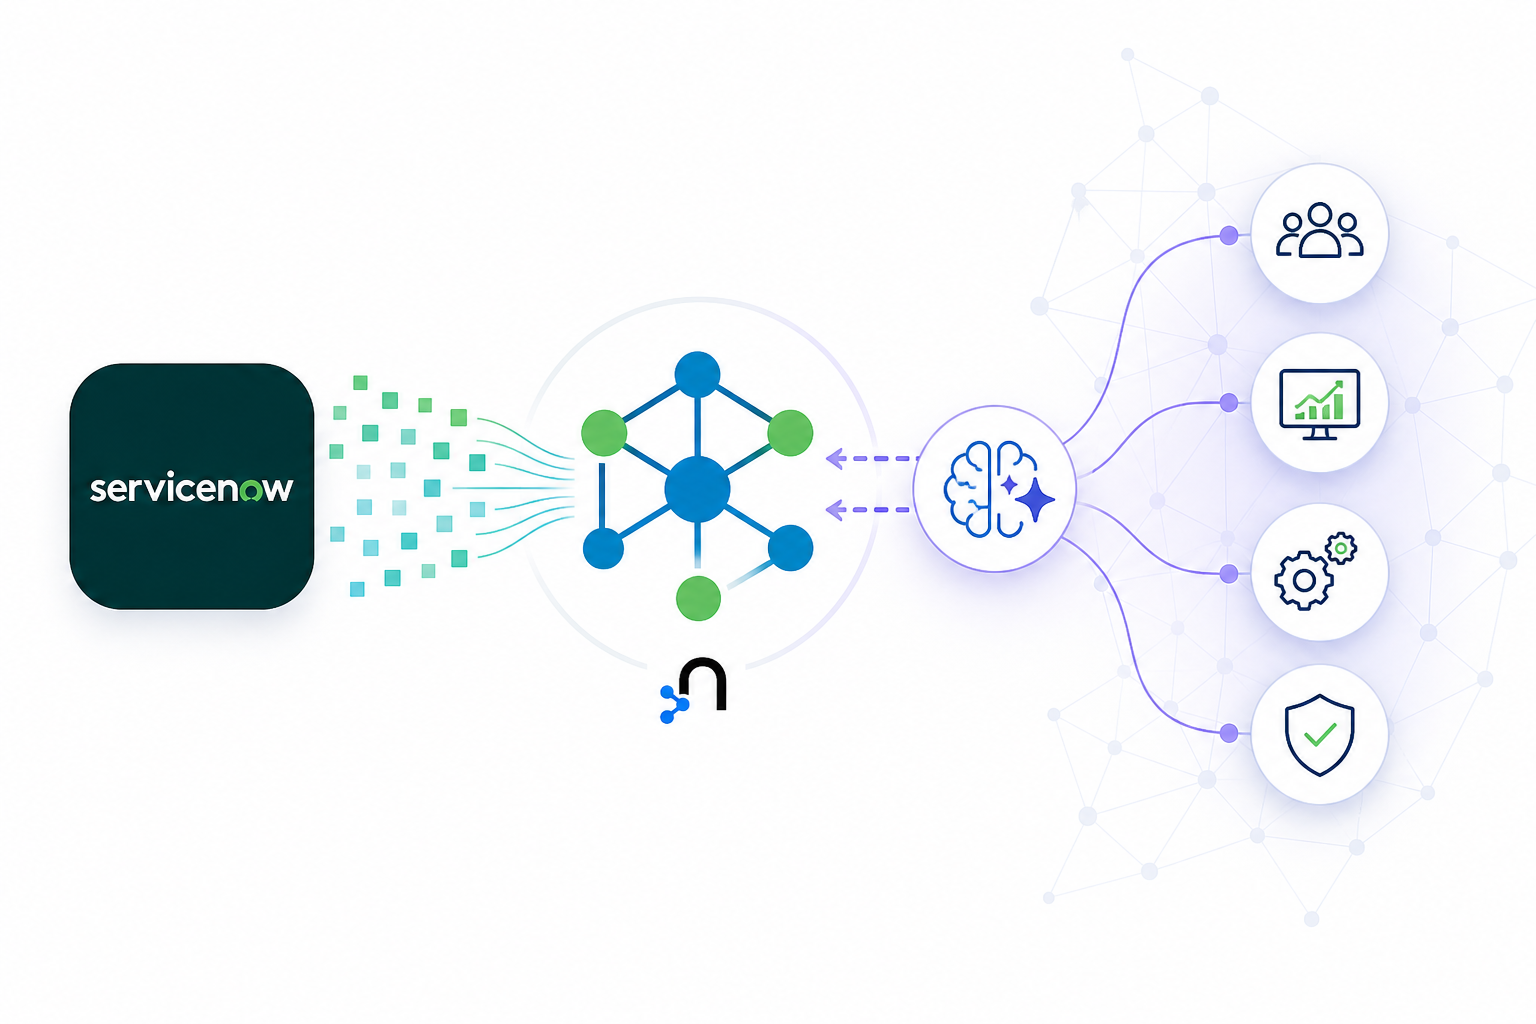
Turning ServiceNow data into connected enterprise intelligence