Announcing Neo4j Bloom 2.3: Supercharged With Graph Data Science

Product Marketing – UserTools
2 min read


All great things come in pairs:
- Peanut butter and jelly (or jam, for our international readers)
- Fish and chips
- Gin and tonic
- Simon and Garfunkel
And the list goes on…
Well, for some time now, Neo4j Bloom has been a great companion to Neo4j Graph Data Science. For example, by enriching nodes with the Graph Data Science library outputs like centrality measures or community algorithms, users can apply rule-based styling in Bloom to easily visualize results. And that’s just the tip of the iceberg.
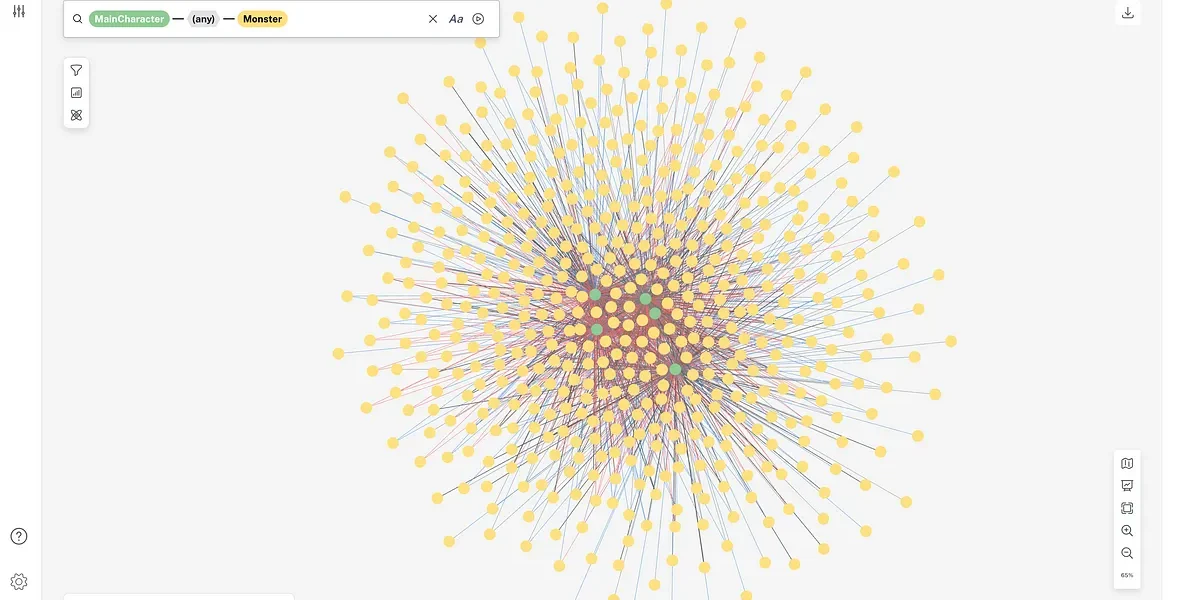
With today’s latest release of Neo4j Bloom 2.3, we bring together the power of Graph Data Science and data visualization to AuraDS users and to anyone with Neo4j Graph Data Science Library setup on their databases.

In this example, with data already on the scene, simply select the Graph Data Science icon and choose from the available algorithms to run. Next, automatically apply the appropriate rule-based styling by toggling a slider or set your desired parameters to help visualize and uncover hidden meaning behind complex data.
How about a supply chain demo? Head over to Zach Blumenfeld ’s blog post to see how he leverages Bloom with the latest Graph Data Science integration.
What’s next? Existing users of Neo4j Desktop will receive the update automatically, but if you don’t already have Bloom available, simply install the latest version of Bloom using the Graph Apps drawer.
For server plugin users or self-hosted applications, download the updates from our Downloads page.
And for Aura users, you will see an update automatically appear with the next latest release. Note that Graph Data Science features in Bloom will only be available when the Graph Database Science plugin is installed on the database for self-managed users, or when using AuraDS.
We’re interested in conversations about how you use Bloom and how we design an experience tailored for your needs. If you’re up for a conversation, sign up here.
As a bonus, enjoy a reward of $100, a charity donation, or a special community acknowledgment for your time.


