Creating a data distribution knowledge base using Neo4j

Solution Architect, UBS AG
12 min read
Editor’s Note: This presentation was given by Syed Haniff at GraphConnect Europe in May 2017.
Presentation summary
UBS bank was relying on a data distribution model that was no longer serving its internal consumers, largely because it required its users to manually join returned data to glean any data insights. The data services team knew it had to create a platform that was simple, reduced risk and increased efficiency – solutions that could be provided by a knowledge base. This would use metadata to have engines interrogate how data was shaped and how it linked with other data, and then do the joining automatically.
The next step was to develop the physical model, which lent itself naturally to a graph because of the way in which all the components of their platform related.
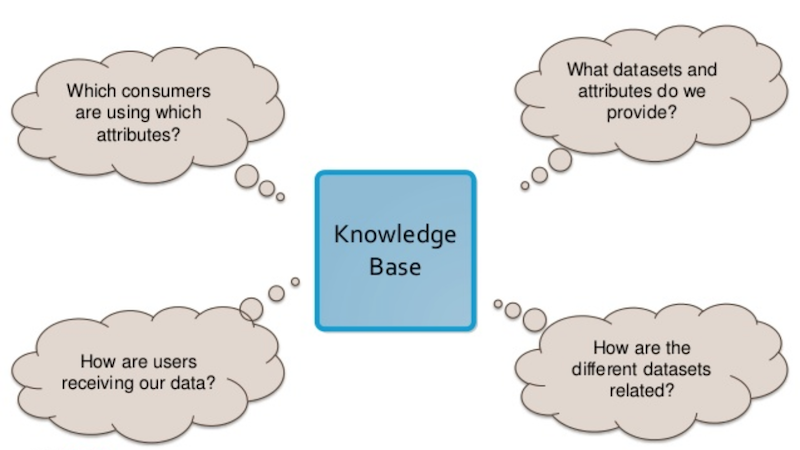
At the end of the day, any model they created needed to be able to answer four key questions:
- What datasets and attributes do we provide?
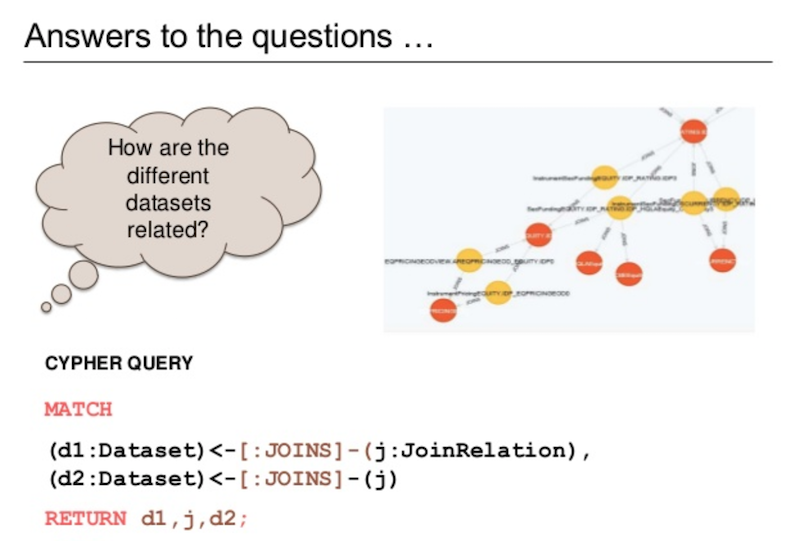
- How are the different datasets related?
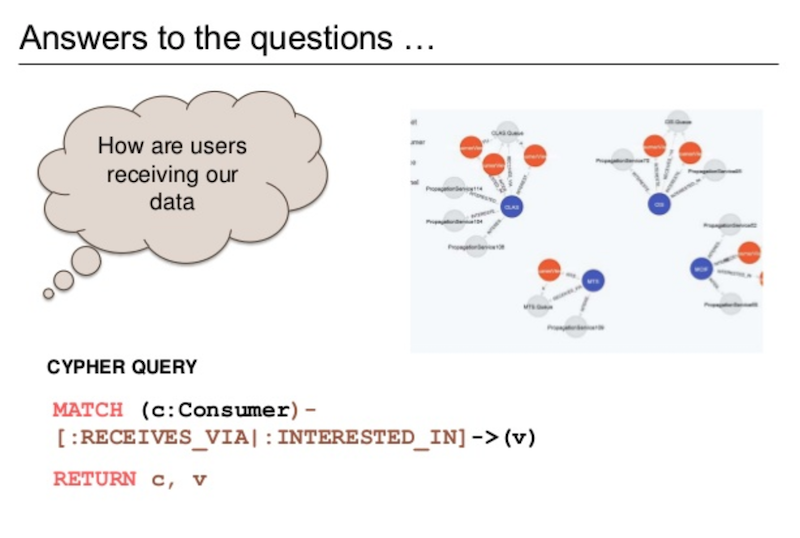
- How are users receiving our data?
- Which consumers are using which attributes?
The graph knowledge base UBS created was able to answer all of these questions to ultimately provide a more helpful tool for its internal consumers.
Full presentation: Creating a data distribution knowledge base using Neo4j
I want to explain how we built an integrated platform for distributing data to consumers within UBS bank, and how our knowledge base supported by a graph database was really the game changer:
UBS is a global bank that has been around since 1854. We have around 60,000 employees who are split into six divisions that include wealth management, investment bank, asset management, and a corporate center. I work for the Group Data Services (GDS) team, which manages the mastering and distribution of reference data to consumers within the bank. Consumers can include anything from trading systems who want to look up financial instruments all the way down to selton systems, which pay money to our clients through risk and finance systems, etc.
The GDS primarily looks into reference data, meaning it is both externally and internally sourced. Our reference data can fall into many transactional data categories, including those listed below:
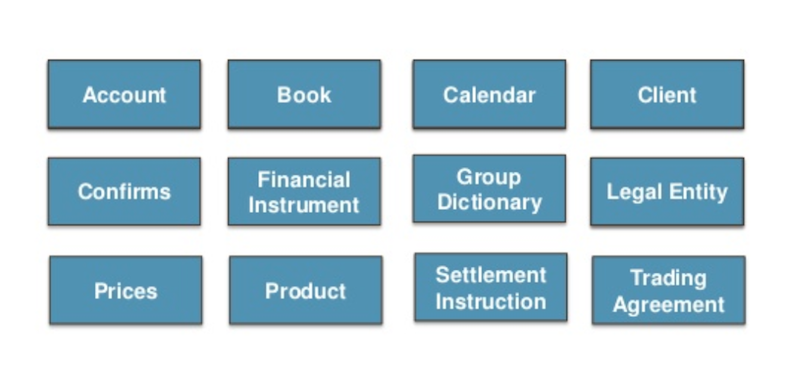
Within the group, we look after 12 data domains and 18 data subsets, which we send out over 7 distribution channels and that have well over 400 integrations. We have a lot of systems and consumers that depend on this data, and who need it quickly.
The rest of this talk is going to center around our data distribution platform: why we changed it, how we changed it, and how graph databases helped us with these changes.
The need for a new data distribution platform
Our team is charged with providing timely, accurate and complete data to users, systems and processes through a number of channels, including web-based, APIs, direct databases and a lot of messaging systems.
Below is what our data distribution platform used to look like:
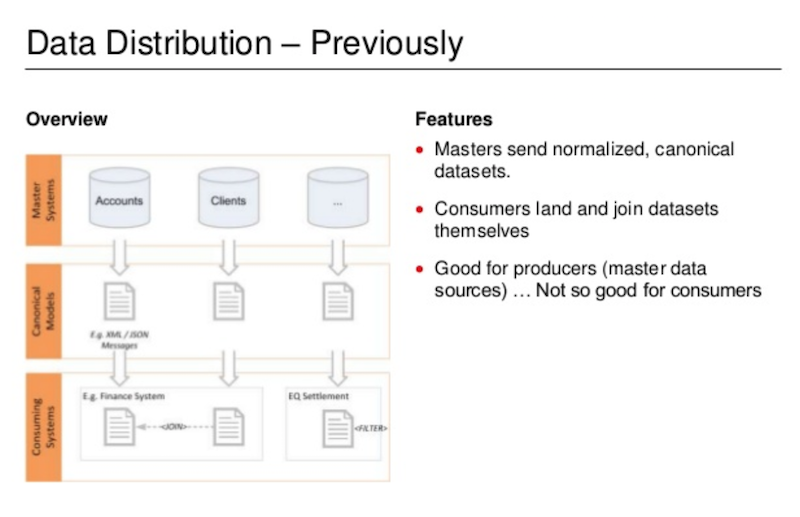
At the top, we have our master data systems sources organized in a normalized way, with account data in its own database, client data in its own database, etc. These are all relational databases that publish versions of their data in a canonical format, usually via XML message, which are sent down in the form of individual messages that our consumers then need to join. This worked okay for our team, but not for our consumers.
Consider the following hypothetical example:
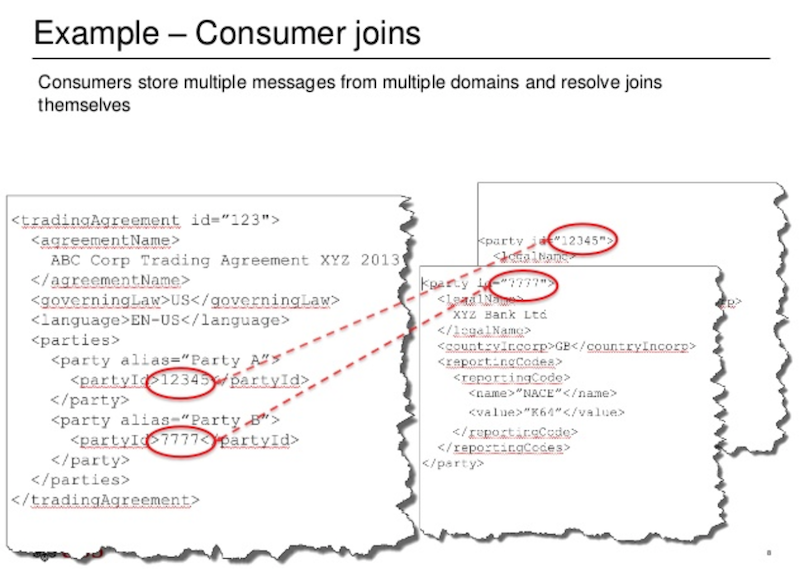
On the left-hand side of the above slide we have a trading agreement that lays out the terms and conditions under which we trade with a party. On the right-hand side, we have the two different parties: UBS and the counterparty we are trading with. This data is sent out as three separate messages, which then need to be joined by consumers.
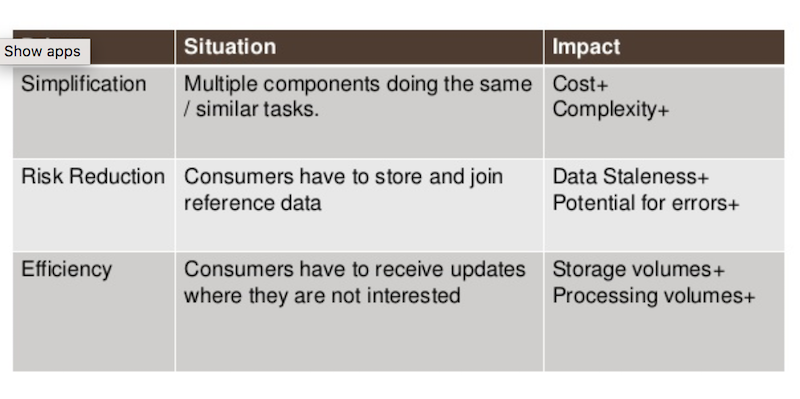
Why did we want to change this? Well, when you multiply this process over hundreds of systems, you end up with high costs and complexity being pushed down throughout the data pyramid. What’s more, our consumers had to continually re-collect data, which raised issues of data integrity, and were forced to sort through a mountain of data that wasn’t necessarily relevant.
The blueprint for a new platform
With any new process, we were looking for simplicity, a reduction in risk and an increase in efficiency:
Below is the blueprint we developed for our new platform:
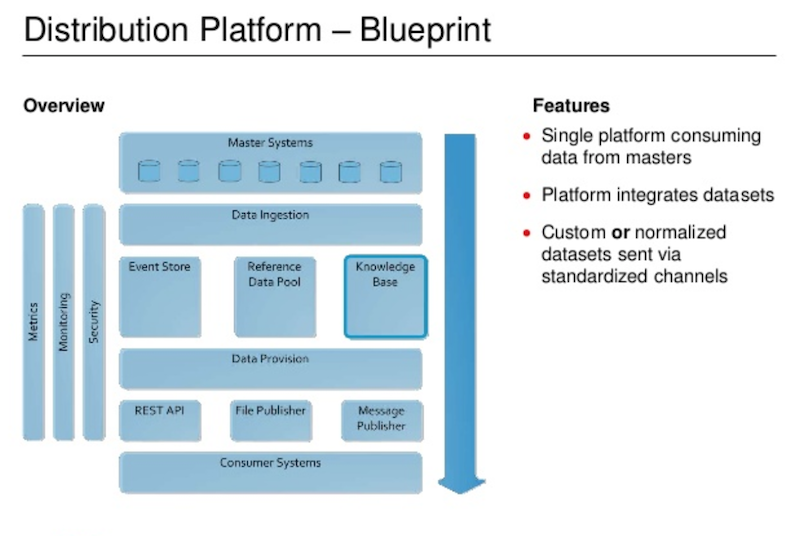
The primary difference with our new platform can be found in the middle of the above image. There’s a pool got reference data where we hold and join it, listen to different sorts of data and send events out. We effectively pre-join the data, and then push it out via file, REST, or messaging to our consumers.
Now let’s look at the knowledge base on the right side of the platform.
We wanted to write a platform that – instead of writing separates, connectors, ingesters and joiners for each of the datasets – was more generic so that we could write a component once and then use metadata to have these engines interrogate how the data is shaped and how it links with other data, and then do the joining for us. And that’s exactly what the knowledge base does.
Here’s the trading agreement example we had before, but know it’s nicely joined and ready for our consumers:
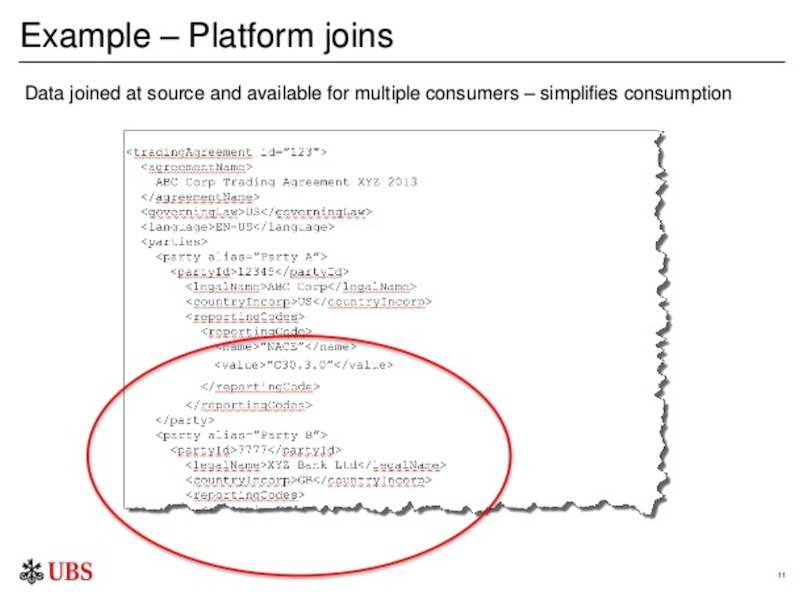
There are several benefits to this new platform. In our old model, each system was publishing its own version of data, while in our new platform we have consolidated it into a single platform. We’re able to provide pre-joined data to our consumers and provide flexible subscriptions to attributes to allow users to specify what data they are really interested in. This is really where the knowledge base and graph database come into play.
But, there were still things we didn’t know:
What other datasets does the GDS offer, and what attributes do they have? How are the different datasets related? There’s such a wide range of datasets that some of the relationships aren’t obvious, especially when you look at things such as the different roles clients can play in a trading relationship.
How do people get our data, and which consumers are using which attributes? This is particularly important when we need to know who may be getting affected by quality issues with certain data.
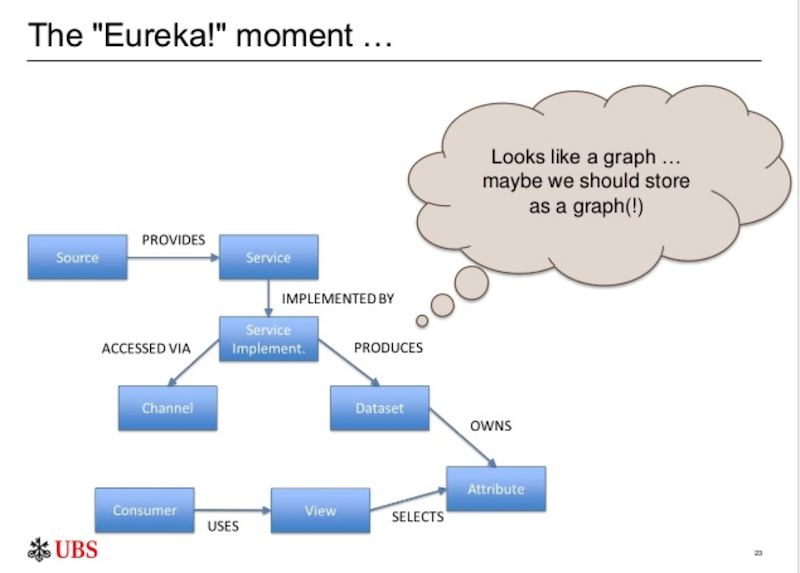
The component that did this for us was the knowledge base, which is a sub-component of the system that lets us describe the journey of the datasets and attributes from master systems to consumers. The path of the source to the consumers to each of the transformations starts to look a bit like a graph:
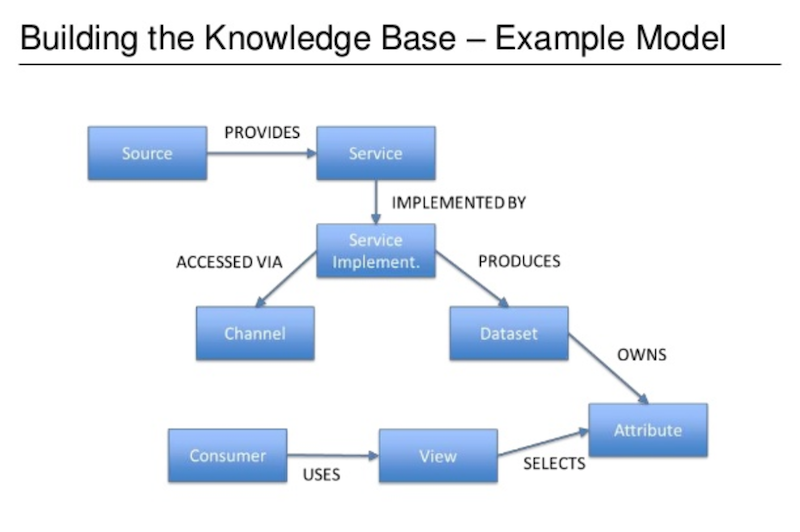
In this graph, source refers to our master systems (such as our client data system) which provides a service that is implemented in a variety of ways (such as web service or message) that can be accessed by our clients via a channel. The dataset provides the description of the client, which includes attributes such as classification code, identifiers and legal names. We then have a number of consumers who need to view the attributes of the dataset.
This is essentially a simplified version of our model.
Developing the physical model in Graph
We wanted to find a way to interrogate our model via APIs. As a financial institution, we have a lot of spreadsheets, so we made up a custom Domain Specific Language (DSL) that would provide our datasets. For example, take the composite instrument dataset Bond_Bondrating, Eqiuty_Eqiutyrating. The underscores represented unions between the datasets, and the comma represents a join. Benefits of this model were that it was innovative and allowed us to build a platform, but it was ultimately limited, complex, and inflexible.
We also considered a relational database solution as a tool to provide answers to our earlier data distribution questions. It technically could answer these questions, but it was extremely challenging because there are so many different entities and relationships, not all data flows are the same, and it’s difficult to get the performance needed with a generic relational model.
And we finally had our “Eureka!” moment, which seems really obvious now. Because when we looked at it again, we realized it looked like a graph:
We decided to store the metamodel in the Neo4j graph database. It was already in use in the bank as part of the entitlement system at UBS, it had comprehensive resources available online, and drivers and adapters that matched our language choices.
So we went and made a model in Neo4j, started building out the query layer to query the API, and queried the data in the Neo4j browser to see what new insights we might be able to find out.
Now, let’s go back again to our original questions. First, what datasets and attributes do we provide?
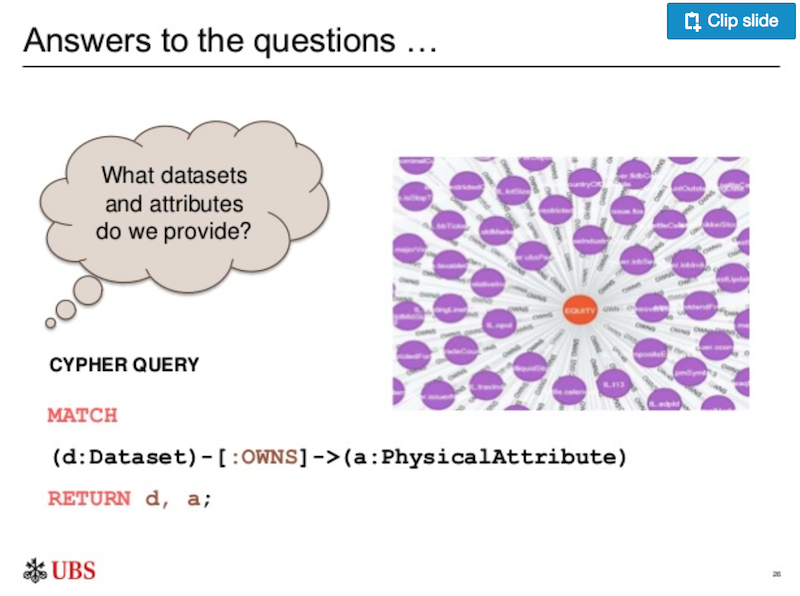
This is a relatively straightforward query in Cypher, and it works really well.
How are the different datasets related?
If we start getting further down the model, we can ask the question: how do users get our data? What channels are we publishing out of? How many published subscribed users do we have? How many people do we have? Do we get file drops, etc.:
And then, finally, we ask: Which consumes are using which attributes?
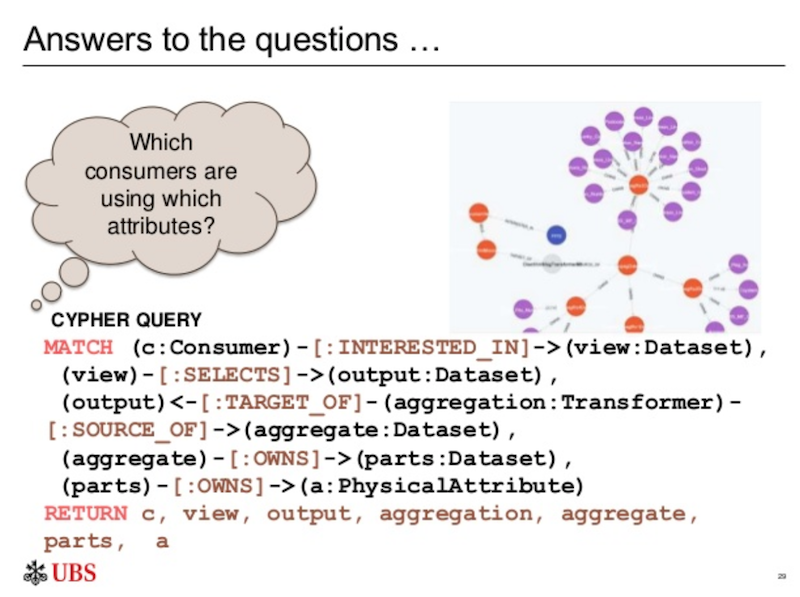
This one goes all the way up the graph to say, “Here are my master data systems. These are the attributes they have. Who’s taking those attributes, and how are they getting them?”
And this is really where the game changing part came about in. Previously, we were publishing out a lot of data. We knew people were taking the data, joining it and getting insights. But it was difficult to say exactly who was taking our data, and how were they getting it. But by storing the data in a graph, it made it much easier to answer these questions.
Benefits of our knowledge base
There are several benefits to our knowledge base. Because it’s a single source of truth, we can hold our metadata about the physical journey of this data all in one place. This makes data governance much easier because we know who’s moving data where and when. Consumers are able to understand what datasets we offer, and more importantly how the datasets relate to one another. And, we are able to glean more data insights for both consumers and producers.
Knowledge base challenges
We did encounter some challenges with our new knowledge base. First and foremost, not all of our datasets have been entered yet, so there are still a few gaps in coverage data. Furthermore, there’s a huge amount of data in our graph, and the graph concept can be a bit intangible at times.
Initially, trying to explain or sell a graph database to our stakeholders was a challenge, but due to more regulations surrounding data lineage, more people are starting to understand the importance of being able to map out the journey of data.
How did having a graph database help us?
How did having a new graph database help? The first way is that it provided a natural flow of data from source attributes, transformations, transformation datasets, all the way down to consumers and their views. That sort of traversal would be extremely difficult to do in a relational database. We have the flexibility to add new attributes with each regulation or business we bring on, as well as new rules and consumers.
Again, a huge advantage of holding this in the Neo4j graph database is that we can add to our data model without having to go through a remodeling exercise.
And finally, everything is an instance. By focusing on relationships between processing nodes rather than structure, we ended up with a very organic model. And this is often glossed over, but not all of these data flows are the same. Some are very simple, while others require a lot more merging. Account structures and data around our client roles is quite complex. So, the fact that we can model these flows as instances makes it very flexible again.
The benefits of Neo4j
Neo4j provided the answers to our questions, and more. It provided a flexible schema that allowed us to model different flows, and provided us with an easy-ish query language with Cypher.
I say “easy-ish” because there’s still a learning curve from a concept point of view. It was easy to create a platform service layer given the drivers, which allows us to easily create an API. There’s also great performance and excellent support from both Neo4j and our internal UBS team.
The challenges
A lot of the challenges have diminished due to changes in the graph ecosphere. However, at the time we did this project, we had to load the data manually. There were no out-of-the-box tools available to help us easily manage the data, so we ended up having to write and test a lot of scripts. And finally, finding people who had Neo4j skills was somewhat difficult, but it’s fairly easy to cultivate these skills.
Next steps
We focused on delivering the platform piece first, making a better search function, and providing better visualization with this data. The ultimate goal is to provide a self-service tool that allows people to browse and request data distributions.
We are also working on widening the coverage of our data sets, but we’re pretty much there, and have been working to offer this to other teams within the bank. My ultimate dream is to provide an impact analysis tools that provides self-service integration.
We’re part-way towards implementing our vision, and it’s up and running to this day. All and all, I’m very happy with the knowledge base we developed.
Download this white paper, The Top 5 Use Cases of Graph Databases, and discover how to tap into the power of graphs for the connected enterprise.
Share Article


Explore
Related Articles

Neo4j Named “One to Watch” in Snowflake’s 2026 Modern Marketing Data Stack Report

POLE+O: The 5-Type Ontology That Solves the Hardest Part of Building a Knowledge Graph

1 of 3: The difference between a graph, a knowledge graph, and a context graph
