Demo: Building intelligent supply chain application with Neo4j

Senior Director of Product Marketing
10 min read
Supply chains are becoming increasingly complex as companies look to capitalize on new opportunities in the global marketplace. In order to stay competitive, enterprises must be able to quickly and efficiently adapt to changing conditions. One small change in the market can reverberate throughout this complex ecosystem, making it difficult for any one function or even group within a single company – such as finance and accounting – to have visibility into everything that goes into making products available at stores, retailers, and warehouses around the globe.
In any business, but particularly in retail and warehouse distribution, the need for precise information about the inventory, stocking of the products, and how they will be distributed, is of paramount importance. The more steps there are in the supply chain, the greater the risk of instability. Graph databases are well suited for this task as they excel at representing complex relationships. As a result, a graph-based approach to supply chain management provides the flexibility and scalability needed to meet these challenges. By representing data as a series of interconnected nodes, Neo4j makes it easy to model complex relationships and identify patterns and insights that would be hidden in a traditional tabular data set.
In this demo, we will show you how to build a globally distributed, scalable enterprise supply chain application using Neo4j, focusing on fleet management and warehouse distribution center mechanics. From front-end development and backend logic to connecting the APIs and Neo4j graph database, we will demonstrate how Neo4j and graph technology can help you unlock the power of connected data.
Demo scenario (the story)
To combat demand volatility, organizations are leaning on predictive and prescriptive analytics, machine learning, AI, and augmentation to provide clear solutions for both sudden issues and potential issues down the road. This includes shortening the time to production, determining the best way to buffer supplies and inventory, and automating processes to navigate shortages in supplies.
In this demo, we’re focusing on a warehouse, distribution, and fleet management problem. Let’s dig in deep to learn how Neo4j and graph databases can solve these complex challenges in real-time.
Here’s a short video of the end-to-end problem narrative, the application workflow, and scenario insights. It also reveals why Neo4j and graph databases are key to solving supply chain complexity:
Reference architecture
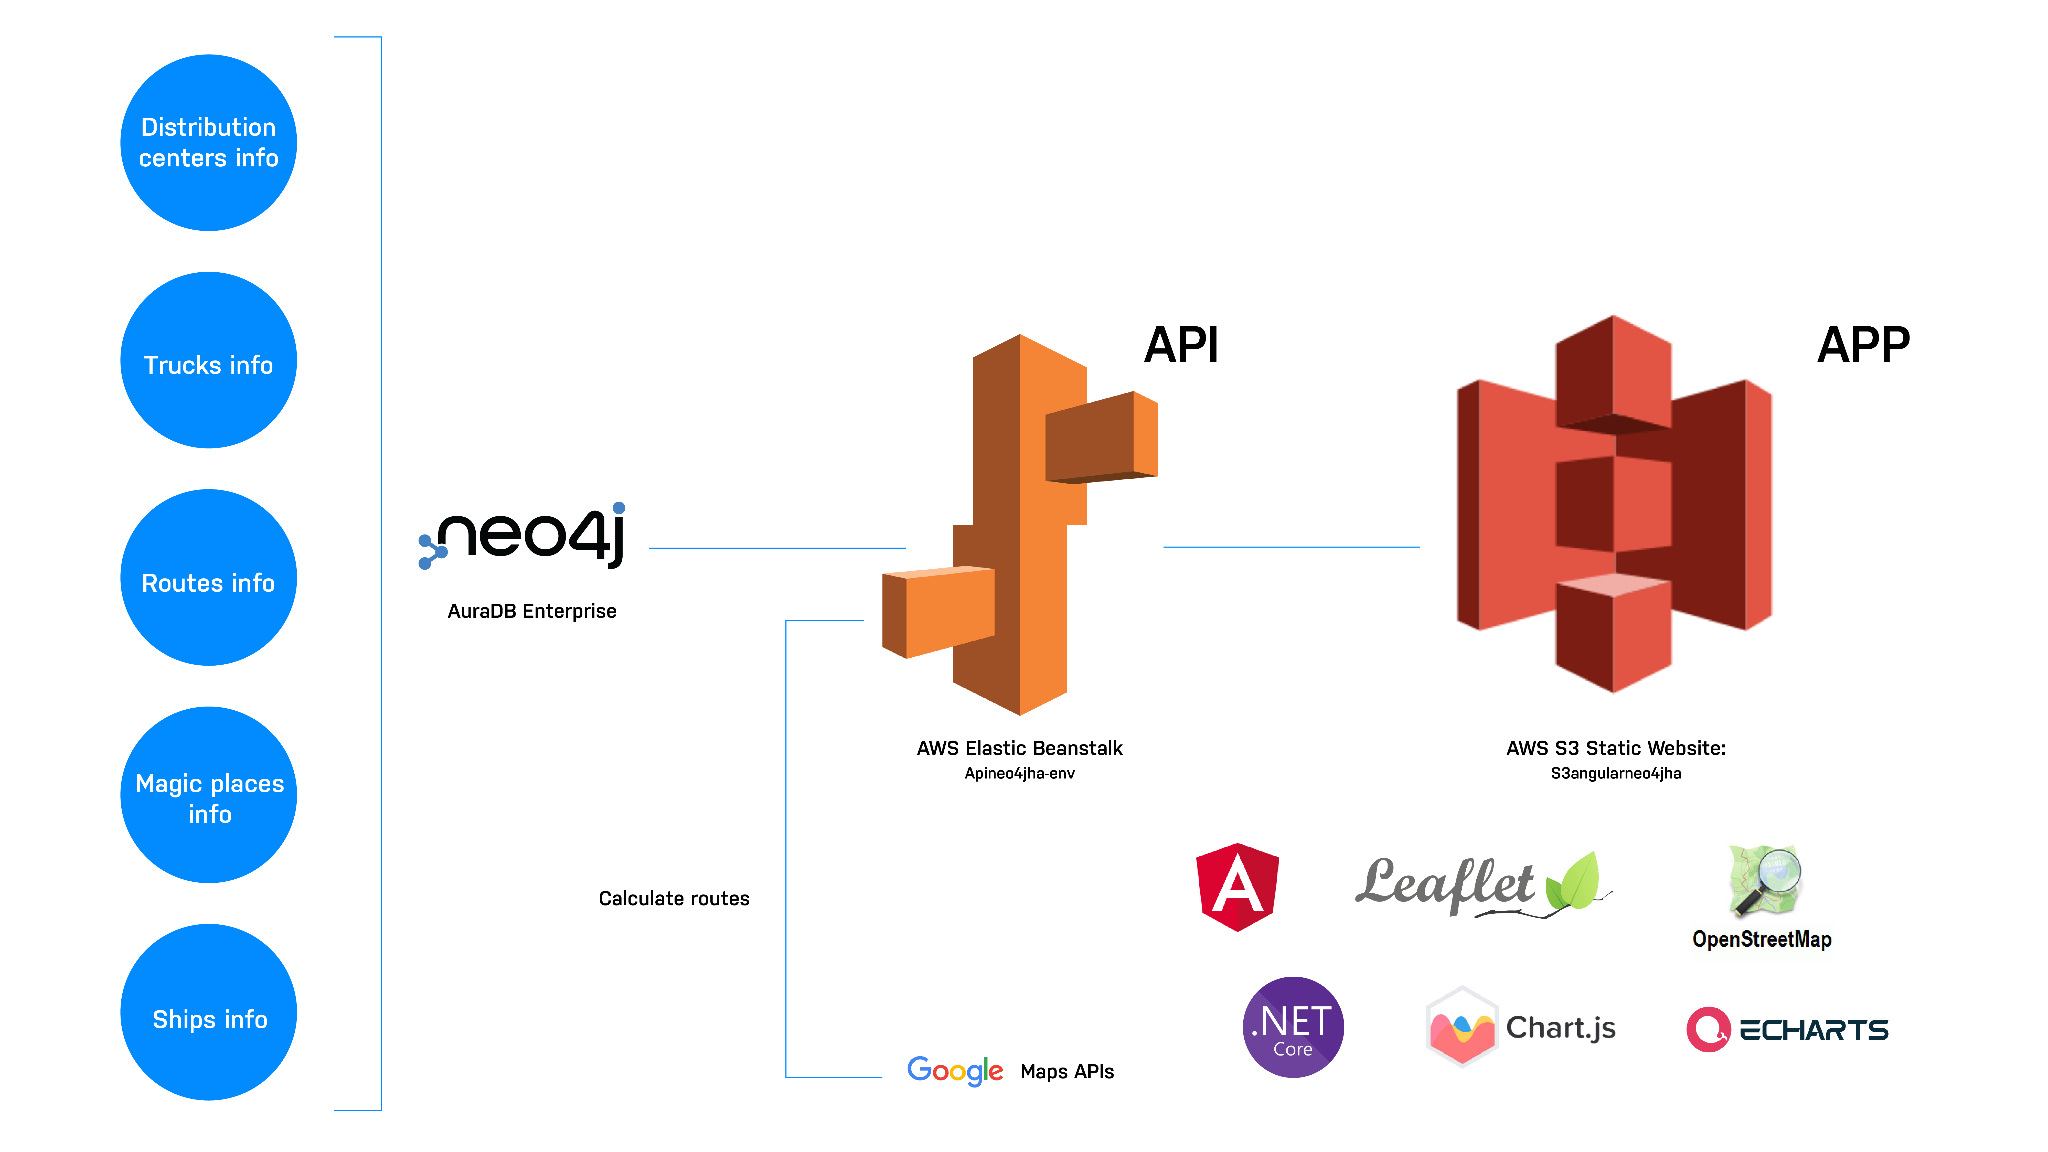
Let’s start with the reference architecture we used for this demo. The API (backend) is developed on .Net Core 5.0 and is hosted on AWS elasticbeanstalk – you can find the swagger API URL in the API section. The front-end of the app is written in Angular (static website), and the entire solution is built and deployed on Amazon Web Services (AWS).
We used Neo4j AuraDB Enterprise on AWS – a fully managed graph database as a service – as the database platform. We were able to spin up in minutes and start developing the data model in no time. Neo4j AuraDB provides:
- Global availability, no lock-in, multi-cloud freedom. This demo application and solution are hosted on AWS, though you can host it on GCP as well. For more information, learn here.
- Fully automated upgrades and maintenance
- Enterprise-scale, security, and performance with industry-leading SLAs
- Connectors, integrators, and built-in tools for easy development
API development
Note: You can find all the technical specifications and code for the application, along with instructions to get started, and build this demo on your own with our GitHub Repo.
The API is built using .NET 5.0. The solution contains two projects:
- SpikeNeo4j: API implementation
- SpikeNeo4j.Test: unit tests for the controllers
To connect to the Neo4j database, we installed the NuGet Neo4jClient (community driver) package in the SpikeNeo4j project. The connection parameters are stored in the appsettings.json file.
In addition, the following NuGets have been installed:
- Gmap.Net.Core: connection to google maps API to get truck routes and geolocate addresses.
- The Google Maps API key is stored in the appsettings.json file.
- Automapper, this NuGet is used to map model objects to DTO objects.
- Microsoft.AspNetCore.
Authentication.JwtBearer , which is used to generate JWT tokens for authentication purposes. - Swashbuckle.AspNetCore, this package allows development of the API documentation.
Here’s the URL Swagger if you wish to play around with it: https://apineo4jha-env.eba-
How to use the API?
There are a number of ways to get this API running. The easiest is to just download Neo4j Desktop and get going:
- Neo4j AuraDB: Just create a new instance of AuraDB and get started
- Populate database: Once you have (1) you need to populate the database with data. Here’s how to do that:
- Start Neo4j (using a command like this: C:neo4j-community-4.3.5> binneo4j console)
- Open the browser here.
- Login using your user and password.
- Go to file Scripts/populateDB.txt placed at SpikeNeo4j project (on GitHub), copy the content to the Neo4j line command, and press play.
Now you’re ready to use the API!
Here are some of the Common API endpoints for this demo if you wish to quickly learn more about (Swagger API):
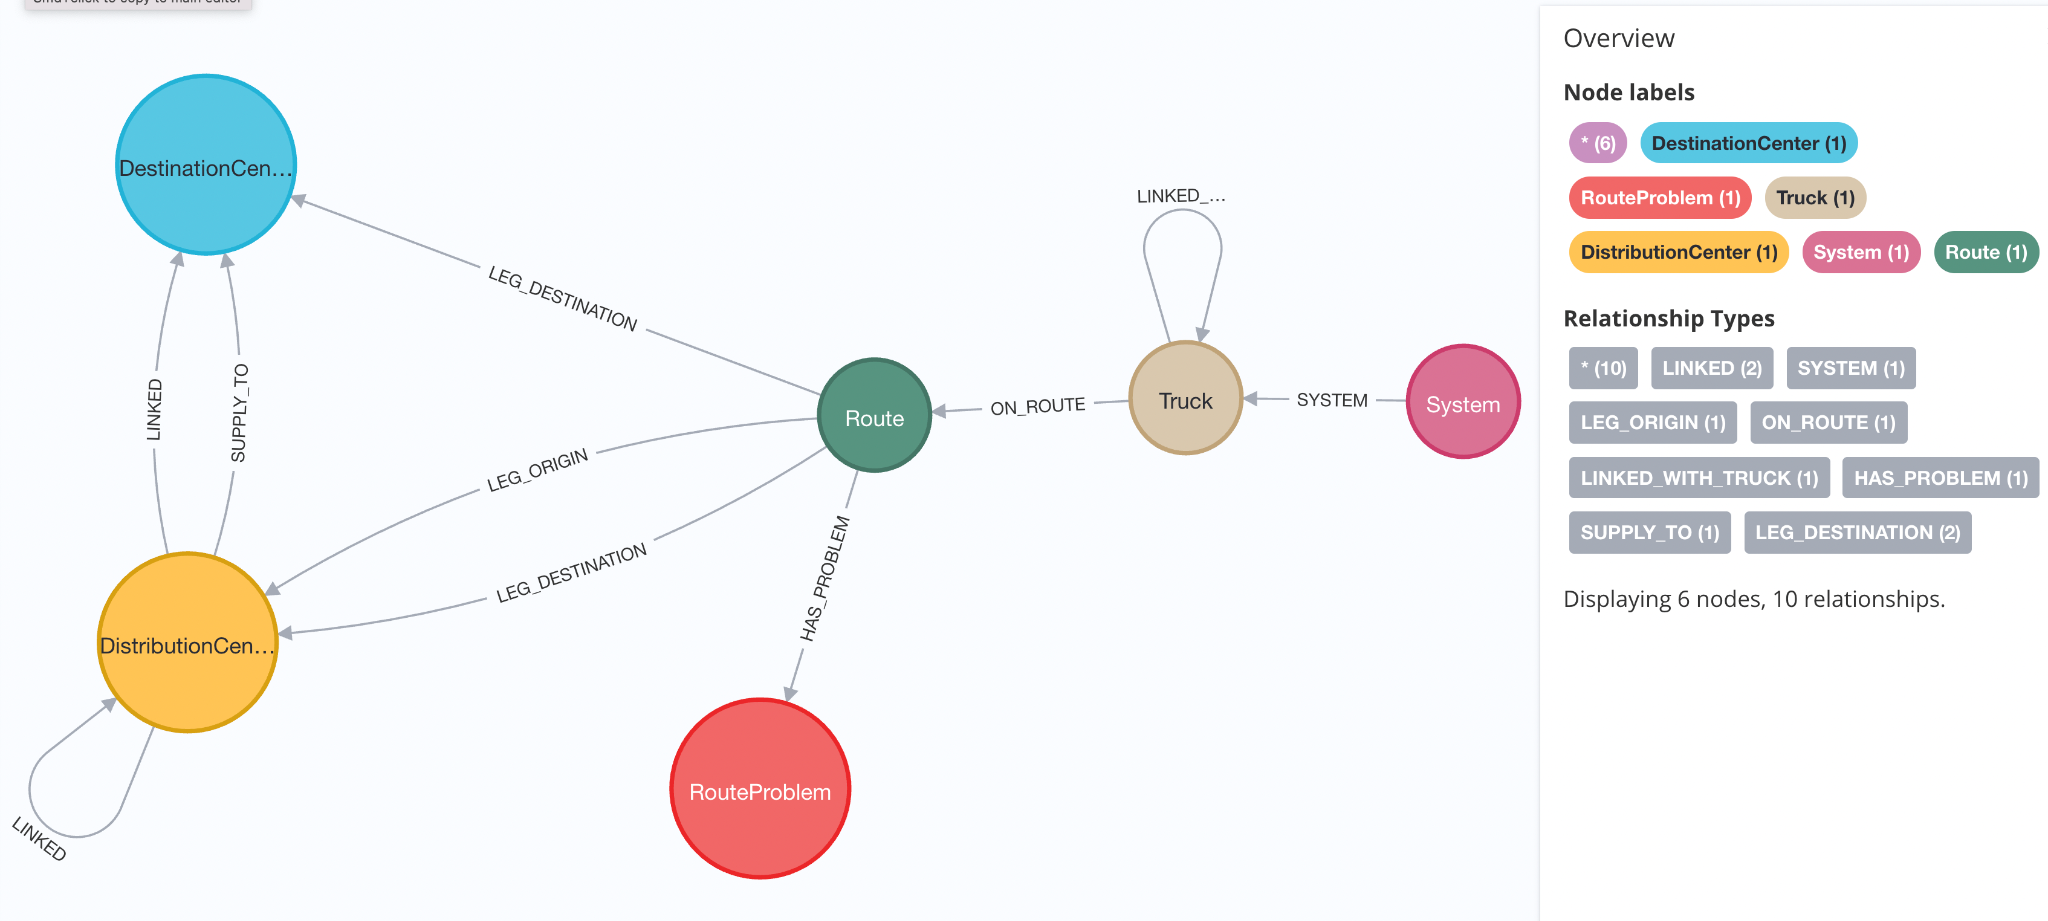
Building the graph data model
Here is the data model we used for this demo. Pretty straightforward.
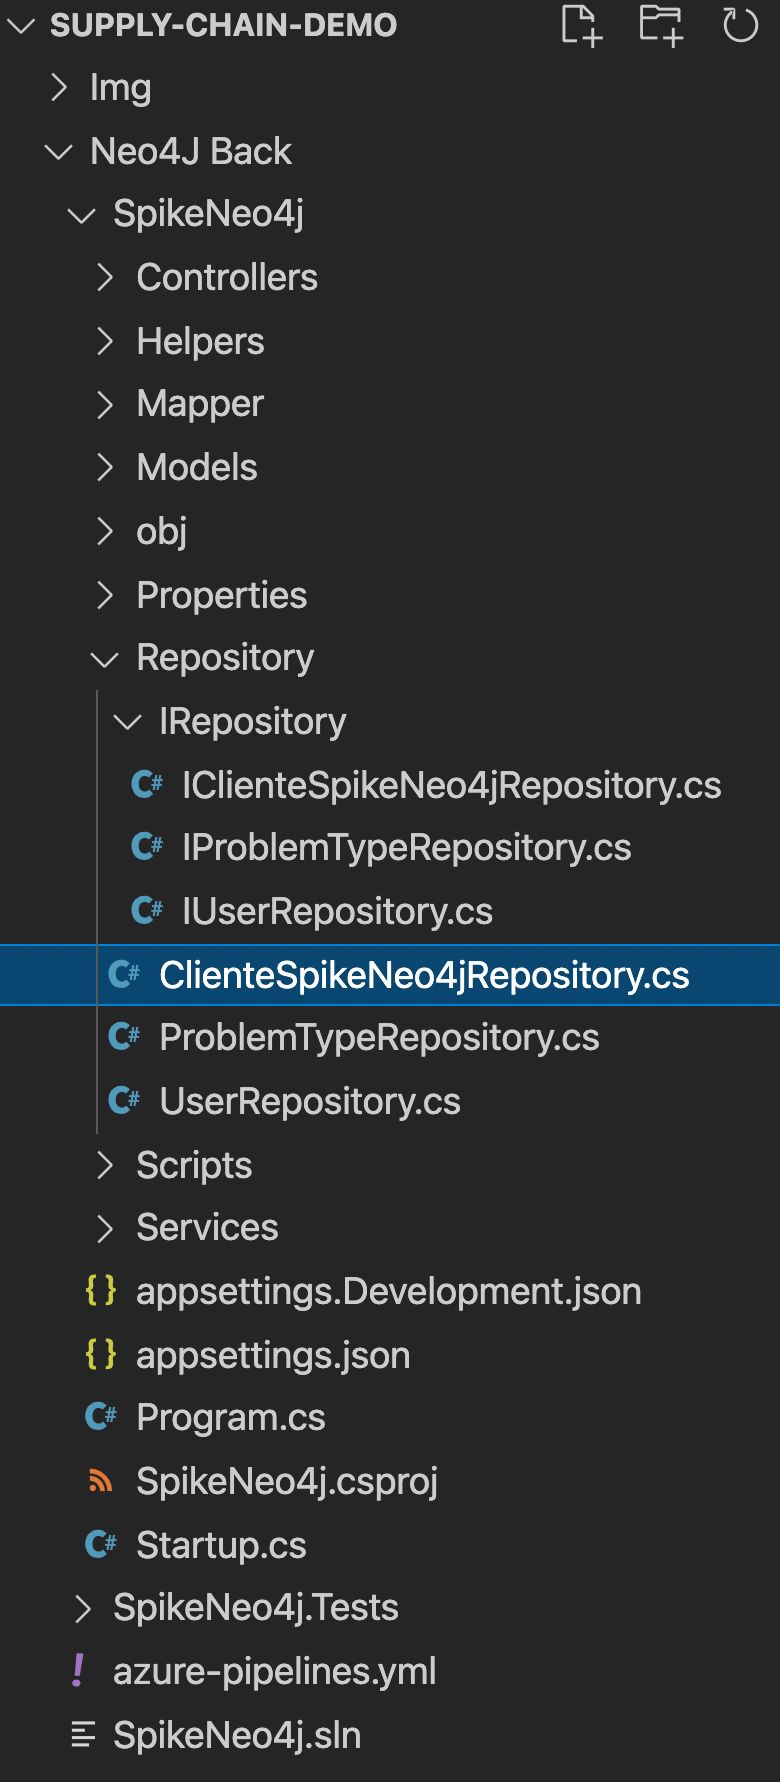
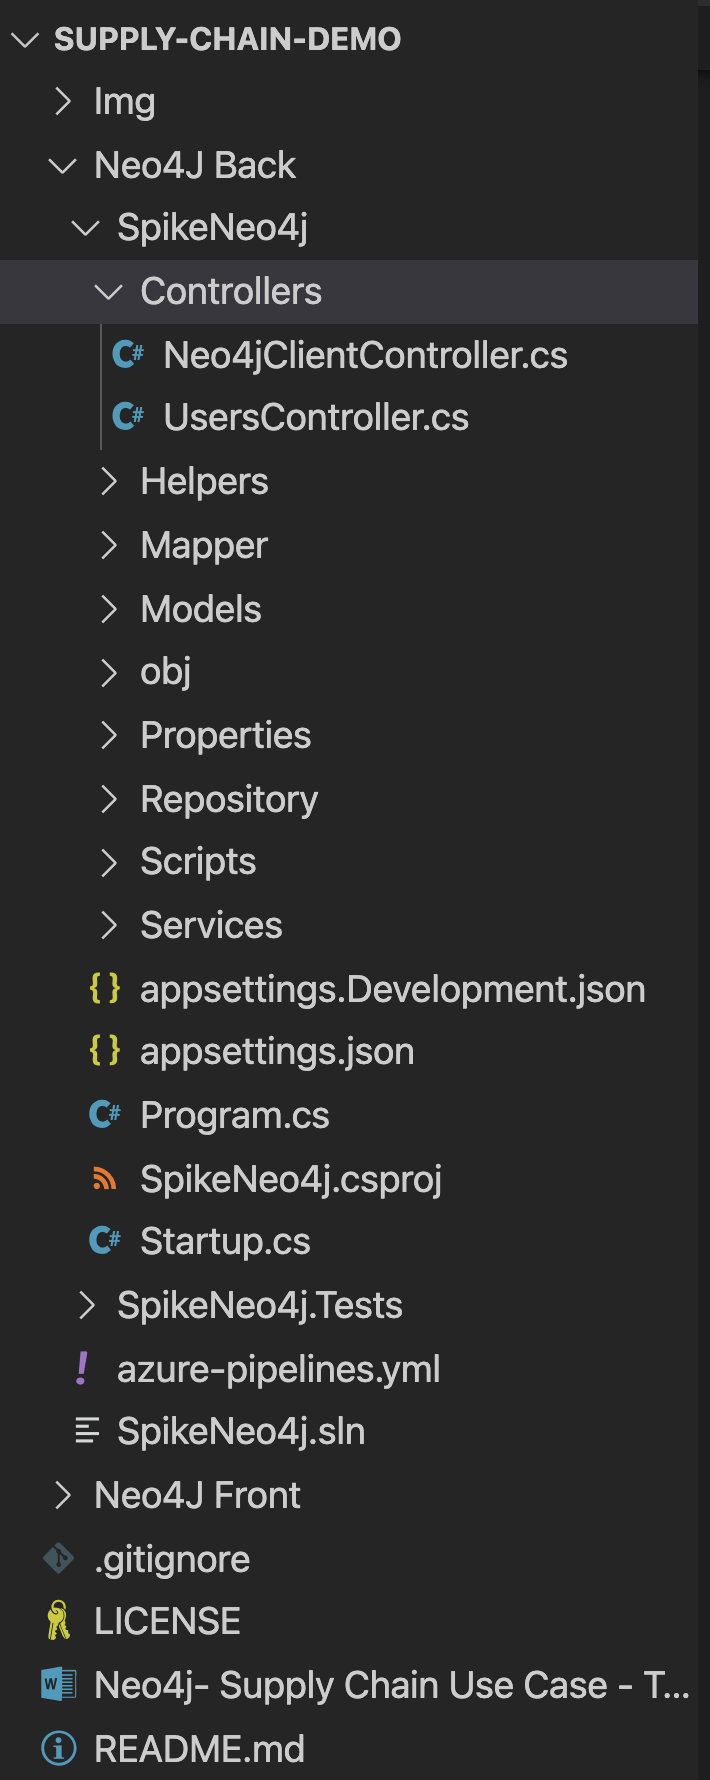
Neo4j project structure
The following contains a description of the project, all the way from backend logic and API to ClientController and ClientRepository.
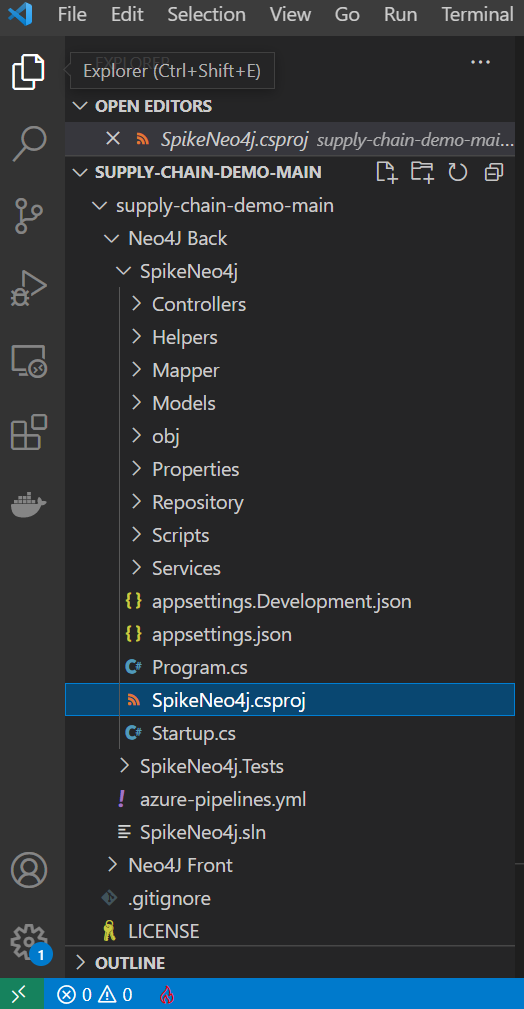
- Dependencies: The Dependencies in the project contains all the installed server-side NuGet packages as mentioned above.
- Properties: The Properties node includes launchSettings.json file and Visual Studio profiles of debug settings.
- Controllers: The Controllers folder contains the developed controllers: Neo4jClientController y UsersController. These controllers handle incoming HTTP requests and send the response back to the caller.
- Helpers: The Helpers node includes some reusable classes to help with some repetitive tasks. In this project, MathHelper class is implemented mainly to calculate the middle point between two spatial points.
- Mappers: The Mappers folder contains object-object mappers for transforming an input object of one type into an output object of a different type. These mappers are mainly used to convert model objects to DTO objects.
- Model: The Model node involves all classes of the business model. It also contains the DTO classes.
- Repository: The Repository folder includes all classes which mediate between the domain and data mapping layers. The main repository here is ClientSpikeNeo4jRepository, which implements the queries to the Neo4j database.
- Scripts: This folder stores the populated.txt file. Use this file, as mentioned above, to fill the Neo4j database with data.
- Services: The Services node involves the GmapService, which is used to call Google Maps API to get information about routes, geolocated positions for keywords, etc.
- Program.cs: SpikeNeo4j is a console project which starts executing from the entry point public static void Main() in Program class, where we can create a host for the web application.
- Startup.cs: ASP.NET Core application must include Startup class. It is like Global.asax in the traditional .NET application. As the name suggests, it is executed first when the application starts.
Coding the front-end of the application
We have built this application using Angular 12. Numerous reasons for that include:
- Angular is a complete framework that has all the artifacts and requirements to build a SPA (single page application).
- We used this framework for its robustness and to provide an architecture to modern applications that set a standard in development and allow easy maintenance.
- Modular Application: For future developments, we have modularized as much as possible, thus increasing scalability and maintainability.
Core: In this module, we have all the necessities for our application to run correctly, including Components like header and footer. - Shared: Although it is empty, we have it prepared for extensions, and here should be everything that is used by various modules/features.
- Maps: Here we have two main components – one component for the 2D map view and another for the 3D view. If you want to add new functions later, they must be created in the same way as this module.
- External libraries: We have used different libraries to display maps and graphics.
- Maps: In addition to using Leaflet, which is the one that manages everything related to connections and markers, we used a Mapbox for the style of the map. For the 3D view, the library we chose was Miniature Earth.
- Leaflet: Open-source JavaScript library for mobile-friendly interactive maps. We use it to manage the markers and connections between the different distribution centers. It also helps us to trace the route traveled by each truck.
- Miniature Earth: A library that uses ThreeJS for rendering the 3D view of the map.
- ChartJS: Detailed charts of distribution centers, which we use to generate sales, planning, and supply statistics.
- Apache ECharts: A powerful interactive charting and visualization library for browsers. We can see this library in the speedometer and the revolution counter in the incident mode of the truck.
Links:
https://echarts.apache.org/
https://www.chartjs.org/
https://miniature.earth/
https://leafletjs.com/
Bringing the code, API and the database backend together
- Distribution Centers
Code:Neo4jClientController.Listcentersandrelations
API: /api/neo4j/listcentersandrelations
Cypher Query:MATCH (o:DistributionCenter)-->(d) RETURN * LIMIT 10


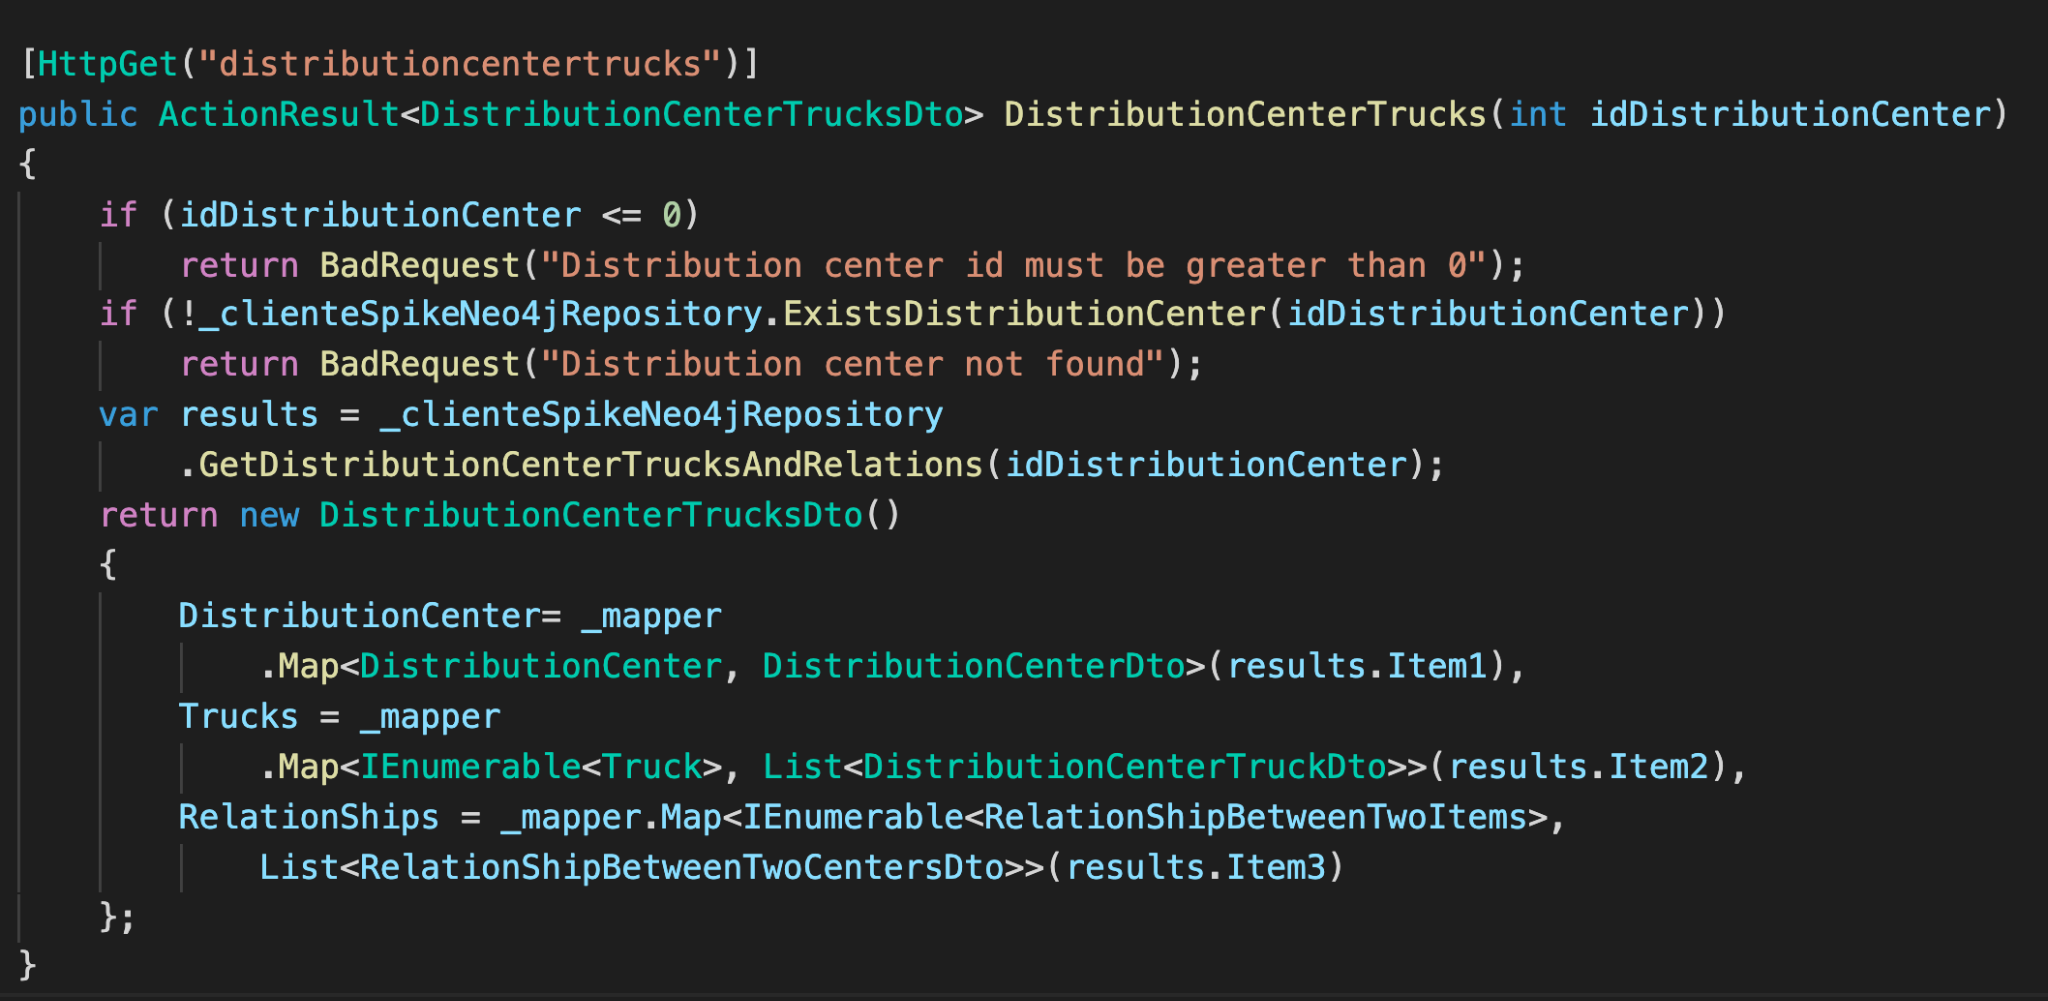
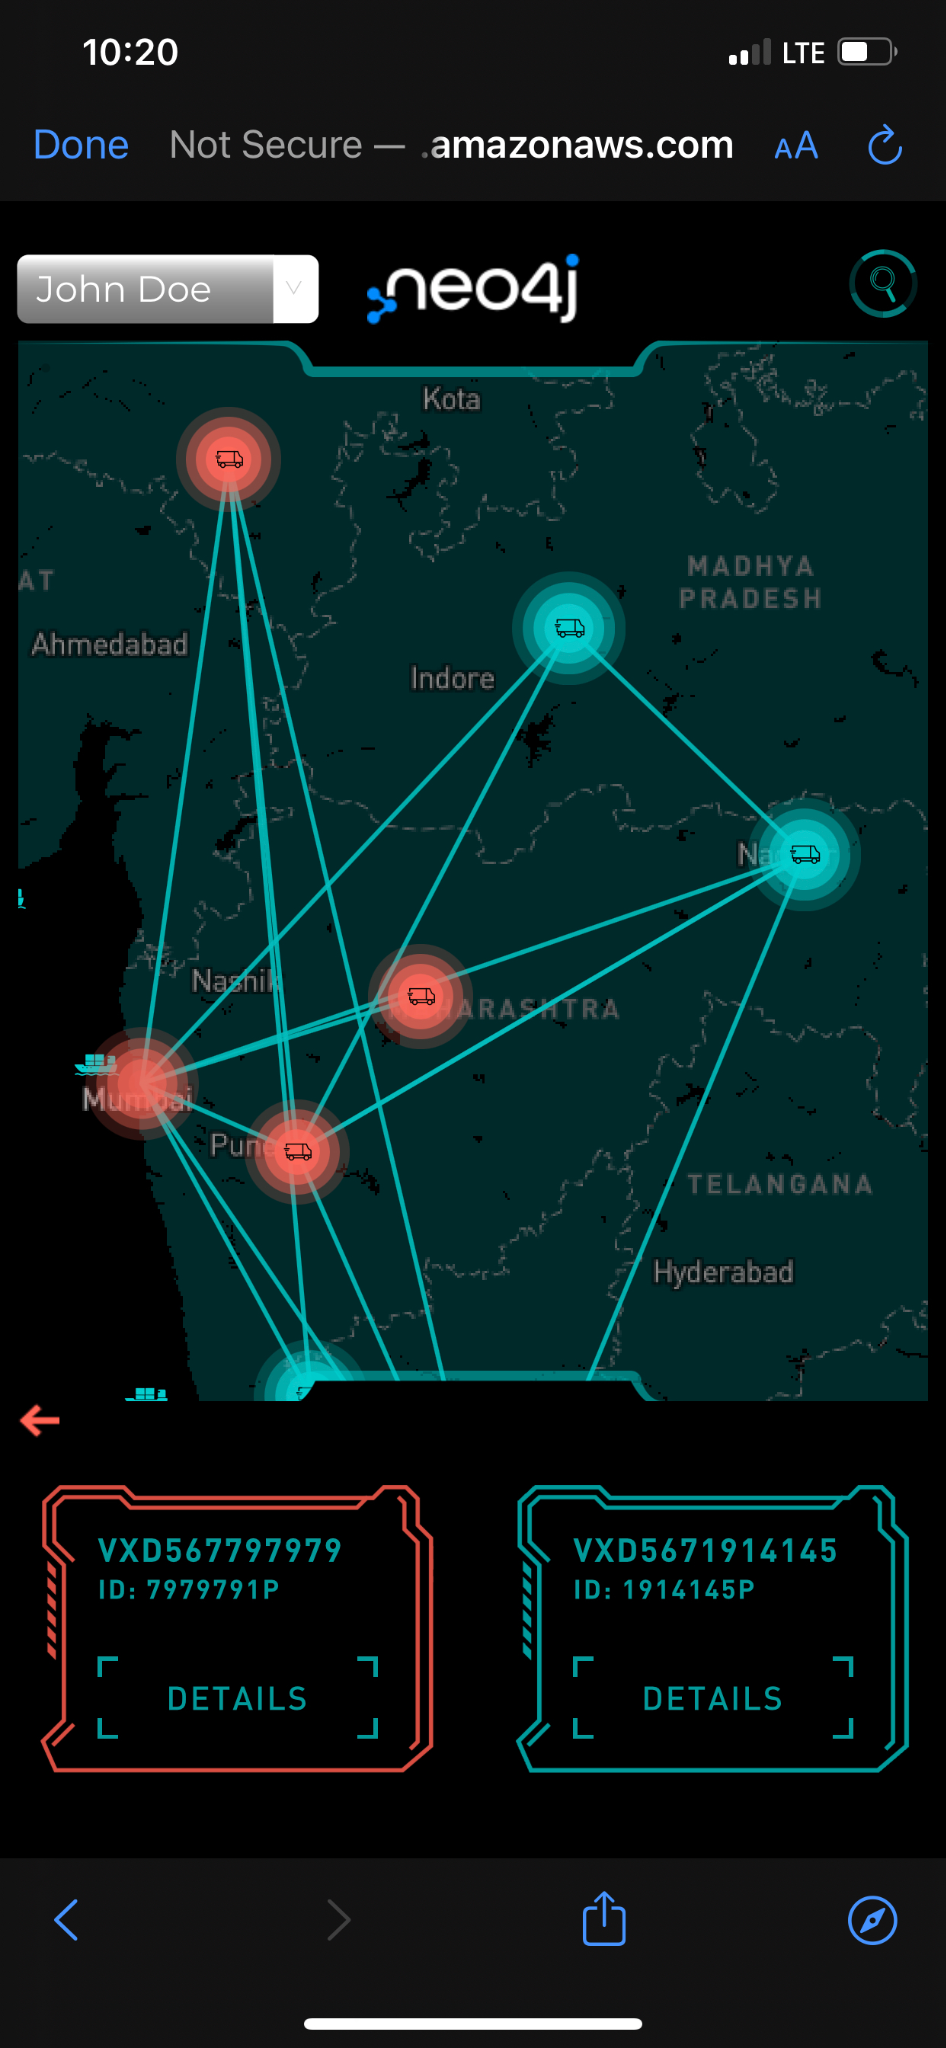
- Distribution Center Trucks
Code:Neo4jClientController.Listcentersandrelations
API: /api/neo4j/distributioncentertruckonroute?idTruck=1421415P
Cypher Query:MATCH path = (c:DistributionCenter)<-[:LEG_ORIGIN]- (r:Route)<-[:ON_ROUTE]-(t:Truck) WHERE c.id = 22 RETURN path limit 10


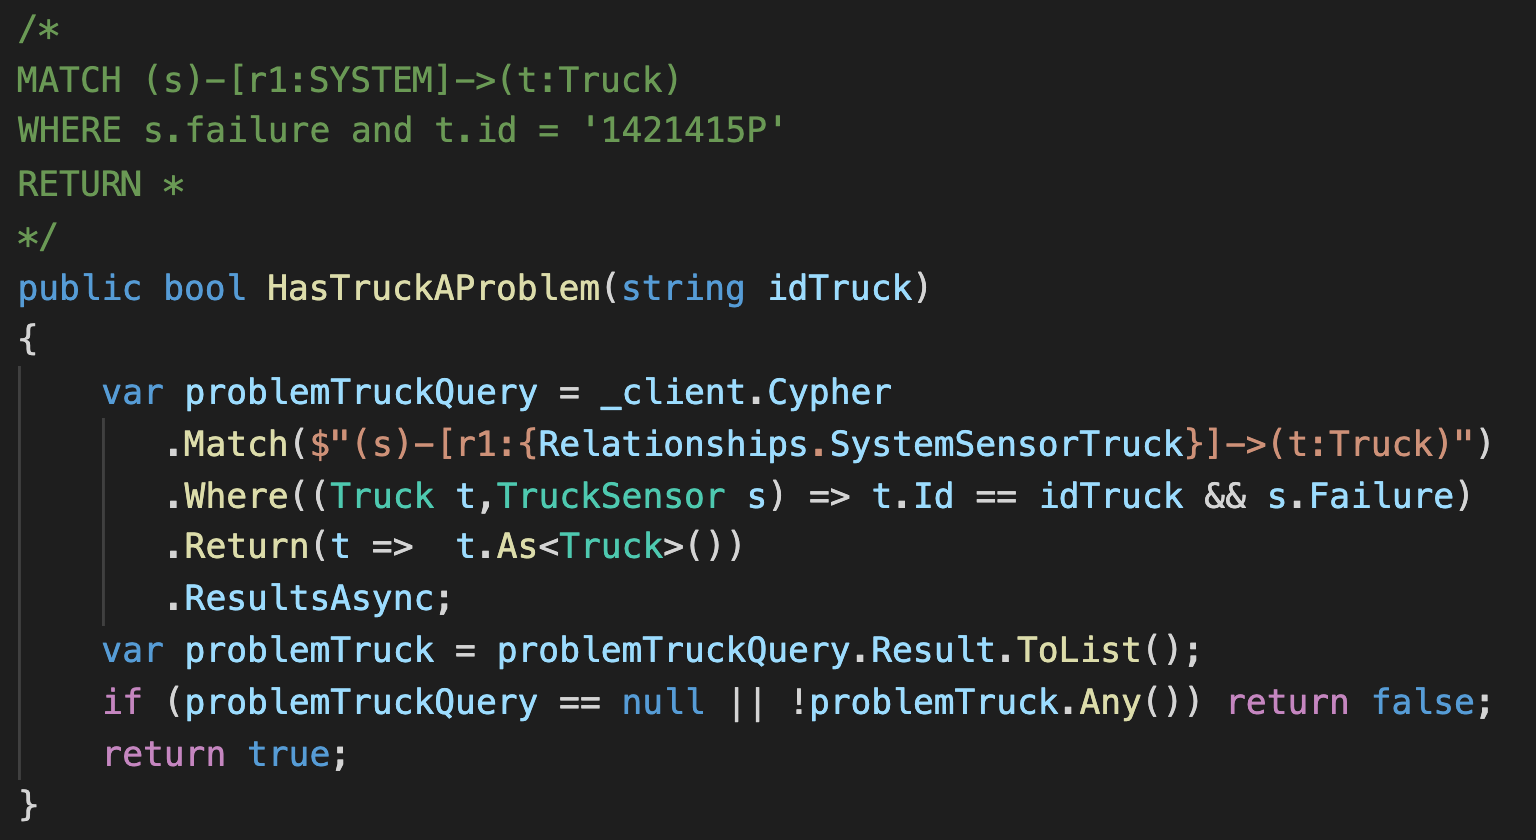
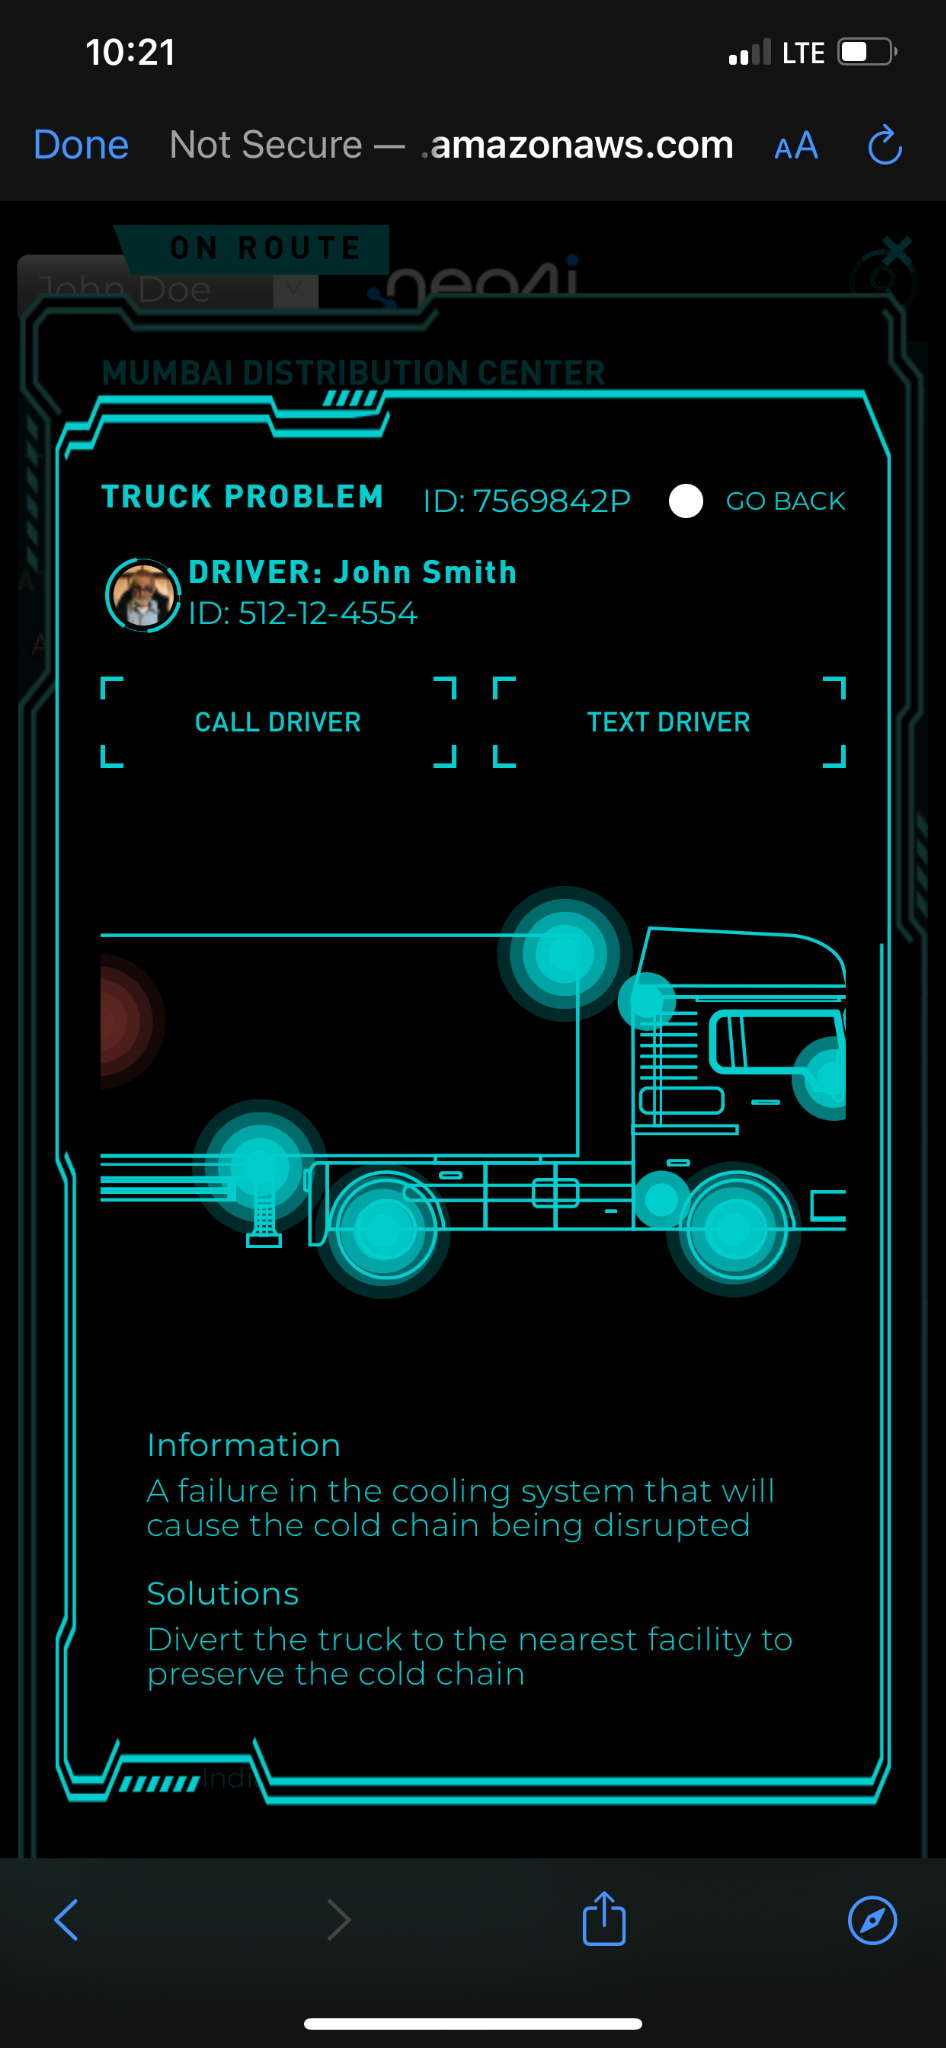
- Truck and Problems
Code:Neo4jClientController.IncidentDetailsAndSolutionOnRoute
API: /api/neo4j/incidentdetaisandsolutionfortruckonroute?idTruck=1421415
Cypher Query:MATCH (s)-[r1:SYSTEM]->(t:Truck) WHERE t.id = '1421415P' RETURN *


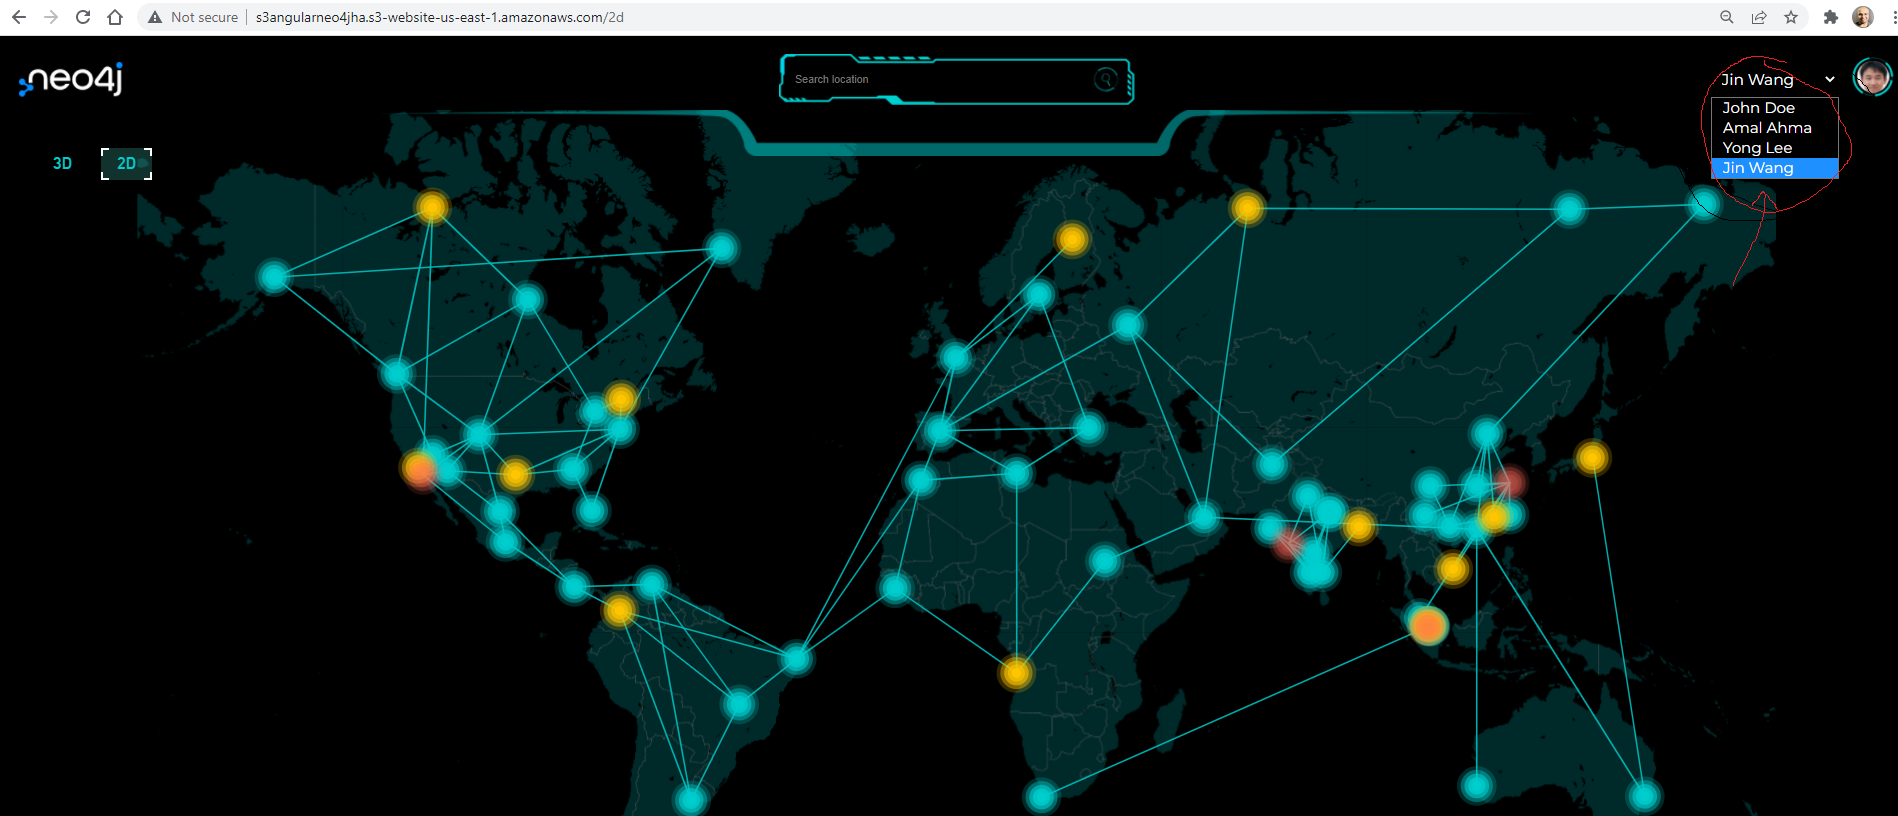
Interactive web application that supports multiple cities (globally distributed)
The demo covers four major cities today:
- San Diego, California, USA
- Singapore
- Shanghai, China
- Mumbai, India
You can toggle between each distribution center and city by changing the login credentials drop down (as shown in red in the top right corner) of the distribution center manager.
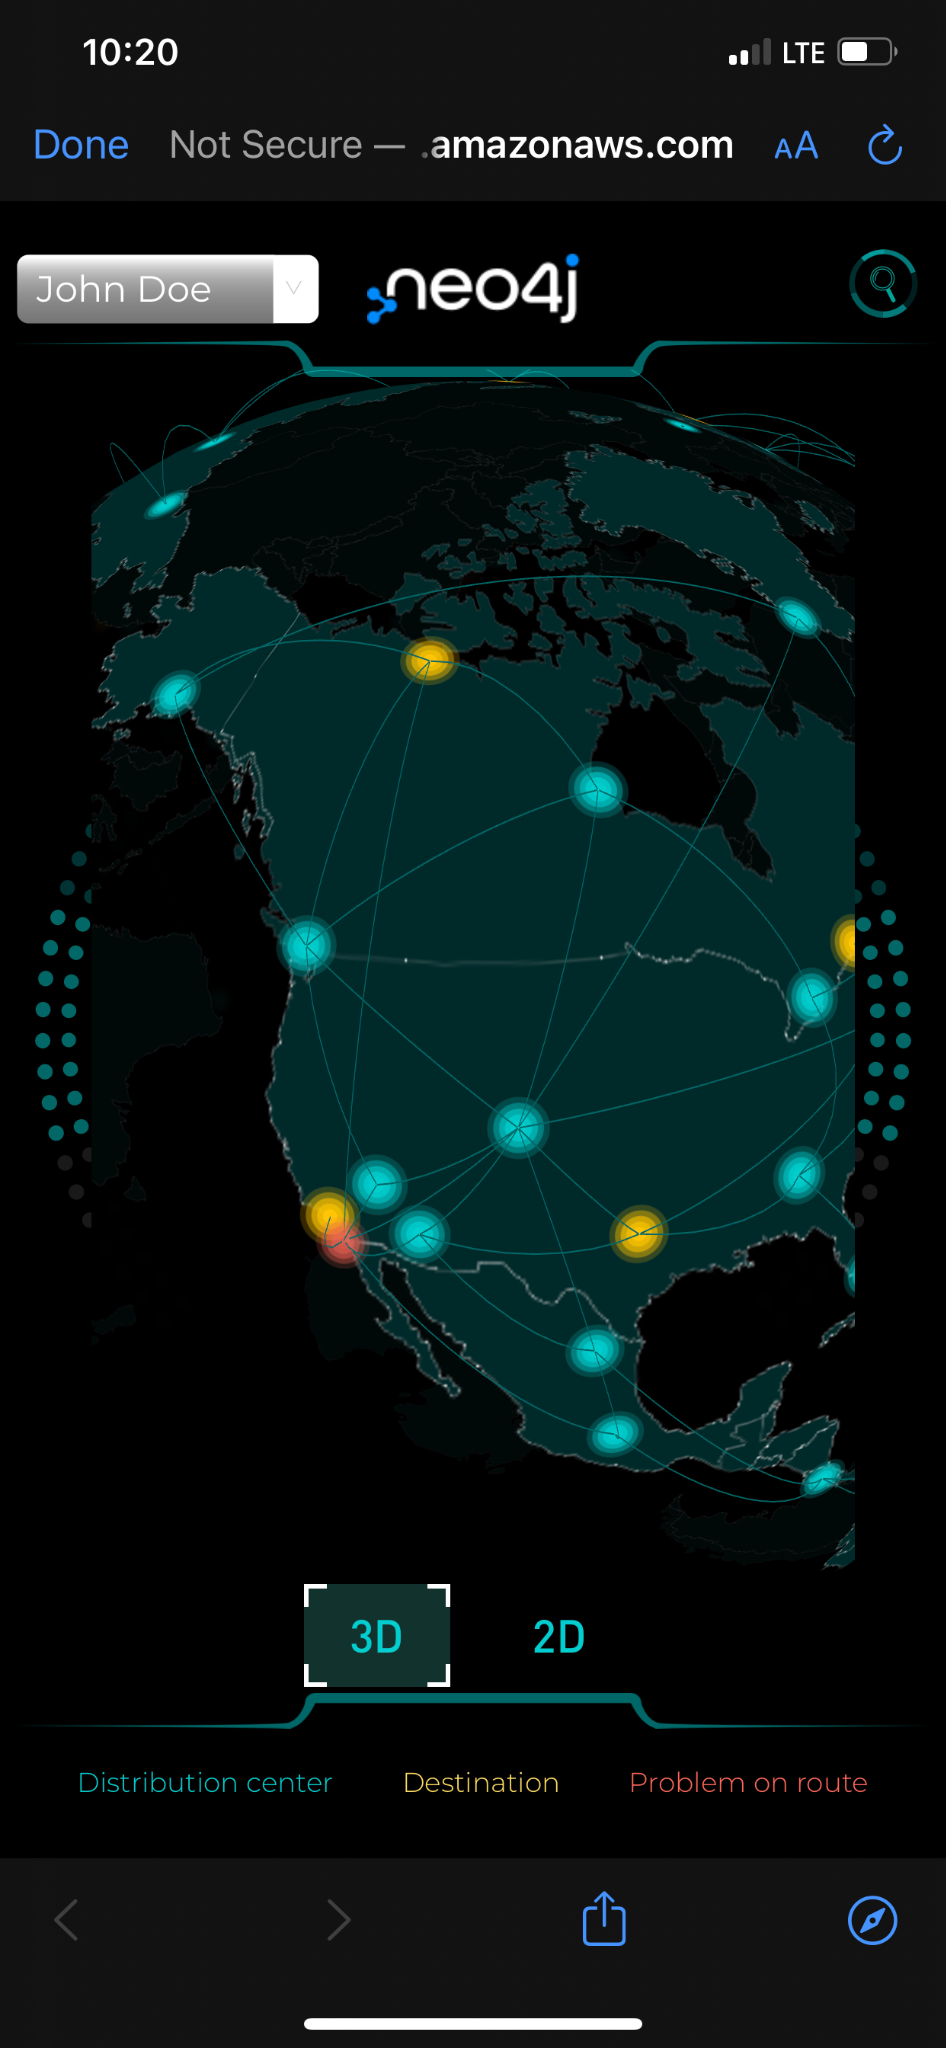
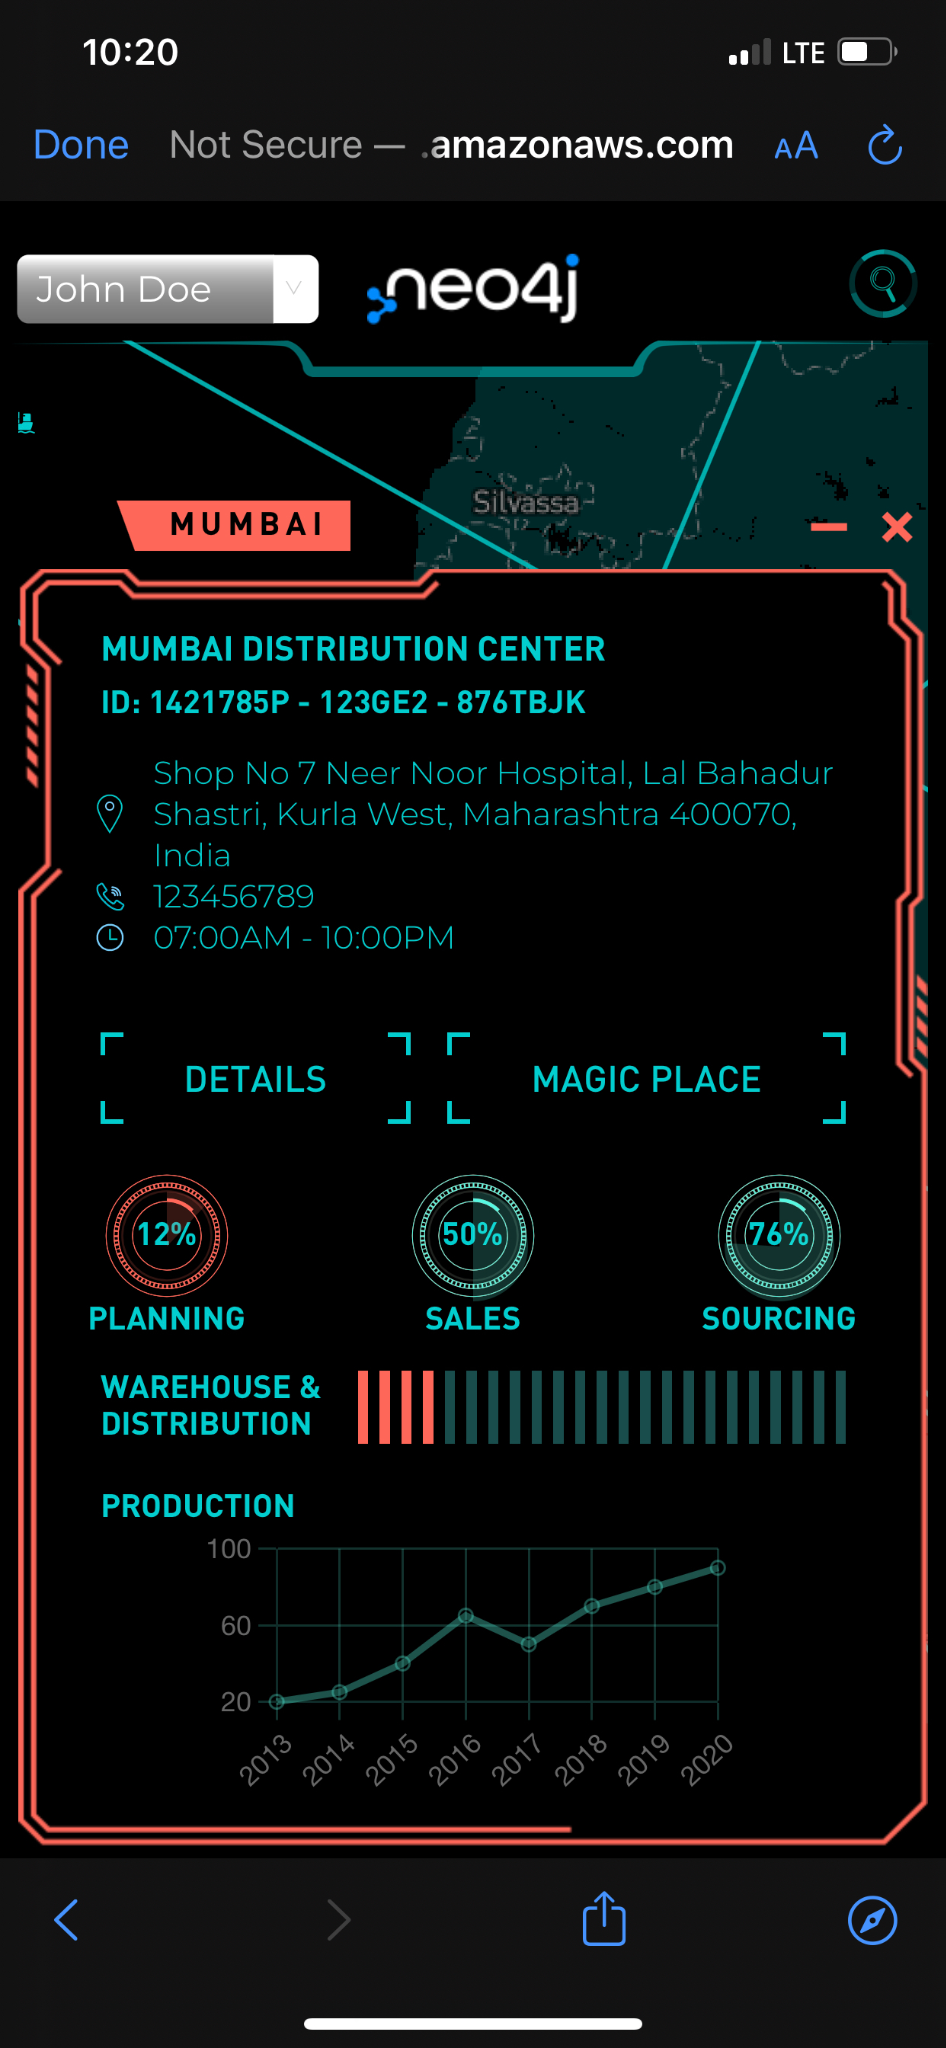
The demo is a responsive web application and is enabled for mobile devices. Here is what the experience looks like on mobile devices. This is to ensure that one can use the application anywhere, anytime, and from any device.
Conclusion
Well, we hope this demo will help you build a global supply chain application using real-time analytics on top of Neo4j’s highly scalable and secure data platform. We hope the deeper look at some of the challenges that can affect cost control, planning and risk management, supplier-partner relationships, and consumer demands – and how they are being addressed using Neo4j graph databases and real-time analytics – was eye-opening.
Resources
To learn more about the demo and supply chain:
To learn more about graph databases hands-on:
Community chat and forum:
Note: This is a demo, and the idea is to show an end-to-end application scenario and the world of possibilities with the Neo4j graph data platform.
Get your free copy of the white paper Graph Data Science Use Cases: Supply Chain Analytics.
Share Article


Explore
Related Articles

1 of 3: The difference between a graph, a knowledge graph, and a context graph

2 of 3: Why graphs, knowledge graphs, and context graphs matter to customers
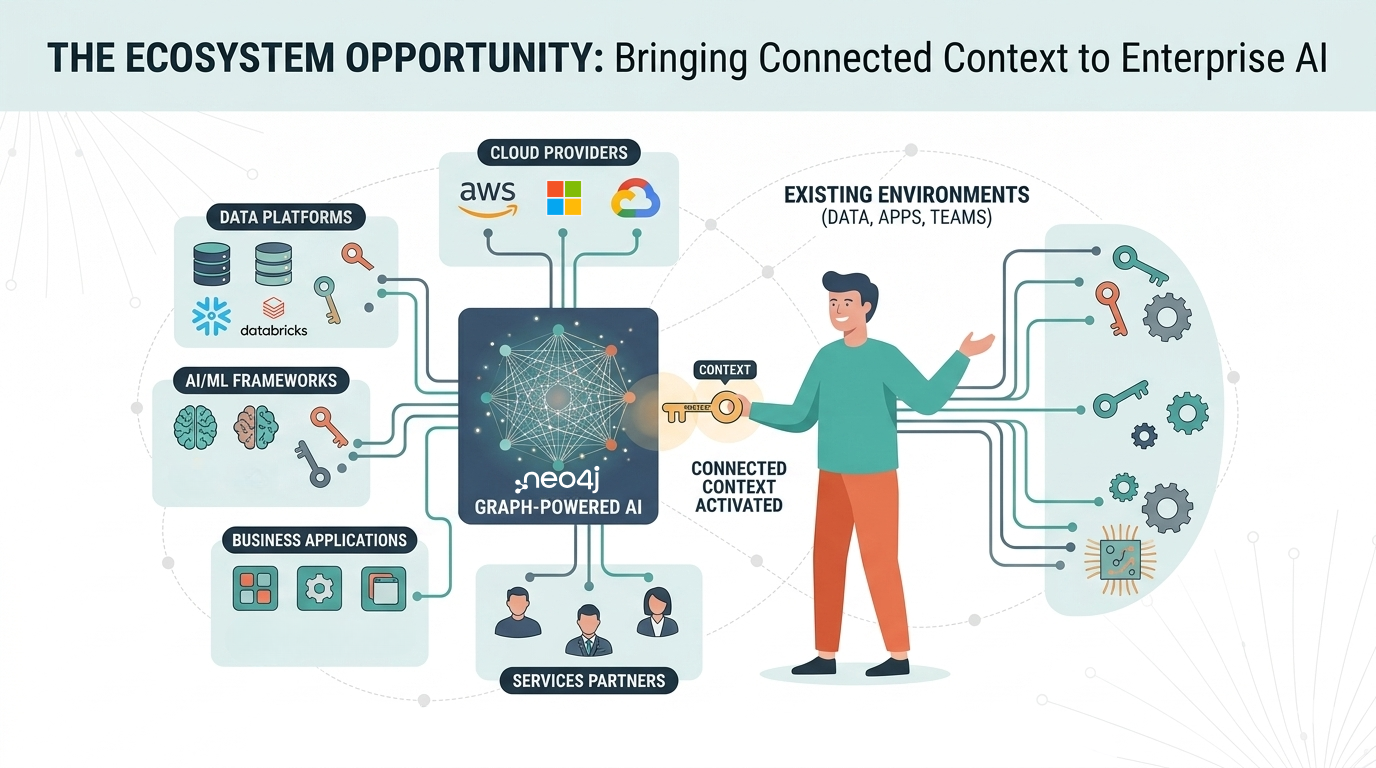
3 of 3: The graph ecosystem: Bringing connected context to enterprise AI
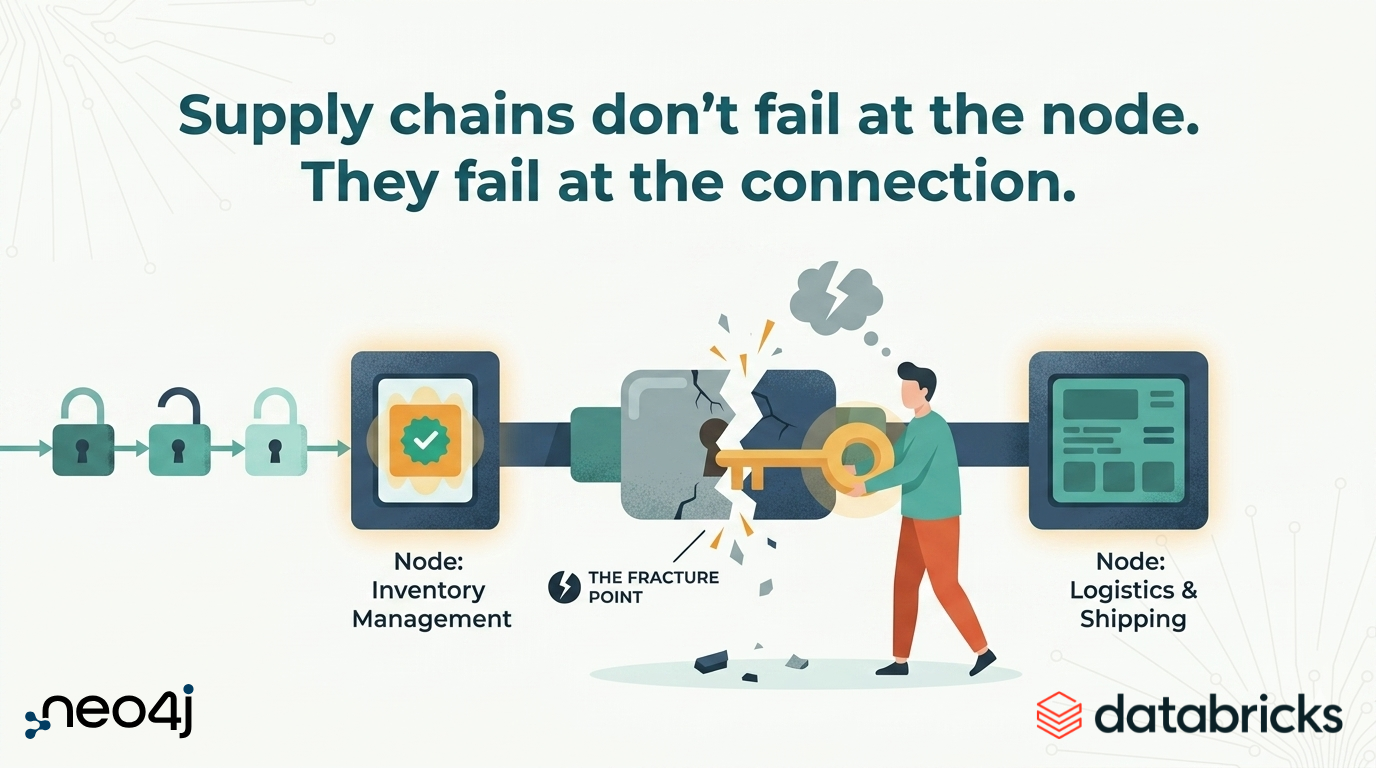
Supply chains don’t fail at the node. They fail at the connection.