Detecting cryptocurrency fraud with Neo4j

Technical Sales, Cambridge Intelligence
7 min read

Criminals are constantly finding new and more sophisticated ways to commit fraud. Every technological development presents new opportunities for illicit activities, and few more so than the evolution of digital currencies.
As cryptocurrency is likely to play a big role in the future of finance, link analysts need graph visualization fraud detection tools that are up to the job.

When you visualize a Bitcoin block you spot distinct shapes and patterns right away. What do they tell us about the data?
In this post, we explore how graph technologies help analysts understand patterns and outliers in Bitcoin transactions.
30-second intro to Bitcoin and blockchain
Bitcoin launched in 2009 as the world’s first cryptocurrency, and there are now over 17 million bitcoins in circulation. In the last 12 months, the number of confirmed transactions taking place every day has never dropped below 268,000.
Unlike traditional fiat currencies, backed by institutions like banks or governments, the value of Bitcoin is based on the trust users have in the system.
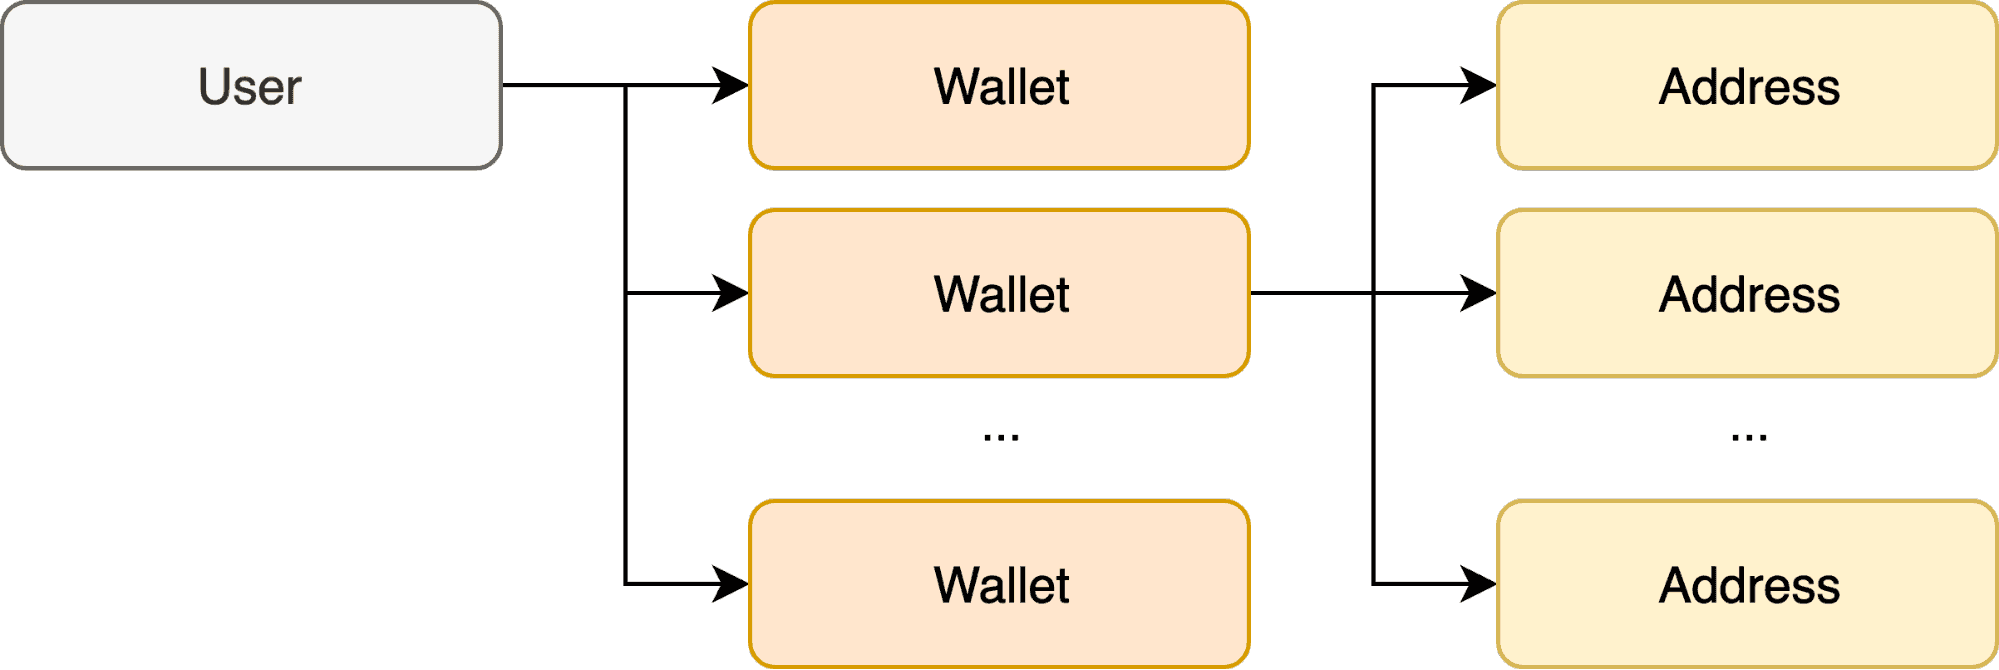
Blockchain technology underpins that trust. With blockchain, every transaction record is timestamped and visible to every other node in the network. Take this basic example: An anonymous user mines bitcoins and sends them from their wallets as transactions, each with an input and an output address.
Graphs are everywhere, even inside Bitcoin’s public ledger.
To stop other users from questioning the validity of a transaction, Bitcoin uses blockchain to maintain and protect the correct order of transactions in separate blocks. It shares details of each block with every other Bitcoin user. The entire dataset – right back to the very first transaction – is available to all.
But making it available is one thing. Making sense of it is a different story.
If Bitcoin is a graph, we can visualize it
Bitcoin data contains a vast and complex network of connections. How can we understand it better? What does a typical transaction look like compared to an unusual one? How do we avoid getting lost in the giant wall of blocks?
There’s a serious reason for understanding Bitcoin data. From money laundering to monetizing ransomware, buying illegal goods to fraud scams, criminals use it as a secure, low-cost anonymous way to transfer funds quickly and easily.
How do link analysts understand Bitcoin transactions? What patterns of behavior must they look out for?
Bringing Neo4j data to life
When you need to understand a network this huge, Neo4j’s highly scalable graph database and our powerful graph visualization toolkit technology complement each other perfectly.
Here’s a chart of Bitcoin transactions over a six-minute period. We took block 611900 from blockchain.com’s API and followed this great guide to import it into a Neo4j graph database.
Finally, we visualized it using KeyLines, our graph visualization toolkit for JavaScript developers.

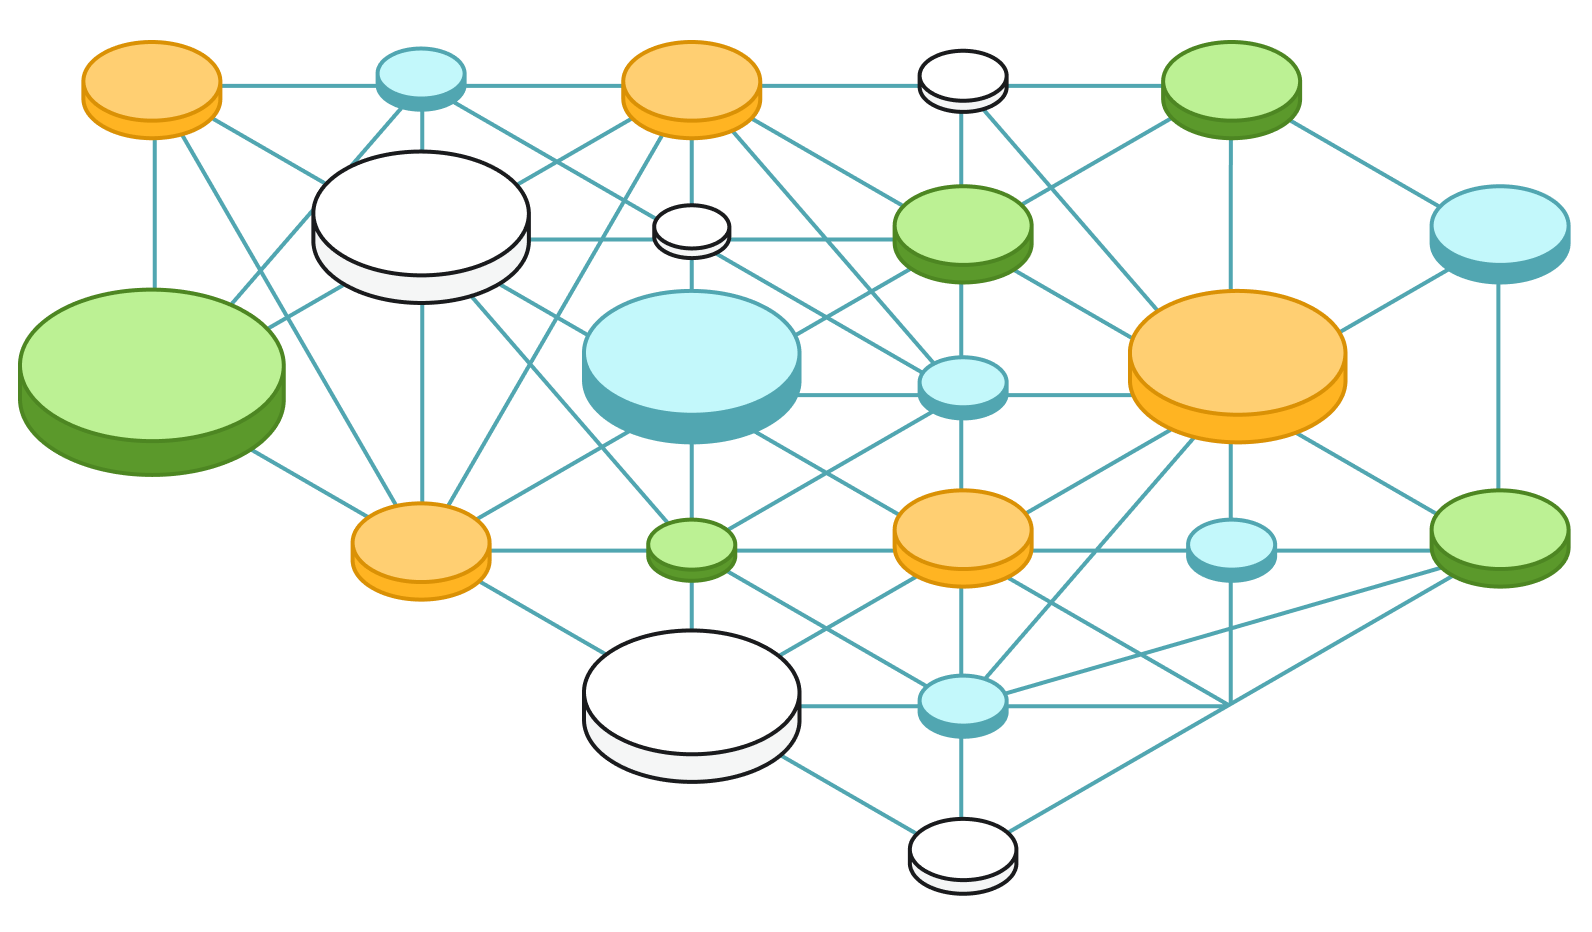
This KeyLines visualization of a Bitcoin block provides a natural, more organic feel for the overall shape of the data.
From this automatic organic layout, we get a good sense of the network structure. The majority of transactions between one or two other addresses exist on the periphery, but the more unusual and interesting transaction patterns are centered so they stand out more.
Standard Bitcoin transactions explained
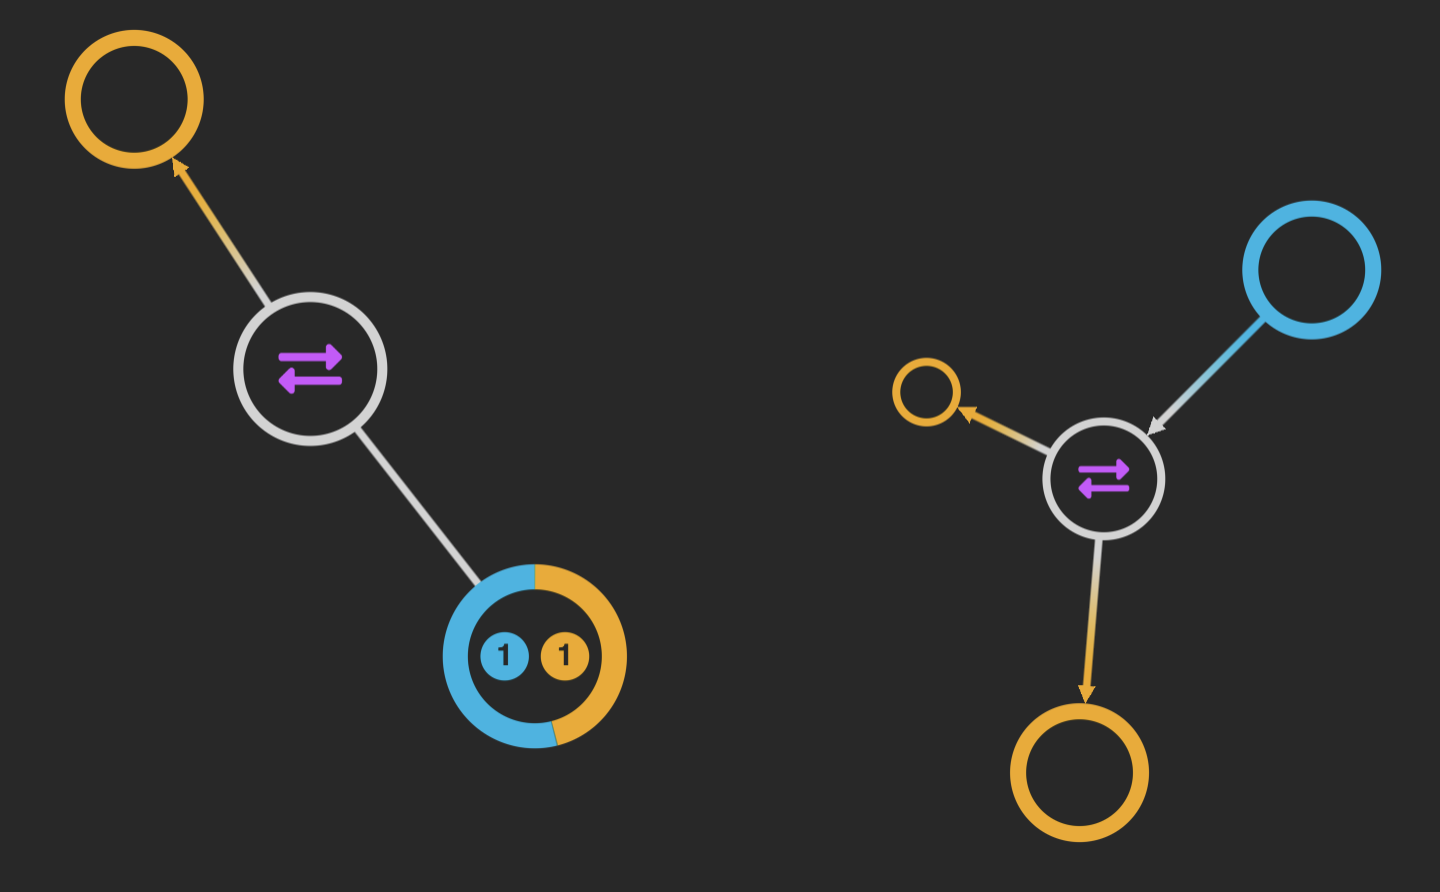
We’ve used simple, effective styling to customize nodes representing inputs, outputs, transactions and shared addresses.

With simple styling, it’s easy to identify different types of nodes.
Every transaction has an input, output and value.
Understanding the nature of Bitcoin transactions helps fraud analysts identify patterns more easily.
In the example on the left, the transaction input and output share the same address, so the node is blue and orange. This typically means there was change owed from the original payment.
The example on the right shows a standard transaction where bitcoins moved from one address to two others. Using clever node sizing, right away you can see the value of one transaction was far greater than the other. By keeping things simple and avoiding labels, we don’t clutter the chart with too much detail upfront.
But what if it’s the details you’re after?
No problem. Click a node and KeyLines sends a Cypher query to the Neo4j database requesting more information:
MATCH (tx:tx { id: '$id' })
RETURN tx.type,
       tx.hash,
       apoc.text.join('B', str(tx.btc),' / ','$', str(tx.usd)),
       apoc.temporal.format(tx.dt, "dd MMMM yyyy HH:mm")
KeyLines displays the additional information we need:
- Type: Transaction
- Hash: ada14b0b9ee7d1da10e1d4a59…
- Value: ₿286.59814577 / $2,960,447.07
- Time: Wed, 08 Jan 2020 12:55:21 GMT
Visualize irregular network activity
Unusual connections in a network are worth exploring.
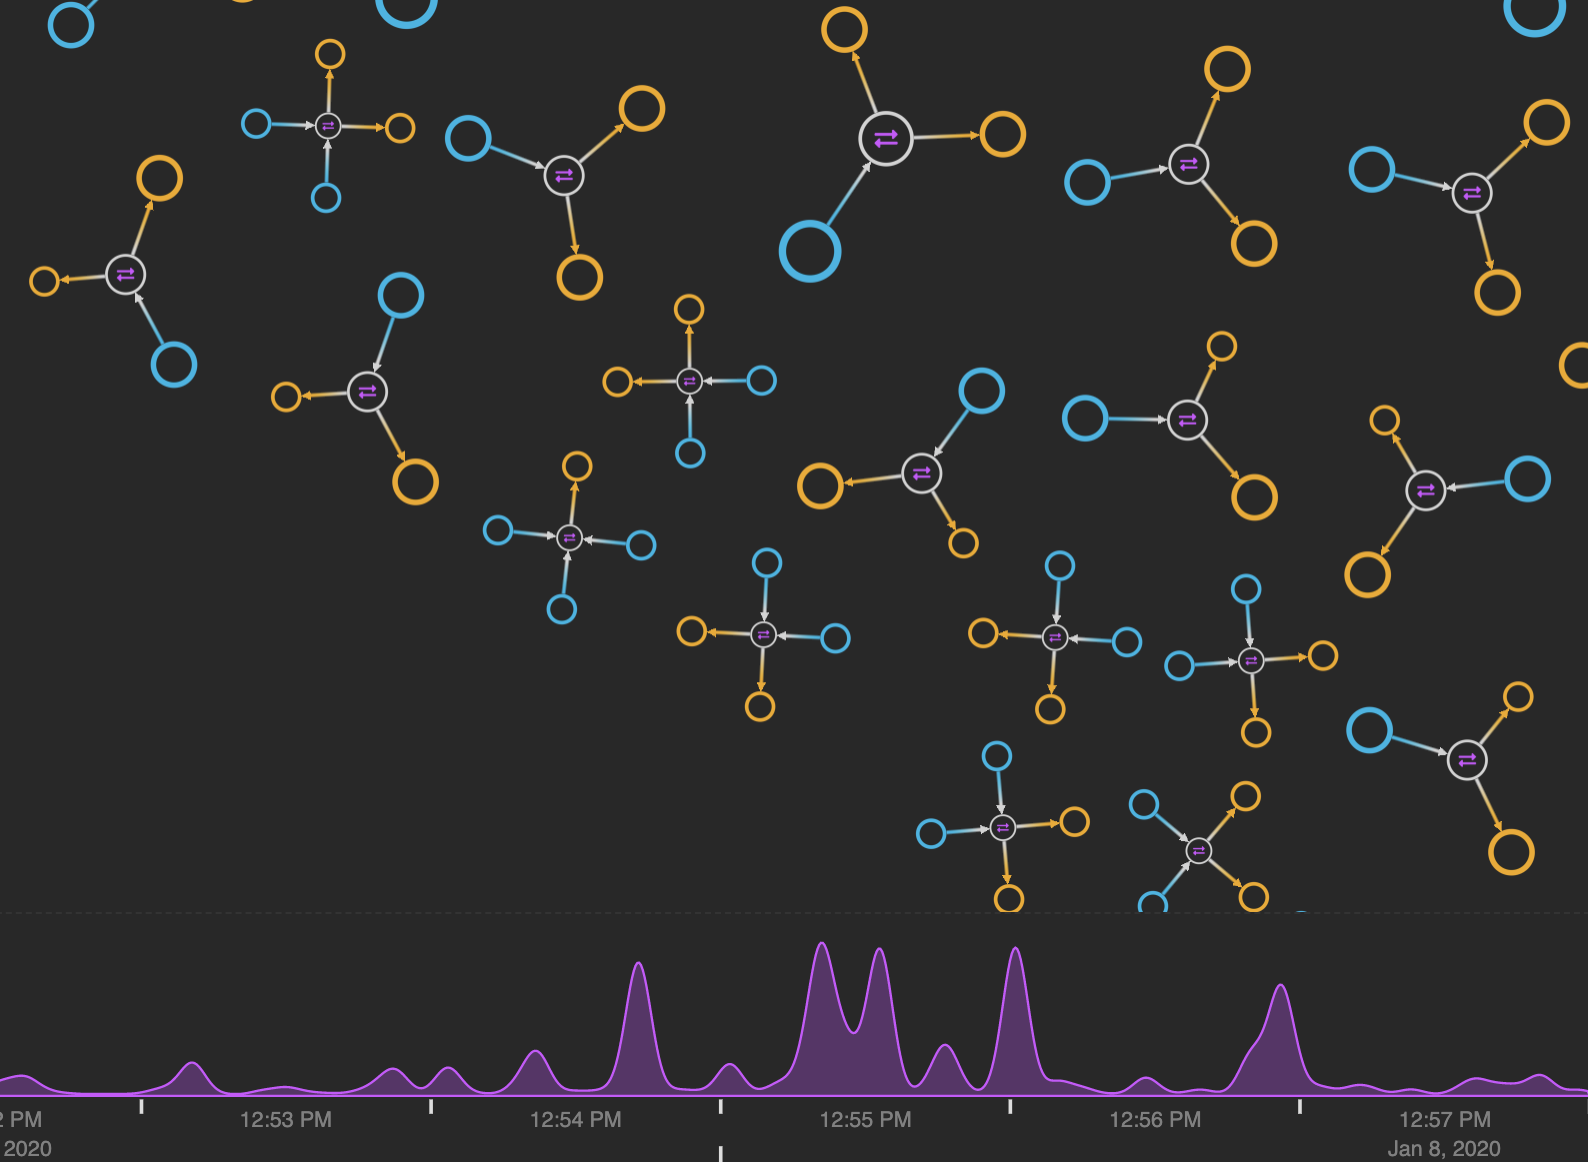
In this example, the transactions transferred two large sums of money totaling US $72,000 to the same shared address. From the purple time bar below the chart, the large peak shows us they happened within one second of each other.
Large transactions may feature many addresses combining their resources, which could explain the number of blue input nodes linked to each. This doesn’t necessarily mean the inputs came from different people though. Users often generate a new address for every transaction to help stay anonymous.

Fraud analysts need to know when unusual transactions took place. The time bar makes it easy to visualize time-stamped blockchain data.
Understand transaction patterns
Transactions are either:
- Automated: For example, when a cryptocurrency investor uses a trading bot to buy or sell bitcoins at the best price.
- Manual: For example, sending bitcoins from one wallet to another in exchange for goods or services.
Cryptocurrency fraud analysts look at huge volumes of historical data spanning long time periods. Our focus is on a six-second block, which makes it a little harder to know for sure whether we’re looking at automated or manual transactions. But we can recognize patterns to help us understand what might be happening.
When the same bitcoin moves quickly between addresses, it forms long chains in the data. When it happens inside a short time frame, it’s likely to be a series of automated payments. A closed loop means the same account is involved in multiple transactions.

Unique or unusual shapes in the graph data are much easier to spot in a visualization.
For easier analysis, our automatic sequential layout displays these transactions in chronological order.

Same data: clearer layout. You can recognize the ordered sequence at-a-glance.
But what about the closed loops? They’re easier to spot once we’ve styled them with red or green “donuts.”
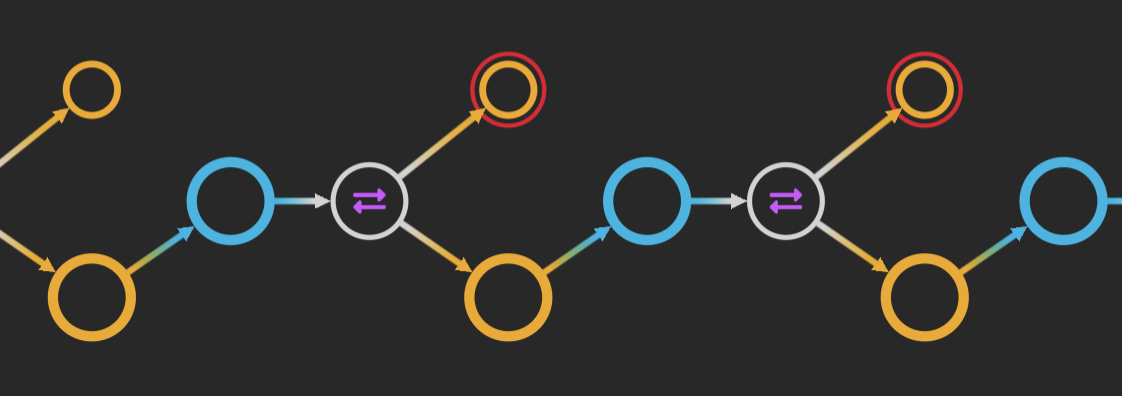
Customized nodes tell you more about the data without cluttering the visualization with loops or labels.
Remember our initial organic view of the entire dataset? The majority of transactions were between a small number of other addresses and existed along the outer edge of the visualization.
These transactions occur at irregular times and involve fewer inputs and outputs. Are they manual transactions or one of a series of automated ones?
Manual transactions tend to be small, disconnected components in the visualization that don’t share addresses with other transactions in their block and happen at irregular times. That could be what’s happening here, but analysts would need to explore data over a longer time frame before reaching a definite conclusion.
Compare that example with these wheel-shaped transaction patterns:

Uniform ‘wheels’ of data in our 6-minute block suggest automated Bitcoin transactions.
These transactions either originate from or target the same address over our fixed time frame, which suggest that they’re automated payments.
Visualize your largest graph datasets
Graph visualization is perfect for spotting patterns and anomalies in intuitive and interactive ways. It reveals insights that’d be hard to detect in an unintelligible list of anonymous transactions.
Through seamless integration with Neo4j’s graph database, our toolkit technology can bring your biggest, most complex graph data to life.
Share Article


Explore
Related Articles

A workbench for teams to query, explore, and visualize graph data
Fraud rings hide in the connections: Graph-Enriched Detection for Databricks Genie with Neo4j

Hey LLM, you’re using OPTIONAL MATCH wrong. Here’s the Cypher that actually works.