
Driving Innovation and Powering Advanced Analytics with Neo4j

VP of Analytics at Realogy Holdings Corp
17 min read

Neerav Vyas is the Head of Analytics at Realogy Holdings Corp. As an economist and a Neo4j user, he helps clients with graph analytics.
In this presentation, Vyas illustrates how the journey of real estate should be a connected process and shares the story of his own move to New York City.
He explains the current real estate landscape, from finding an agent for buying/selling/renting, to finding a home in the right neighborhood for the right price. The process consists of aggregating and curating various bits of disparate data over an unlimited amount of time, sometimes even involving AI and machine learning.
Vyas describes how using Neo4j has helped Realogy Holdings Corp match customers with the right agents for the job with effective data queries to drive lead conversion.
Full Presentation
My name is Neerav Vyas. I’m the Head of Analytics for Realogy Holdings Corp. For most of my life, I’ve been a management consultant helping clients and customers become more innovative, develop new growth strategies and become more customer-centric.
As an economist by nature and by training, most of my work and experiences come from helping clients in their analytics.
Back when I first started, this help was through data mining, predictive analytics and then smarter analytics. Over the past few years, we have moved on to machine learning and artificial intelligence.
Approximately a year ago, I did what most foolish, ambitious, sometimes courageous management consultants do: I went internal and I went native. I was asked to be the Head of Analytics at Realogy Holdings.
You may not know what or who Realogy is but you’ve probably interacted with us in some way. We are the world’s largest residential real estate company, relocation company and title management company.
In New York City: Sotheby’s Real Estate, Corcoran, Century 21 and Coldwell Banker are our brands. Nationally, we also have Better Homes and Gardens, Climb Real Estate and then we own a relocation company called Cartus. Cartus helps most of the Fortune 2000 companies relocate and move their customers. If you have worked with one of these companies, you may have worked with Realogy.
Realogy is a very complex organization. On top of that, we were a legacy corporation that once owned Wyndham Hotels and Avis Rental Cars. I say this because our company has a history of being a holding company that buys up bunches of random companies and then develops silos around them.
Real Estate
I came in to lead an enterprise analytics function knowing that we were going to have lots of siloed business units, fiefdoms, domains, legacy systems and challenges. We were all looking to move to the cloud because we want to use AI and machine learning and do all the cool things that come with that. I thought I would solve this in my first year.
Let’s think about the principle part of our business: help people find homes, whether that is to rent them or buy them. We have two essential arms.
We have our franchise business. You are able to open up a Coldwell Banker franchise, recruit agents underneath that and start selling homes. We have our own agents too. They are part of our own brokerage business, and they generate revenue for us.
If you think about the fundamental decision of buying a home and the journey that comes associated with that, it’s an incredibly disconnected process.
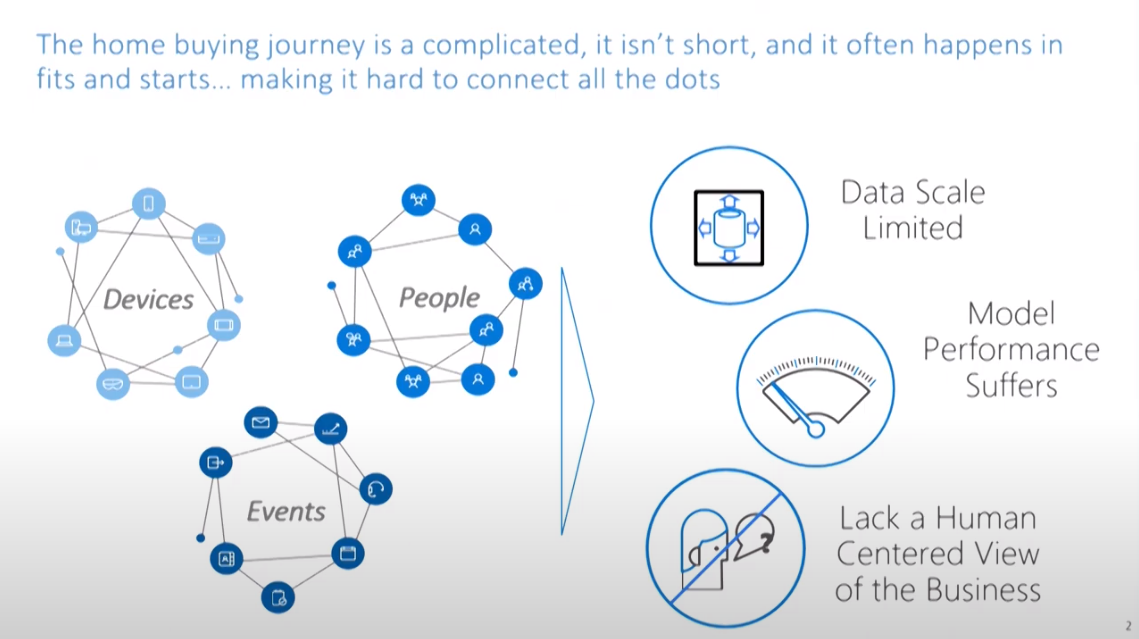
The journey comes in fits and starts, it traverses across lots of different devices, channels, and domains. You go to Realtor.com, Zillow, StreetEasy and Coldwell Banker websites. These are a lot of different entry points. You’re searching for your home or your rental property in a lot of different ways.
Eventually you may end up interacting with an agent or a broker, depending on where you’re looking. If you’re looking in multiple towns and the agent you’re working with doesn’t cover all those towns, you may need two or three agents to work with you. You may use a different agent to buy or and another to sell your home.
The journey itself on how you buy a home isn’t always one consistent move. Instead, the journey comes in waves.
Neerav’s Move
In 2013, I proposed to my wife, and I moved into her bachelorette pad. I got 20 square feet of “closet space”, not in a closet, but in an IKEA wardrobe.
In the first year, we both thought it might be nice to get something a little bit bigger. But we were going to get married, and we did not want to move while planning a wedding. Then, we got married and then still dragged our feet to get the ball rolling on our move.
We reached out to an agent. We told them we were thinking about selling our place, and looking at buying a place. We had a couple of different ideas about neighborhoods in New York City. We were ready to start that journey.
Then life got in the way, we were busy, I was traveling for work. Finally, 2016 rolled around and again we noticed we were running low on space. At this point we were thinking about having a kid, this space is definitely not going to be enough for all of us. Now we really needed to sell our place and buy a place in the process.
We knew an agent in the building; we really liked him. He had a vested interest to sell this place at a high level because he gets a commission on it. He also lived in the building, so he knew the building and the neighborhood really well. We trusted him, and we went with him.
Next, we went with another agent that my wife worked with. She helped her buy her bachelorette pad. She helped us explore a bunch of different neighborhoods. She knew my wife’s style, aesthetics, and preferences. We worked with Vicky to help us navigate the home buying process.
We had two different agents, handling two different aspects of our relationships. We put offers on four different places, three of which went into contract, and then eventually fell out of contract. Eventually, we ended up buying and selling a home in Brooklyn. We finally bought a home in 2017!
This journey started with a moment of truth in 2013, migrated and was completed in 2017, with two separate transactions and two separate brokers. We did all of this with different CRM systems, different transactional processes associated with it and while different events were happening in our lives.
Real Estate Landscape
The real estate landscape is incredibly complex. As the world’s largest real estate company, our data is our biggest asset.
Our data and our skills are what allow us to leverage the value and the impact that we are able to make, not only in the industry, but for our business as well.
However, our data and skills are all fragmented and split apart. Further fragmentation by our brands makes it incredibly difficult to do anything really useful.
If we’re doing advanced analytics use cases, we are going to spend a lot of time just bringing the data together. Sometimes, when we’re bringing the data together, we find unresolved issues that make that harder for us.
Secondly, when we’re doing advanced analytics work, whether it’s feature engineering or developing models, the computational power required is incredibly high.
It takes a lot of time to train these models, do the EDA and do feature engineering. One particular advanced analytics use case helps us understand which agents are going to be most successful in any given three-year period. However, it takes us 60 hours to put the ETL together for this.
To give you an idea, there’s 1.3 million of our agents in North America. Each of them sells, on average, two homes per year. That means that there’s about 2.6 to 3.2 million transactions that we’re looking at in a given year. This is a large amount of data. It is not massive by any means, but large, complex and difficult to go with.
Now I start adding in things like, “Was the price readjusted? Did it change? Was the listing turned on and off? Did it change with the agent that was representing it?” We are starting to amplify that a little bit.
Next, we look at this data over any historical period; five, six, seven years. The data sets aren’t petabytes, but they’re large, difficult and unwieldy. It is hard to use legacy resources to pull data from SQL stores. Even the basic queries would take hours, that’s painful and additionally hard for us to do machine learning analytics on.
Most importantly for us is understanding the relationship between the customer, the agent and our own internal operations, this is really difficult.

We don’t have a true holistic view. It’s difficult for us to change the underlying business processes or the experiences that we want to engender, without having that holistic view.
As I came on board, I had a significant amount of experience with Neo4j in particular. I knew Neo4j worked well when working with a number of different clients on a number of different use cases. I realized that our pain point was a graph problem. However, I wanted to be very careful with how I went about solving those problems. I had a hammer, and I didn’t want everything to look like a nail.
I thought that one graph in particular might be able to serve multiple use cases. We felt we would be able to get a lot of value out of that, and drive that value, not just for the advanced analytics team, but for some of the legacy teams which were doing reporting and dashboarding for the other business units.
We asked ourselves, how do we start connecting all of these different channels together? How do we connect all these events with the different people and entities that are involved? From that, we wondered how we would enable this to drive value for our business?
Data Aggregation and Curation
Particularly, we have found four key areas and levers to drive value. The first and foremost is the data aggregation and curation.
Aggregation and curation makes querying faster and easier, it also simplifies that process from your business insights and analytics perspective.
We had a lot of analytical reporting on the average production of an agent.
This reporting asks the questions:
- What’s the profit and loss (P&L)?
- What’s the revenue my agent is bringing in?
- How does that revenue tie to an office, a P&L location or different profit centers?
However, I wanted to ask the question just slightly differently. I wanted to ask:
- What’s the relationship between people selling luxury homes?
- What is the difference between medium-value homes in a neighborhood versus high-value homes in that same neighborhood?
- What is the relationship between the profit margin and those types of homes?
I want to be able to make a judgment call and advise builders to invest in more affordable homes in an area because it’s more profitable for us. Perhaps affordable homes are selling faster. Or if we have too many super high-end luxury homes, there’s a risk to that if the market goes down, we want to make sure that we’re mitigating some of that risk.
I asked those questions just slightly differently on data that’s connected, and all of a sudden the queries were increasing. The queries increased in size, complexity and difficulty.
Validating the data becomes an issue, so for us, the data aggregation piece is helpful. Data aggregation helps us look at the data in a lot of different ways and makes life for the business analysts and the reporting folks a little bit easier.
Machine Learning and AI
Machine learning and AI covers the feature engineering components, the native graph algorithms we use and the ability for the feature to power machine learning algorithms. These are incredibly important.
One interesting insight we found using graph theory was that the number of relationships an agent has with other agents in our network is strongly predictive of whether or not we can mitigate attrition. If you work with more agents within our network, you’re less likely to leave us, we found that really fascinating. Clearly there is a lot of strength within those relationships.
On the flip side, if we have fewer offices in an area, the relationships – and the number of relationships agents have is fewer. While we’re doing all of this, we’re trying to develop these predictive models to reduce attrition. Keeping our valuable agents is really important to us.
That raises the question, as we are closing our offices to reduce operating costs, are we inadvertently affecting our attrition risk? If so, maybe the right answer is that we need to stop closing our offices. Or perhaps we’re closing our offices because of the relationships and the way our agents are doing business in those locations is different. They could be more mobile and in the office less. We really don’t know which is the chicken or the egg here.
The answer could be yes, having less offices helps our agents cultivate more relationships and deals, work together – this culture retains top talents and helps them be more productive.
In that case, we want to start thinking about ways we could change the business model, processes, manager interactions, etc. for our employees. This was an aspect of future engineering that drove our models and helped predict attrition, but then resulted in really tangible actions for the business to test out.
When using graph technologies, we are able to explain why the solutions are coming in. When a representative sees a list of agents that are recommended, they are able to double click on any one agent and say, “I see all the zip codes that this agent just sold in and all these zip codes are associated with the town that this customer is looking for or within close proximity.”
Call center representatives can see what agents are connected to a network of towns that are very similar to the type of town their customers are looking for or that sells these types of homes.
Machine learning is just another aspect of the versatility and the power of what we are able to accomplish.
The Users
None of this is useful if it doesn’t come into the hands of folks who are able to use it.
For us this comes in two pieces:
- Creating tools and solutions for our brokers and agents
- Creating tools that will eventually get exposed to the customers
Our goal is to help change the actual experience that our employees are going through.
Are we able to make their lives better, easier, faster? Could we provide more information to our agents to make their lives better, easier, faster? What would that look like and could a graph make life easier, more productive and explainable?
We want to use the graph to take an operational look at our back offices and get a true B2B-B2C view of our relationships. Additionally, we want to understand if the changes that we’re making actually have a positive impact.
As we think about machine learning and artificial intelligence, we want to test out whether the solutions we’re bringing into the market have a positive impact or not.
As we tried to AB test solutions, we would run into an issue. We had to ask ourselves what’s the market you’re solutioning in? What are doing in that AB test? Are we comparing apples to apples?
In one case we’re looking at Atlanta. We don’t want to compare against two different markets because Atlanta has too many variables for us to compare. Then the question was, how do we split that market?
We don’t want someone to go to one office in Atlanta, and then get a different experience and a different set of answers than in another office in Atlanta. That’s problematic for us and doesn’t help.
We came back and asked, what if we use graph analytics?
We know how to understand which markets and offices are similar, and then use that to create a more informed AB test. This is another way that putting the data together in graphs helps facilitate better experimentation and better design. Ultimately, this makes it a little bit easier for us when we validate our results.
Leads Use Case
This specific use case revolves around leads.

The issue that we’re dealing with is lead conversion. We provide leads to agents and that’s incredibly valuable. We have agents from lots of different brokerages. We provide them with a substantial number of valuable leads.
These agents give us a bit of their commission for those leads. Therefore, these leads are a higher opportunity for margin perspective and they’re more valuable to the business as a whole.
Unfortunately, our lead conversion was incredibly erratic. As we started to investigate the process and understand the experiences going on, we found out that we’ve got a call center that’s basically allocating leads.
The call center is going through the leads, but they’ve got a really hard time. They get leads coming from lots of different systems, because of the legacy environment that they’re dealing with. They have to copy and paste data, and then they have to move that data into two or three other systems.
Finally, when they go to the search window to look for an agent, a very long list comes up. The list is based on information that the agents put in, it’s not very easy or intuitive.
The call center can’t easily compare and contrast the agents that are coming through. The call center agents could do it manually, and look for the right agent.
Or they’re going with the agents they know and just tossing a bunch of leads to their friends. The agent that’s being recommended might not be the right agent for that customer, that transaction or that neighborhood.
Ultimately, none of this was an informed decision.
We chose to make the employee experience better and faster. By doing so, we provide better recommendations to our own customers and improve our business value.
What do we actually do when we put this data together around leads?

We’re able to connect our lead systems and our leads databases. Now, when a service center representative looks at the data and the agents, they don’t have to worry about going through 15 different transactional systems.
They are able to see the agent and the agent profile. Then they are able to match the agent profile with what the agent actually did: how they performed, and what information is coming through. If we wanted to do data queries for them, they could do it very quickly, and look at them in a couple different ways.
Data Queries
When call center representatives do a search for an agent, they find zip codes in the agent’s profile. Ideally, this should represent the zip codes that the agent is operating in. However, depending on the agent, this could be really thorough, complete BS or it could be a wish list. We don’t really know.
Now, we’re able to connect this and see where the agent actually does transactions and where their home office is. We are able to create features based on the proximity to those different elements. Now, it’s incredibly unlikely that when a call center representative does a search that there isn’t an agent within the proximity that they’re looking for.
This doesn’t require them to have inherent knowledge of the various neighborhoods and the towns. We connect all of that for them, which makes their lives easier and helps them make much more informed decisions.
We are also able to look at different perspectives. We are able to ask what happens with agent recommendations based on distance? Is distance more or less important? Is the town more or less important? How would the recommendations be that I’m creating change?
That ties into the tool for our call center representatives in particular. They have a customer and certain information for that customer. You think you know what’s right and what’s most important for them. Let’s make it as easy as possible for you to see what the recommendations would be based on what you think is important.
If you think the sales price is most important for this customer and you know agents that sell within that price range in that neighborhood, then the graph will give you a list of agents that sell in that price range. This same query works for proximity, neighborhoods, etc.
The benefit in a native graph was we could actually make it so that these call center representatives could change those weights on the fly and see that recommendation change in real time.
That in itself was incredibly powerful to drive adoption and experience. Call center representatives now spend more time on our system because they enjoy the experience. At the end of the day, they’re getting a better set of recommendations based on what we know about the agents at the time.
This allows us to not only move from the lead to the agent that’s most likely to convert, but to build upon this further. Conversion will improve itself, and the rationale for working with our agents will be stronger because the agents will be picked based on customer preferences.
We work with lots of different consumers, personas and attributes. Having that dimensionality creates a better experience and matchmaking process between our agents and our consumers.
That’s just the business side of it from the agent to the consumer.
Now we flip it and say, “I’ve got managers for these agents. What’s the personality profile and management style of my managers?”
How does that then relate to the behavior profile of my agents? Could I use this to not only match agents or customers, but agents to managers?
I could better associate agents with managers that will improve their performance, or provide them with better coaching or support. Maybe the types of managers I’m providing to my agents will change as the agent progresses and matures across their career. This provides a greater degree of operational insights to our field team.
I have a selection of agents that are eligible for these leads. Some of them do a really good job, others don’t. Our top quartile agents convert roughly 12-14 times more leads than the bottom quartile. Our top half of agents converts by five to six times more leads than the bottom half.
First, we want to stop giving leads to people on the bottom half, that improves business performance already.
Now we ask ourselves if we want to coach the people in the bottom half. Do we figure out why they’re not doing as good of a job or just take them out?
Secondly, how do we find more top quartile agents? What’s the difference between high and low performing agents in our network? Could we create a data driven process to bring in more high performers?
Once I know an agent is able to convert leads quickly, I could include them into my leads program, and gradually make agents eligible for more leads. Now I could use this to make informed recruiting decisions.
We will know to start recruiting certain types of agents, because we will know that they are going to grow faster, convert our leads and be our future performers.
Conclusion
What started off as an initial use case to help drive lead conversion, morphed into something far larger. There’s an aspect centered on customer spirits and customer transformation. We also covered employee transformations. With graphs, we are able to drive operational performance and recruiting. Then there is employee management to give them better guidance and feedback.
I think these opportunities speak to the incredible value of graph databases and Neo4j in particular.
Get the book Graph Data Science For Dummies for free now.
Share Article


Explore
Related Articles

What Are the Different Types of Graph Algorithms & When to Use Them?


Neo4j Expands AWS Collaboration With New Competencies in Finance, Automotive, GenAI, and ML

GenAI Graph Gathering 2.0: The Evolution of GraphRAG

