7 Reasons Why Effective Compliance Management Is Only Possible with a Graph-Based Solution


14 min read

Editor’s Note: This presentation was given by Christian Tsambikakis, Manager Director at KERBEROS Compliance, Julian Schibberges, Managing Director at Bernstein Group, and Axel Morgner, Co-Founder and CEO and Structr, at GraphConnect New York in September 2018.
Presentation Summary
In a world with drastically evolving regulatory requirements, corporations of all sizes are facing the challenge of adjusting both their business processes and risk management practices. Companies with decentralized, multi-layered structures and huge customer bases inherit a constant regulatory demand for risk control and network transparency on a large scale.
Anti-money laundering (AML) compliance is more than just ticking a box on a spreadsheet, as violations can be costly, not only in monetary terms but also can result in significant damage to a company’s reputation and brand. A business-supporting IT’s challenges are that it needs to find a solution that is practical, cost-efficient and flexible – but most importantly, it needs to be effective. Companies need a detailed “x-ray vision” beyond the first layer of huge data to effectively understand, visualize, control and mitigate their risks.
In this post, Christian Tsambikakis, Julian Schibberges and Axel Morgner review the seven reasons why creating an effective compliance management system is only possible by using graph technology. They will also present the upscaled solution they’ve built with Neo4j and Structr for one of the top international providers of sports betting and casino games, enabling them to detect, analyze, quantify, document and report suspicious connections and transactions between their customers and entities of their business partner network.
Full Presentation: Seven Reasons Why Effective Compliance Management Is Only Possible with a Graph-Based Solution
Welcome to our post about the seven reasons why effective compliance management is only possible with a graph-based solution. Our names are Christian Tsambikakis, Julian Schibberges and Axel Morgner. Christian is the Managing Director KERBEROS Compliance, Julian is from the Bernstein Group, and Axel is the founder and CEO of Structr, an application platform on top of Neo4j.
Together, we’d like to show you what we’ve done in the past few months, and explain why it’s a good idea to use graph database if you want to build an effective solution for compliance and risk management.
Let’s start with a simple, pretty private question. Did any of you do some money laundering in the past weeks and can explain to the group how it works? Alternative question: Does anybody know Walter White, the main character from “Breaking Bad”? What did he do with the crystal meth money?
Well, he spent it all on a car wash. Walter White really did money laundering by the books. When we look at how money laundering works, we normally talk about the following three stages:
Three Stages of Money Laundering
The first is the placement of illegal or “dirty” cash into the legal financial system. The second stage, layering, is where you disconnect the illegal source from the money. Third, you re-invest the money into the business cycle as a seemingly legitimate source.
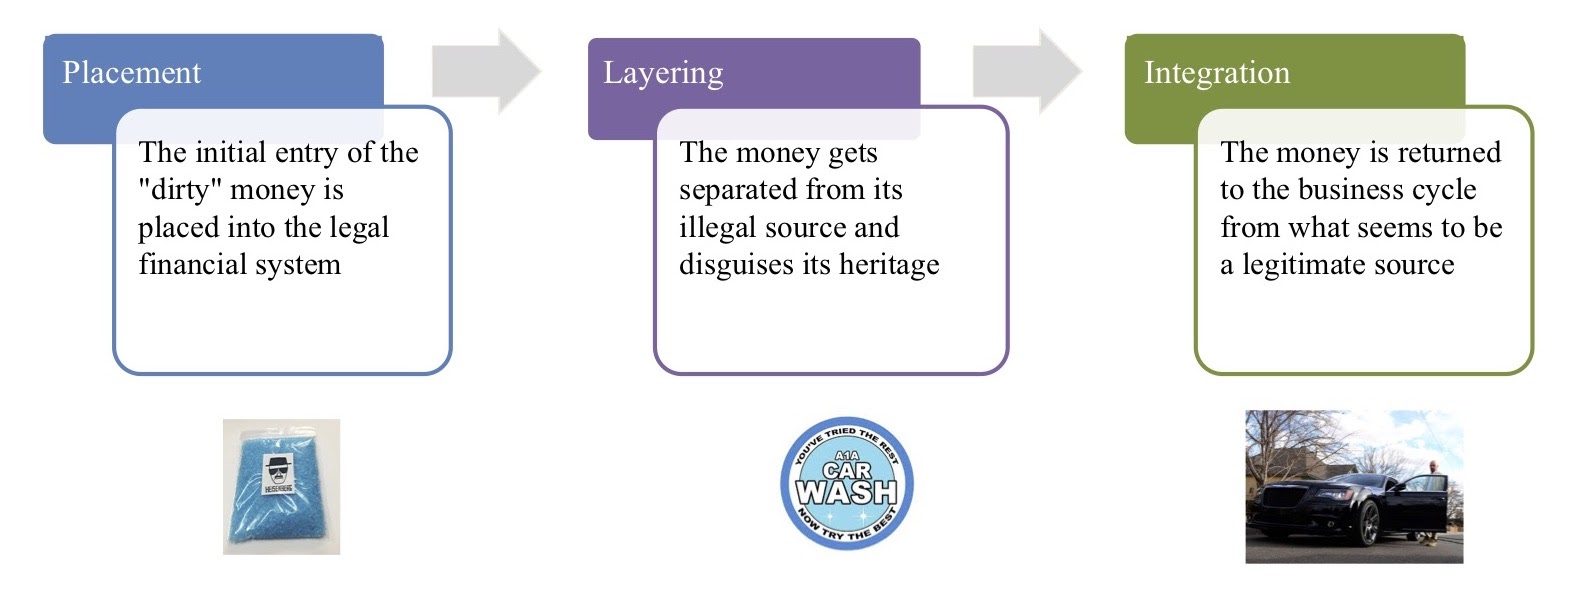
In Walter’s example, he takes all the cash from the meth, puts it into his own car wash through the books, pulls out the money from the profits and buys himself a nice Ford Mustang.
How Big Is the Problem?
If we’re looking at the global scale of money laundering, it’s massive. We’re talking about 2,000 billion U.S. dollars – or two trillion U.S. dollars – annually across the globe. In the U.S. alone, there are around 300 billion dollars. Nonetheless, it’s a global phenomenon. There’s no serious democracy in the world that’s not working to tighten their regulations around anti-money laundering (AML).

But, it’s not only an economical problem. When you look at terrorism financing as a part of money laundering, you’ll see that it’s also a societal problem, a political problem, a security issue and a reputational problem.
Financially, its impact on businesses is quite heavy. Last year, two billion in fines were related to organizational AML failures. This is the company side of things, but it’s also a management liability. Chief executives and C-level decision-makers are personally liable if they have failures within their own company; the integrity of the company is damaged and the entire business may be disrupted.
And who’s affected? Historically, the financial institutions and the banking industry are the most affected. They have a lot of compliance departments working on this.
However, the non-financial sector is also affected, such as companies with multilayered decentralized structures and huge customer bases, as well as those working in a franchise system or across borders. This is what we’re focusing on.
Particularly, we have a special focus in the gambling industry, or companies that are operating in these so-called higher risk industries. This could be gambling, real estate or those who trade with valuable goods, such as cars, jewelry or artwork.
In a nutshell, money laundering is a hot topic because we’re talking about personal liabilities on the management level. We’re talking about financial damages that have incurred millions and billions in fines for numerous companies. It also incurs massive reputational damage for a company. After all, you don’t want to be the company in which drug cartels or terrorists are financing their next attack.
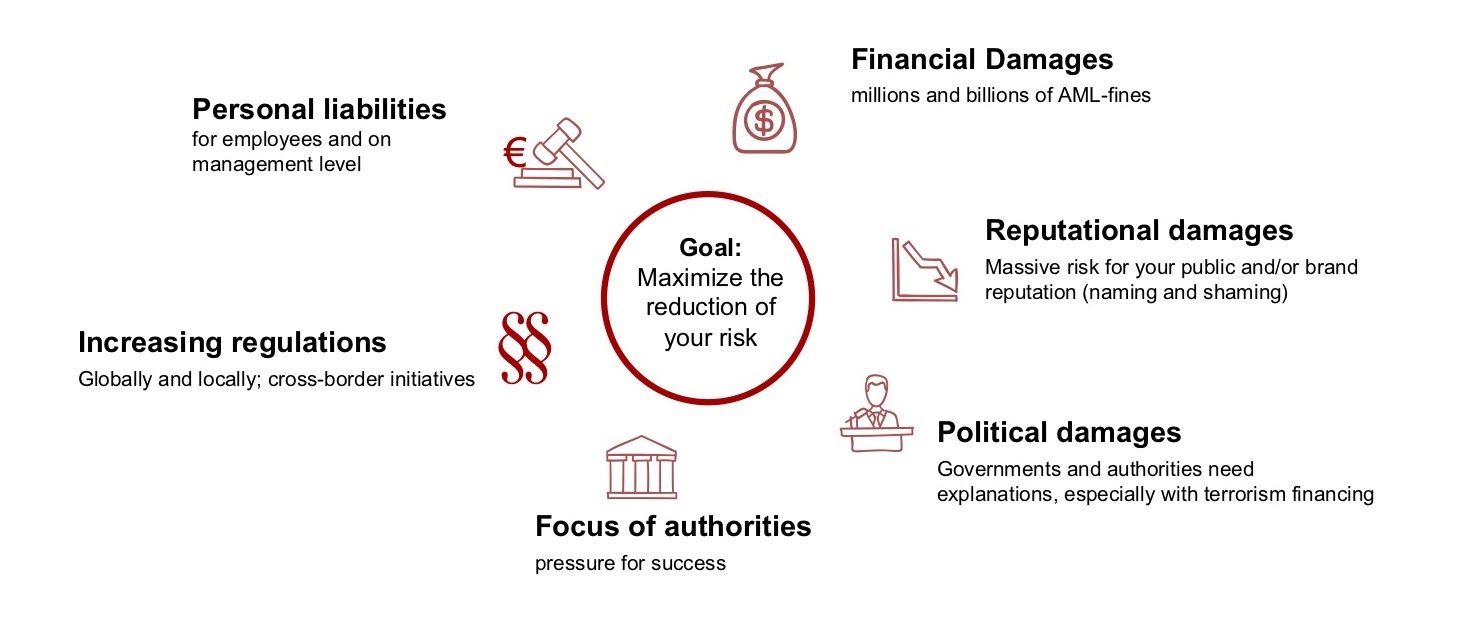
Money laundering also affects politics. Authorities and governments have to explain why so much money is floating around in shadow industries.
Who is KERBEROS Compliance?
KERBEROS is a pretty young company – 10 months old. We’re a compliance company with a strong focus on anti-money laundering. So far, within the first 10 months, we’re representing 500 shops, mainly in continental Europe, and targeting another 250 by the end of the year. For Q1 next year, we’re looking at 1,000 points of sales that we want to represent.
What are we doing? We’re a one-stop-shop for everything compliance-related. We do risk analysis, establish an entire compliance organization into the company, outsource and re-implement, put standards and policies out, and provide AML officers, so it’s pretty legal work as well.
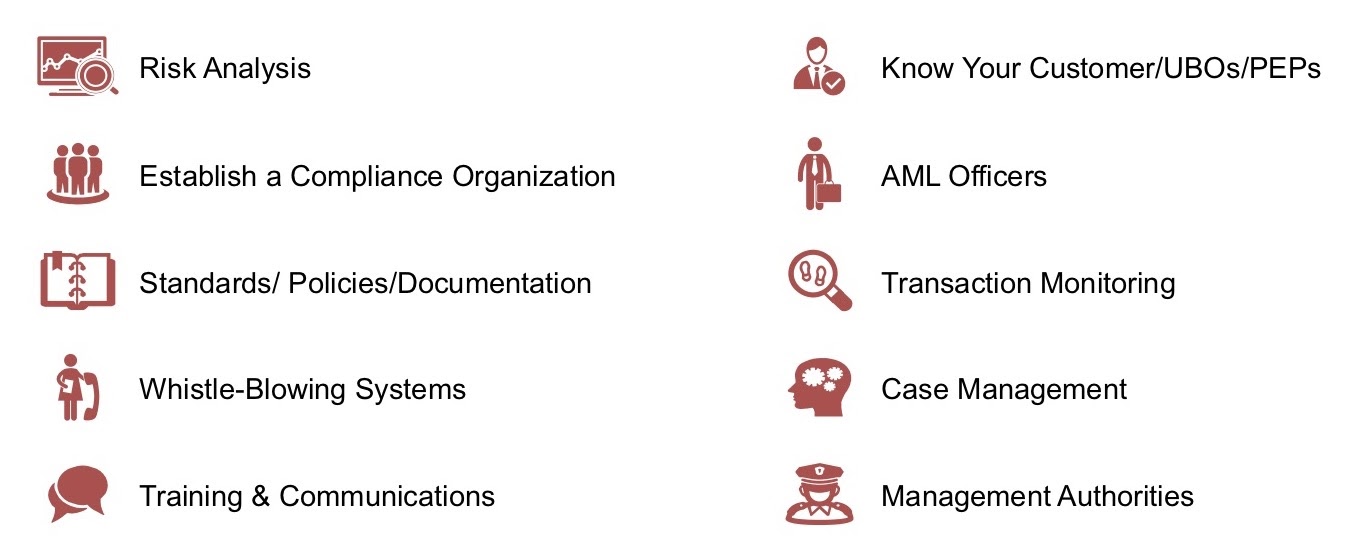
The problem is that with the volume we’re working in and the regulations our customers are facing, there’s no way we can do this without technology. We have some tiny technology solutions we are providing, such as a whistle-blowing system and an e-learning platform, but we’re also working with graph technology.
If you look at the gambling industry even in our country, on a game day, we have thousands of transactions every day. Therefore, you need to have proper case management, something that Structr and Neo4j are building up for us.
Finally, we have the so-called “know your customer” process. Who’s the business partner I’m actually working with? What do I know about him? Who’s the ultimate beneficial owner behind it? We’ll now talk about how we’re approaching this with graph technology.
The Know-Your-Customer-Graph
Imagine you’re the regional manager of Los Pollos Hermanos and a nice gentleman, Mr. Walter White, comes to you and says he wants to be part of your franchise. What do you do? You haven’t watched “Breaking Bad.” You’ve only received an application, a couple of documents and other publicly available information.
People might say, “if I want to tell you who’s a smoker, I don’t want the information about this person, I want the information about his friends.” And that’s what we also do at KERBEROS. We call it the Know-Your-Customer-Graph.
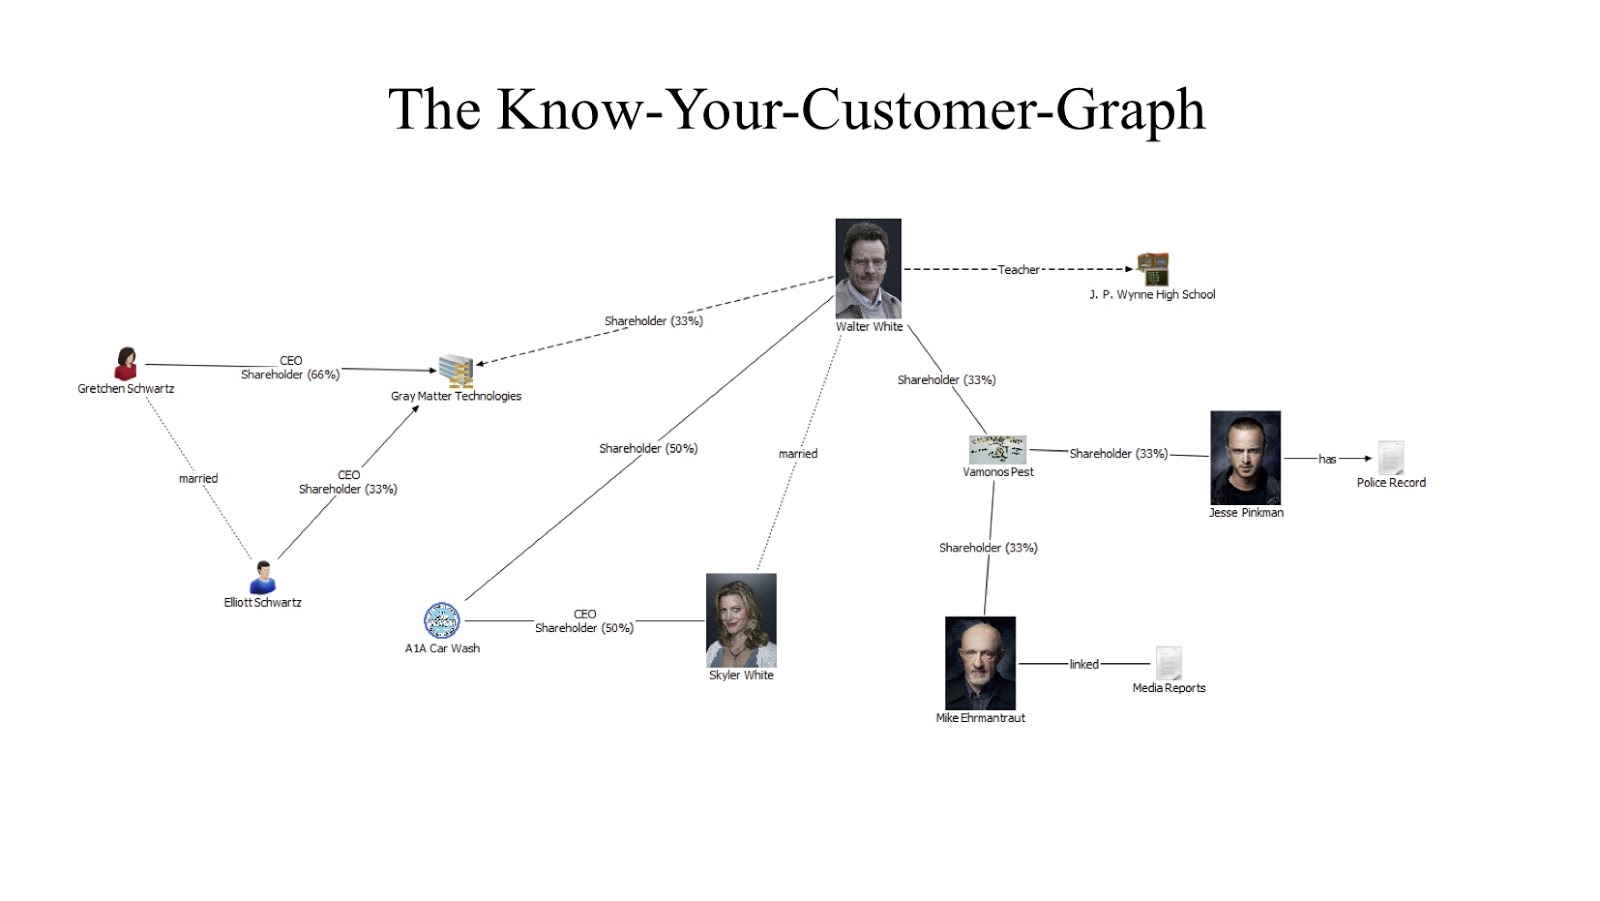
Looking at the graph of Walter White, we can see a couple of things. He used to be a teacher as well as a shareholder at Gray Matter Technologies. But nowadays, he’s mostly involved with two businesses: a car wash and a fumigation service, Vamonos Pest.
Now, he runs the car wash jointly with his wife – that looks normal. But if you look at the fumigation service, you see that two of his business associates are a bit shady. First, you have Mr. Pinkman, who has a known criminal record for drug dealing. Second, you have Mr. Ehrmantraut, a former police officer who left the force on allegations of corruption. Just by looking at this, you might not want to go into business with Walter White immediately.
Let’s take a look at how this works in a more real-life example. Usually, we build a graph and take information that we receive as part of the due diligence process. We also use publicly available information, such as IDs, registry records and rental contracts. We take all this data, analyze it and look at the actors, companies, people and locations. Then, we collect that data and enrich it with media reports and open-source intelligence.
In the hypothetical example below, we have our franchisee, our client, at the top. Then, you have the Alpha LLC, who’s our potential franchise partner.

In a traditional know-your-customer process, what do you need to look at? Well, you need to identify your partner, the ultimate beneficial owner (the so-called UBO) and the sources of wealth. Where is the money coming from? Then, you need to run background checks, like PEP checks and sanction checks.
In our example, what we could do is obtain a business record for the LLC. We would see it has two types of shareholders: a majority shareholder and a minority shareholder. The minority shareholder has below 25 percent, and that’s the limit under which I do not necessarily have to fully identify the person.
I have a majority shareholder, Mr. John Doe, who is also CEO. So I check, verify and get his ID. We can assume he has some legitimate sources of wealth – and we’re done. That’s more or less the traditional process.
But why do we build the graph? Let’s say that Alpha LLC is a restaurant chain, which has three locations. We look at the contracts and we see all locations near the bottom of the graph and see that they lead to the same landlord, which is not unusual; that’s a common occurrence.
What’s not so common is actually the fact that this landlord shares the company’s seat with the minority shareholder. If we look further, we also see that the landlord is owned by a company that’s in turn owned by the owner of the minority shareholder.
And this is a very traditional way of layering money. You have your restaurants, where the money comes in and the illegal proceeds are getting mixed up. Instead of having high revenues for the restaurants, what he does is siphon all the profits, or at least part of it, through overpriced rents out of the companies. Overpriced rents are the norm, so that really isn’t that suspicious behavior. Then, you transfer the money via those companies to the ultimate actual beneficial owner, who is not John Doe, but Jane Doe.
What Does KERBEROS Do Differently?
This process gives us a fuller picture; when we analyze it right, we don’t just look at the potential partner itself – we also look at its graph. We see if there any interesting personnel in the second or third row, or if there are businesses that are unrelated but also very cash-intensive. By that, we can measure whether the risk for this potential partner is higher or lower, and we obtain a fuller picture.
A fuller picture is not necessarily only important for the know-your-customer process but also for risk management itself. After all, we want to see that network, because the risks that are within that network don’t necessarily stay with one node. For instance, we want to know if Jane Doe is a known drug dealer because that risk can spread easily to the person we are in direct contact with as a franchise organization. We want to prevent being named in the same breath as that person.
Particularly, reputational risks don’t adhere to the same standards as legal proceedings and prosecutions. We all know media tickets get out quickly and the headline is a lot juicier. For example, the headline “Burger King helps the money laundering” is a lot more eye-catching than writing that “Jane Doe was convicted of money laundering.”
Therefore, what you want to do – especially with AML – is to look at the network. You want to see where the risks lie and how you can manage them. Risks in themselves aren’t bad, but you have to deal with them.
Another thing we do a bit differently is we don’t draw only pretty lines between nodes. For us, it’s very important to document those lines. Most of our relationships – the edges between our nodes – are actually hyper-relationships where there’s some kind of proof in the middle. Usually, it’s a document, such as a contract, an ID or a record. This actually verifies this edge, or this relationship.
Particularly, it’s important that if law enforcement or an audit comes, we need to prove that the graph we built and the risks we found or did not find were all we could do at that particular moment in time, especially since most investigations or even audits come years after the fact. Whenever something happens, I need to document today how a network and shareholder structure looked, because it might be investigated many years from now. And at that time, I need to show I knew what we were dealing or did not deal with.
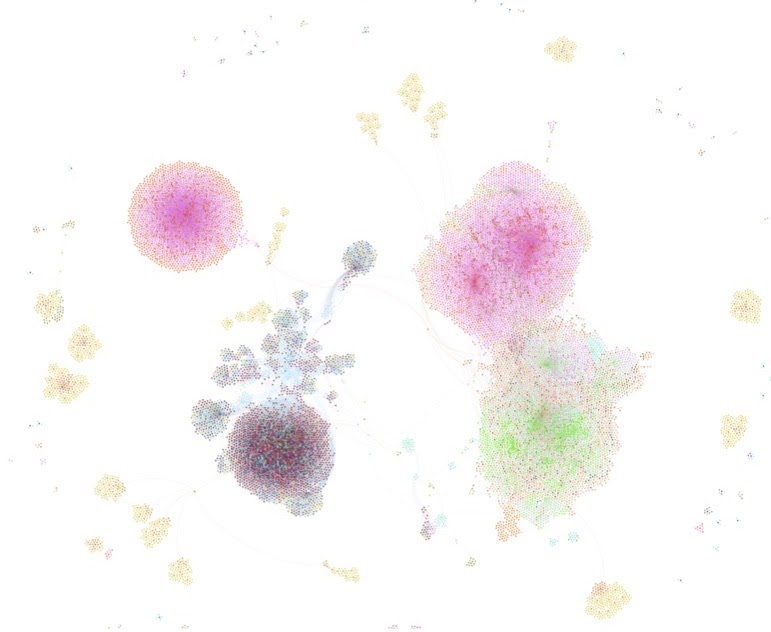
The Challenges
Most of our challenges were pretty universal. The real world is a graph and it’s messy, so we don’t have simple models; our data structures are very complex. Networks and shareholders are changing, so we need to account for that.
Moreover, in this field of work, we often see the unexpected – more of the creative business constructs you wouldn’t usually use or find – so we need to deal with that. Also, our work is very much framed by regulation. Regulatory change is constant, so we need to account for that.
Therefore, we needed a flexible system to actually be able to deal with all of this. Below, we have the network from one of our production servers, which, as you can see, is very complex.
In this way, we also need it to be auditable, because it’s compliance after all. I can’t just change everything myself; I also need to document it and make it comprehensible to a third party. Another important aspect is that while we want this high complexity in my backend because I want to analyze it, I also need to condense it down to a level where users, clients and regulatory bodies can actually work with it.
Lastly, we also needed to be transparent, because our results and their processes must be verifiable.
Main Requirements
Unsurprisingly, our main requirements were that we needed to be able to store large amounts of complex network data efficiently – and be able to query it flexibly. We needed to be able to have a system that is very adaptable so we could actually react to changes, whether they be regulatory or otherwise.
Again, we needed to allow complexity but also be able to dial it down a bit. We also had to deal with complex security models because it’s very sensitive data, and not everybody is supposed to see every bit of data. Providing secure storage and archiving its logic was also important because I need to show for at least the past five years that I did my job correctly. Lastly, it obviously needs to be easy to maintain.
Neo4j & Structr: A Perfect Fit
To answer this question, I could simply say we fulfilled all these requirements, and we could stop here. But, I have some more details to share.
Database
Technology decisions are always important because it’s often difficult to change them afterward. Once you’ve imported lots of data, it’s very difficult to change your most basic layer: the database.
We chose the best database for connected data: graph-shaped data. The decision was very simple, because the best native database is Neo4j. It’s built and designed for native data and for graph data; no other database is optimized for this use case. Furthermore, it’s stable and great for enterprise requirements.
Application Platform
Now, who is Structr here in this game? Strutr is the application platform that helps connect the data to the front end. This is what the users use, or the interfaces you import and export data with.
As noted earlier, we needed a high level of flexibility in almost any area that made it possible to reshape the data model at any given time, even at run time. You can’t wait for development cycles – which might take a couple of weeks to months – to rebuild your application only because the shape of your network or your regulatory requirements have changed.
The secret behind Structr is that the entire definition of the application is modeled as a graph, which is stored in the very same database as Neo4j. You can manage everything in a single integrated tool, which comes with lots of integrated and built-in functionality, such as the schema editor, where you can change your data model according to the size of your data and follow those changes quickly.
Structr also has handy components like an integrated content management system (CMS), page builder, document store, file storage and so on.
Flow Engine & Editor
The latest addition to this platform is our flow engine, which is managed through a flow editor. This allows you to check routines and define queries, processes, logic of almost any kind, decision trees and so on – all with a graph interface.
By dragging, dropping and connecting nodes and relationships – which are very natural if you’re in the graph space – you create these checks. Earlier, we talked about the UBO check and the identity status check. You can also reuse the result of these components, connect it or use it as one node in a different check routine. This is the ultimate tool that allows non-developers to create, maintain or manage logic, which is very important if you want to keep up with these changes.
An Effective Graph Solution
An effective graph solution only works if you can evolve as quickly as your legislation as well as the changes your users need in the interface. Everything is non-uniform and inconsistent, and you have to keep track of that very quickly.
All of this comes with a broad spectrum of import and export interfaces. Because most of the basic functionality is already built-in to that platform, it’s very cost-effective, which is important if you want to scale. The solution has to scale from a single-person business up to an enterprise or a large company. Of course, effective solutions also have to be secure and meet a high standard of security.
In this way, the solution we built supports domain experts in their daily work by giving them the tools they need to define processes without always needing help from us developers. This is a major step in the industry, in which we can provide a tool that enables subject matter experts to do their work without having to rely on programmers.
Conclusion
Overall, we know that this is a complex area with complex regulations. Of course, you need a smart software solution, but you also need to know what a business or customer means to you. This means that you have to know their graph. The technical components here are the native graph database and the flexible application platform.
Seven Reasons
We’ll end off with the seven reasons we promised to give you in the title, for why effective compliance management is only possible with a graph-based solution:
- Money laundering happens in a graph.
- The competition is also using them: maybe it’s not competition per se, but rather different journalism outlets or even the people who launder money.
- Regulatory requirements can be best understood and checked in the graph.
- Transaction graphs: when you connect the financial transactions of the people and businesses to their nodes in the graph, you can get an even larger graph.
- Security graphs: the security system is also a graph that contains a hierarchy of groups, roles and people.
- Allow fast graph queries: technical components also have to lie in a graph-based solution. You need fast queries to run real time status reports – you don’t want to calculate them overnight and redo them again if something changes in the graph. You want to do this all in real time, which is only possible in the graph database. Moreover, you need to be flexible enough to keep track of all the pressure coming from your users, who may want new tools every week.
- Store application components in graph.
- Manage business logic as graph.
Share Article


Explore
Related Articles

Top 10 Graph Database Use Cases (With Real-World Case Studies)


Elevate Fraud Detection With Neo4j on AWS: Uncover Hidden Patterns and Enhance Accuracy


Fight Cybercrime With Bloom: The 5-Minute Interview With Bertrand Provost