Empowering Employees With Graph Technology

Manager CIO Office, Viasat
9 min read

In today’s blog, I am going to talk about Viasat’s Compass. In addition to being a technical product owner, I also manage the CIO Office at Viasat and am responsible for digital transformation. Before I dive in, I’ll share a little background on my graph journey.
I studied biomedical engineering during my undergraduate years and was drawn to systems biology. Systems biology looks at elements in a network and how these various elements interact with each other. I then attended graduate school for bioinformatics and systems biology, where I studied embryonic stem cell systems. I focused on single cell RNA sequencing, analytics, and development. This was a rapidly moving landscape; in fact, the dataset I developed during my second year of graduate school was totally obsolete by the end of my third year.
I was introduced to graph analytics and machine learning as great tools for carrying out complex analyses when trying to understand the lineage hierarchy of a tissue and how a stem cell chooses to develop into whatever end state it ultimately winds up in. I’ve been excited about the possibilities with graphs ever since.
Viasat: Connecting the World as a Satellite Internet Provider
I made the move from life sciences to tech and currently work at Viasat. Viasat is a satellite internet provider with a mission to connect the world. We’ve seen explosive growth these past couple years, including bringing on new companies through acquisitions. We actually build the satellites ourselves and we even innovate our ground systems to provide connectivity to our customers.
We provide internet connectivity to both residential and business customers. If you’ve taken a flight recently, you’ve most likely used Viasat’s in-flight wifi connectivity. Another major part of our business model is that we are a government contractor, supporting connectivity around communications for special flights.
One of the challenges caused by our growth and the complications created by the pandemic is that it’s hard to establish intercompany connections. We’ve been able to deliver connectivity to remote villages in Mexico and recently, all over Brazil; however, as we’ve grown, it’s become important for us to do some introspection on how we can more effectively work together as a single company.
There’s this saying at Viasat that “we’re the startup that never grew up.” We have a fantastic culture that allows us to innovate rapidly and create seamless collaborations across different teams. We’re always trying to remove boundaries that prohibit innovation from happening. For instance, while we have a reporting hierarchy, our flat organizational structure means that if you have a great idea, you can go talk to the CEO about it.
Still our growth has brought us a lot of challenges around content discovery, connection, communication, and collaboration. Even though our culture creates a nurturing, collaborative environment, because of our size, it can just be a lot easier to work within your own team.
Company Navigation Challenges
When I first arrived at Viasat, I was on a data science team, and it was extremely hard to figure out where my datasets came from. I would hear about mythical data sets that existed and I’d go hunting for them, just trying to find better information. After doing this for a while,I took a step back and decided we had to find a way to do this more effectively.
One challenge is that we rely heavily on email for communication, but we actually don’t have any roster of product teams. Additionally, because we’re a government contractor, we have sensitive projects happening all over the company. I decided it would be nice to have just one place to go to find answers.
Compass: Our Way to a More Connected Company
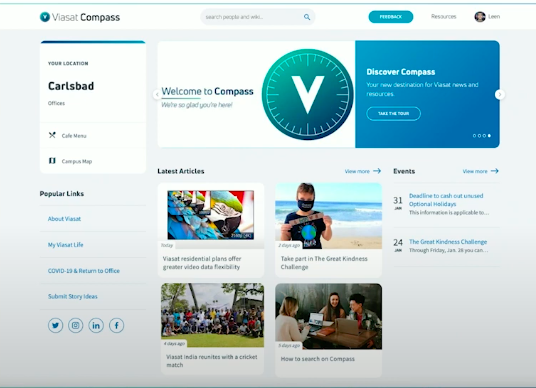
As a result, in January, Compass was born! This tool was developed and designed in-house, and throughout the development process our product strategy centered around the user experience. In fact, one of the most important features for Compass is that it’s personalized for each user.
We pull attributes about the user and their current location and in-turn provide them with relevant, information-rich, profile pages. Working with our internal communications team, we’re adding new content to our site every day to keep users engaged. We also analyzed the most searched-for resources and have curated those resources for our users through adaptive search. Our goal is to pull attributes about the user and provide engaging content that’s location and team specific.
Cultural Vision
Our overall vision for Compass is cultural transformation. We want to solve the unintended consequences of having a startup culture in a very large company. Compass gives us a platform for consistent messaging across the company and a central place to foster an inclusive culture.
We are continuing to grow very rapidly and are adding many new members to our staff. We’re currently acquiring a company called Inmarsat in the UK, and about a year ago, we acquired another company called RigNet. As we do this, we need to continue to propagate that startup culture of innovation by having everyone understand the business strategy and creating a shared global experience of the Viasat culture.
Faster Onboarding
Part of our strategy is speeding up onboarding. It’s difficult for a new person to get around. When you start, you meet and learn about your team. In the past, if you’ve wanted to go beyond your team and learn about other Viasat teams, you’d have to rely on your manager. Compass now makes it easier for employees to connect across content as they get started.
Leveraging Company Wisdom
On the opposite end of onboarding, when an employee leaves Viasat, they take some of that knowledge and information with them. We never want to lose this expertise. Compass will be able to document this information, allowing all teams to leverage this cross-team wisdom.
Compass Data Flow

We’re leveraging several technologies to allow users to do content discovery in Compass. While we store content across several tools, for our MVP, we focused on collecting information about our people and our Atlassian Confluence deployment, which acts as our internal-wiki. We break all of this information down into three buckets: complete content, content metadata. and user data (how users interact with content).
After pulling this data, we take the complete content and leverage the Stanford CoreNLP library to extract relevant key phrases and entities from the text. We take that data and put it into Neo4j. As a government contractor, we have a lot of classified data on our network. It was really important for us to provide really robust RBAC controls on the document level so we don’t show results to people they don’t have access to. This would put us out of compliance with some of the Department of Defense standards.
A major part of Compass is its user experience first design. It was really important for us that the search was lightning fast. The Solr search tool is a major component of our solution design. Additionally, pulling the metadata into Neo4j allows us to do super cool things like build constantly updating machine learning around our relevancy – because relevancy is a moving target as the content landscape changes. What’s great about Solr is that it can ingest machine learning parameters to constantly update its searches for relevancy based on our latest machine learning models. Soon, we’ll be using this same data flow to give recommendations and community matching.
Data Model

This is our data model. You can see what we’ve completed thus far, what’s in development, and what’s currently planned. So far we’ve mapped in our people and their management hierarchy. People can create, interact with, and comment on content. All those relationships also exist in our database, and the content itself has attributes and relationships.
Content may also have an acronym associated with it. This is funny, but if you’re new at Viasat and you join a meeting, it’s acronym central. You just try to write down all the acronyms people are saying, trying to understand what they mean. It is really important that acronyms are a node in our data model because a lot of times people will search using these acronyms, and that allows us to deliver CoreNLP outcomes around key phrases and entities, even if they use acronyms.
The white nodes in the data model are what’s in development now. We have a database of user analytics, taking a look at their queries or clicks after they run that particular query. Analyzing these allows us to deliver the most relevant search results to our users. The red nodes are the things coming up, including our reporting hierarchy and the frequency of email or Slack messaging. Of course we’re not trying to be Big Brother – we just want to understand the frequency at which people communicate with different groups around the company.
This data is dispersed in different systems right now and it’s on the roadmap to ingest the data into our system. One challenge is navigating through our highly decentralized financial system. We’ve had to understand what cost center and project a user is a part of. There are also stringent government regulations around mapping all of those costs to a particular effort.
Learning to Rank Search Results
Now, in the first iteration of this product, we are leveraging elements in the graph to deliver more relevant search results. For instance, we’re using several graph algorithms, including ranking SVMand, page rank and graph embeddings through GraphSAGE. Click events are the basis of our outcomes here: based on what a user is searching and what they are clicking, we grab those click events and use them in our relevancy model.
We’re soon going to take this to the next step with more personalized relevancy. Because the content landscape is constantly changing and people are constantly updating content, we do bulk ingests, train our models and load the results into Neo4j and Solr. We are currently finalizing event driven ingests so we only have to re-run our models when somebody makes a change to a specific piece content.
We Strive for Awesome Experiences
Striving for awesome experiences is a major part of our digital transformation strategy. What do I mean by awesome experiences? We’re focused on customer first design, who is our customer and what does the customer want? Our customers are our employees and Compass is focused on employee empowerment. We’re also a team of developers. So developer experience is really crucial to us. We want to make sure that everyone is having fun working on this project and that means establishing operational excellence and automating as much as we can.
I never want our work to become obsolete like my dataset did back in graduate school, so we continuously iterate to keep up with the quickly moving technology landscape. It’s really important for us to continue to evolve and showcase this evolution for the rest of the company as we modernize our software development strategies.
Compass Focuses on Innersourcing
The founders of our company wanted Viasat to feel like we are all one team. It’s really important for us to take Compass from our team to the rest of the company and then ultimately open it up to the outside world. Because we’re government contractors, this is pretty radical for us because there aren’t any public projects at Viasat right now. We’re pushing Compass to be our first public project.
Compass is also trying to take on shared functions across teams. For example, one of the challenges I’ve seen in doing data science work is you really need a deliverable at the end. To enable analytical maturity at the company, Compass will take our data science problems and productize them. Expanding our data model will enable things like community detection, providing more relevant results for every person based on what community they’re in. We’ll also be able to do multiple ranking models to further enhance that relevancy. In our search engine Solr, we can take a collection of documents and build a relevancy model on top of that collection.
Culturally, we’re creating a team where collaboration results in both an outcome for the core team and then for the collaborators. Here, the vision for Compass is a crowdsourcing project. If someone has a vision of where they could take their analytics and productize it into our frontend, or create a user journey or experience using our web app, then we are open to doing that. We’re driving Viasat’s global startup culture through Compass.
Compass Team Rocks!
It’s been really fantastic working on this project. I want to thank our Neo4j contributors. As a shoutout to Neo4j, I highly recommend working with Neo4j professional services on your graph analytics journey. Neo4j is an amazing group of people to work with and I want to continue to work with them. Most importantly, I want to thank the Compass supporters, users, and all my teammates on the Compass project. We’re so excited to expand the startup culture at Viasat.
Share Article


Explore
Related Articles

Mastering Fraud Detection With Temporal Graph Modeling

What Are the Different Types of Graph Algorithms & When to Use Them?


Turning Your Tabular Data Into a Graph Using Cypher