


Enterprise Data Management with Graphs

Co-Founder and CEO, Structr
7 min read

Editor’s Note: This presentation was given by Axel Morgner at GraphConnect Europe in April 2016. Here’s a quick review of what he covered:
- Data management challenges faced by enterprises
- The first step to enterprise data management: data integration
- The best way to integrate data via a unified system
- Unifying your data with a graph
- An overview of Structr
- The benefits of the Structr platform
What we’re going to be talking about today is enterprise data management with a flexible graph platform:
I’ll explain enterprise data management and then show you our approach to managing data in an enterprise with our flexible graph platform, Structr. This is an open source project we developed around five or six years ago and is now compatible with Neo4j 3.0 and the Bolt protocol.
The initial motivation of creating Structr actually wasn’t enterprise data management. We started with a basic content management system but then realized the endless options and possibilities with a graph as your data model. This evolved to a focus on enterprise data management.
Data Management Challenges Faced by Enterprises
Let’s look more closely at these three words: enterprise, data and management. In an enterprise there are several challenges to data management, including the multitude of people, departments and processes.
Along with that you have a lot of heterogeneous data, which is defined as being complex with a variety of different data structures. In the case of emails or documents, sometimes the data is even unstructured.
Data is rarely centralized and is frequently distributed in a variety of data silos and structures. The different data has different semantics, which are directly related to the different use cases that handle data. And finally, some of this data isn’t even supported by IT because it’s on paper, in Excel spreadsheets or simply in the heads of your employees.
There are also several challenges associated with data management. Typically companies will start a discrete IT system for each use case to manage data, which adds to the complexity of the overall IT landscape.
It’s not uncommon for companies to have dozens — or even hundreds — of different IT systems. Then for each system you have product owners who are guarding their data, applications and processes. There are also have different user groups that may overlap in this landscape.
This isn’t enterprise data management. Rather, this is what I call department data management, a common problem in many companies. So what’s the solution? You have to integrate the data.
The First Step to Enterprise Data Management: Data Integration
This is where the challenge starts: In this first scenario, let’s say there’s no automation. People enter data manually or share it by printing it or sending it via email. This is a common practice that causes lots of friction because it’s slow and error-prone.
Additionally, oftentimes you end up with an Excel-based shadow IT. In the beginning the spreadsheet is easy to use, but as you start adding formulas and it gets longer, it also gets increasingly complex. The main issue here is that you can’t map any processes with this sort of infrastructure model.
So what do you do? You have to integrate the data:

To do this, you have to integrate your different IT systems — or even Excel applications — and allow them to automatically interact through the creation of interfaces. You have to map the data structures between the different systems — which is difficult due to the different data formats and semantics — and specify the exchange rules.
For example, is the new integrated database pulling data from one system or pushing it to another? Which is the primary or secondary system?
In theory, if you connect each system with a bidirectional relationship, you end up with n(n-1) interfaces which makes for exponential growth. This means that the more IT systems your company has, the more challenging the situation becomes.
A Pitfall to Avoid: Integration Hubs
One solution to these challenges is to create integration hubs, which are central places where you exchange data. This still requires specifying interfaces, but only between each IT system and integration hub:

There are a variety of technologies available – like middleware systems or an enterprise service bus – that allow you to reduce the number of interfaces from a number growing exponentially to a number growing linearly. In the above graphic, you end up with 2n number of interfaces between the systems instead of n(n-1).
The downside to using integration hubs is that you are introducing another complex system that is hard to maintain because any system change needs to result in a change to the integration hubs. Even though we’ve tried to integrate them in the smartest way possible, these hubs have limited intelligence and don’t contain any of the processes.
Finally, it’s hard to integrate all of your company IT systems using only one integration hub because it’s simply a data exchange and doesn’t actually streamline and integrate processes.
The Best Way to Integrate Data: Creating a Unified System
The best approach to integrating data is to create a unified system:
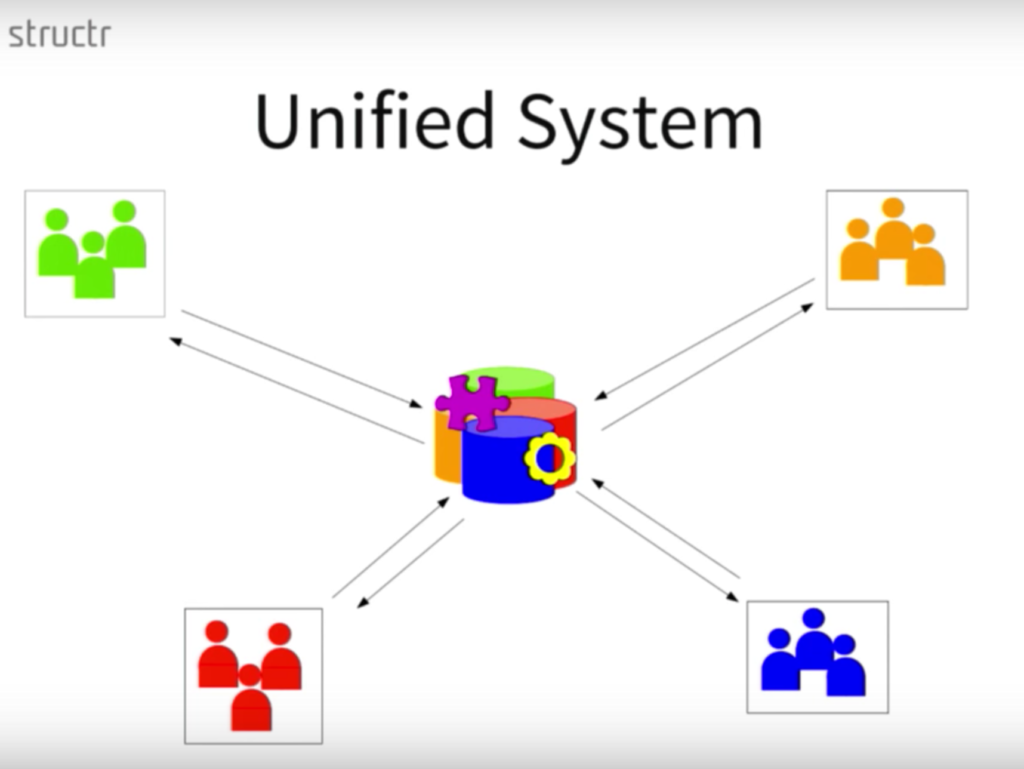
In this context, a unified data management system is one centralized system that includes all data sources and processes integrated tightly into one data model. This is represented above by the different colors and icons.
This is a major, major task. In a presentation given by Dr. Andreas Weber (formerly from Schleich), he discusses creating a unified data model when you also need to develop a common ontology.
Once you have a common data model, you have to integrate all the different processes and define them in one place. Then you can start replacing IT systems with components of your central system and eliminate the Excel culture, which is great from an IT perspective.
Now, instead of having a complex monolithic IT system for each department, you can create micro apps, which are the equivalent of microservices — a type of user interface dedicated to a limited and special use case for a specific group of users that connects to the same backend system. It’s easier to create a small user interface with a simple UI than to create a complex IT system.
This won’t necessarily work in all cases. For example, you may not want to replace an important SAP ERP system. But, you can limit the scope of the SAP system to what is appropriate. Because this type of system isn’t ideal to use when mapping and storing enterprise data, our customer Schleich introduced an SAP system but in a very narrow scope. This worked really well for them.
Unifying Your Data with a Graph
From a data modeling perspective, what you have to do is take all the different data models that already exist within your company and connect them, which is really just as easy as these two contrasting diagrams:
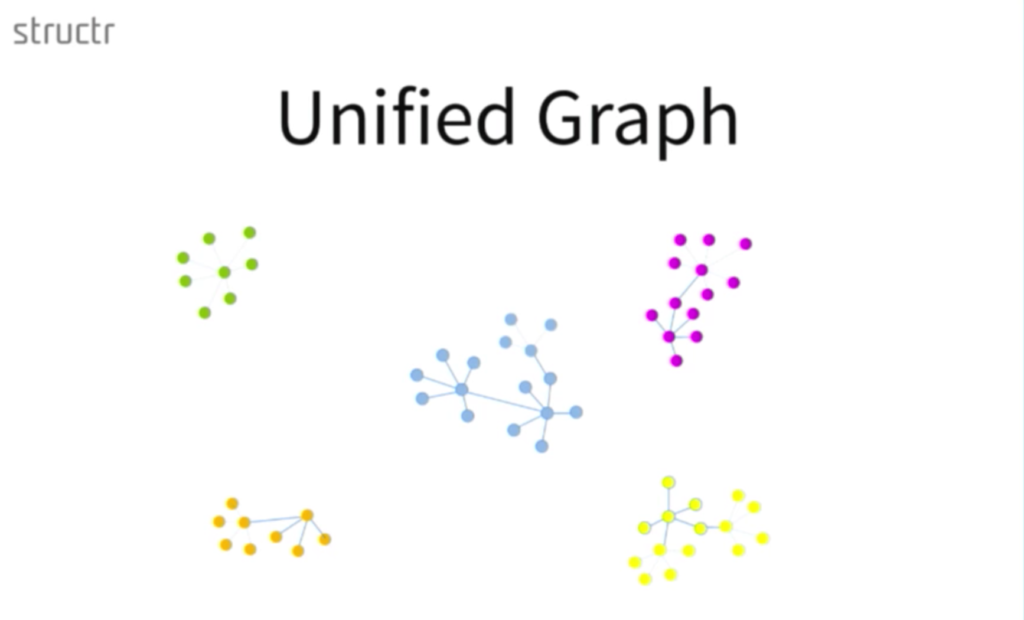

If you can create a micro app in one department with marketing information, represented in pink, and the manufacturing data represented in yellow, we can suddenly answer very complex questions simply by doing a graph traversal.
Below is the data model we use for the Structr graph application platform:
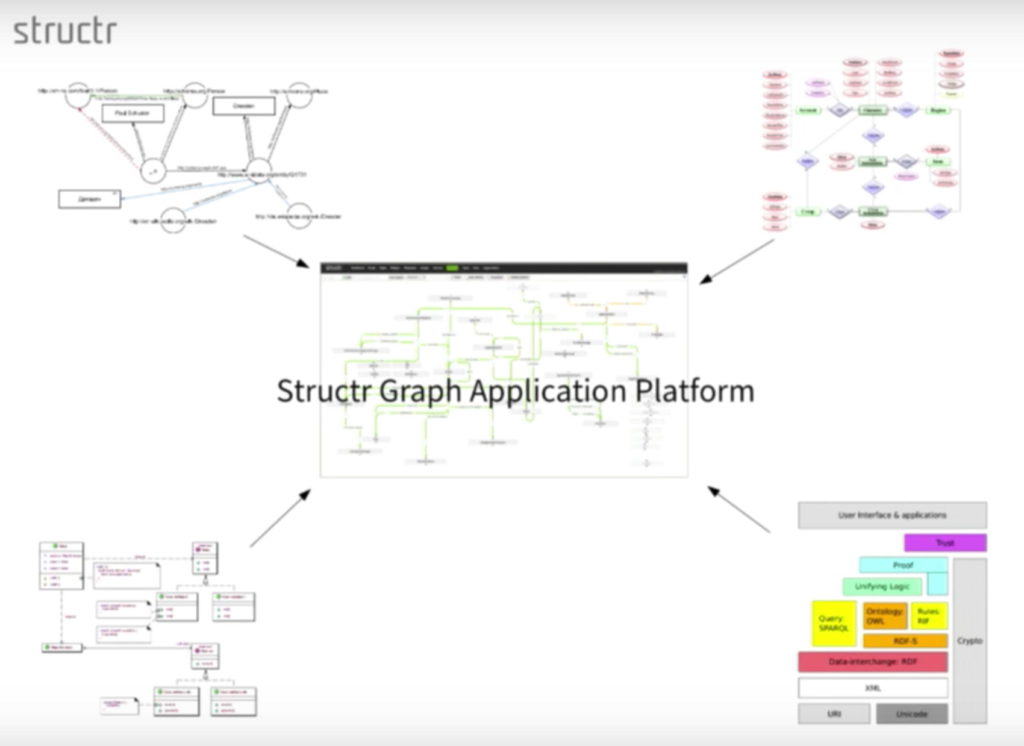
We unified all of our different models, which includes our RDF-based, entity-relationship diagram, which is essentially a semantic model. We also had business logic living in software, along with user interfaces, applications and a data interface. To bring everything together, we created a unified central data model within Structr.
What is Structr, Anyway?
Before we move on, I’d like to go over the major characteristics of Structr. It’s rather complex, so it can be somewhat difficult to explain:
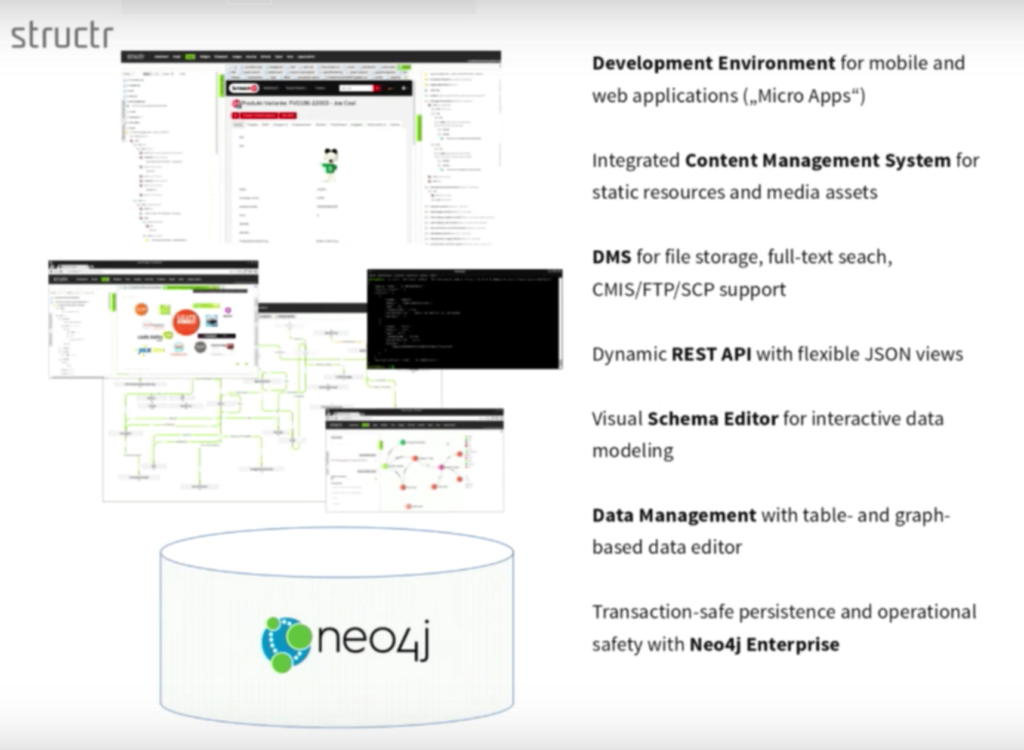
We always start by explaining the user, which we find to be the most important because they are absolutely essential to creating a successful application. Structr is an application development environment that allows you to easily create mobile and web applications which, in this context, we call micro apps.
It includes an integrated content management system for storing static and dynamic resources as well as media assets. At Schleich, we could completely replace an existing media asset management system simply by connecting the documents to the other graph nodes.
Structr also has document management capabilities for file storage, including full-text search. CMIS – Content Management Interoperability Services – is an enterprise integration standard for content management systems that can interact with your file data via the SCP or the SSH protocol.
Structr has a very important component to connect to other systems, and it even allows you to write your own front-end application against this dynamic REST API. You can define this in a very flexible way simply by modifying the integrated schema to create JSON views.
This means that you can use Structr as a document database to create arbitrary documents or in arbitrary formats off your graph data, which is a very important use case.
A central component of the software is the integrated visual schema editor where you can interactively model your own custom data model or schema.
And last but not least, there are some simple data management capabilities for the table and the graph-based editor. All of this is embedded in Neo4j Enterprise Edition, which provides us with both transaction safety and operational features that are required for successful enterprise data management.
The Benefits of the Structr Platform
Flexibility
The number one benefit to Structr is its flexibility. You can start small and extend the data model and the application step by step. This means can start by creating a small data model of only one department, and then integrate another IT system or microservice with that first data model.
An interesting benefit is that instead of having to wait days or weeks for each change in a complex application, you have round-trip change times of a few minutes or hours.
That’s really the way we worked at Schleich. It’s not uncommon for a business user to request a change in the morning and for us to have it implemented by the afternoon.
Of course, we first discuss the implications of the change on the overall architecture and how this will need to be applied to the user interface, but the speed at which changes can be made is incredible. This is really a game changer for the users in an enterprise; rather than being discouraged by the long round-trip times for change requests, they are more likely to ask for improvements.
Performance
The second most important benefit of Structr is its performance.
From a user perspective, this means complex searches are completed in about a second, which is what you’d expect from a web application. If you can’t deliver this, user acceptance is really diminished.
From a developer perspective, you don’t need to optimize your access path upfront, which is what is typically required with older technologies such as relational databases.
With relational systems, you need to know before you design the system who will have access to which data, and how many items or elements you’ll need. But with Structr, you don’t need to optimize before designing or building the application — you can do that during or even after you’ve built the application.
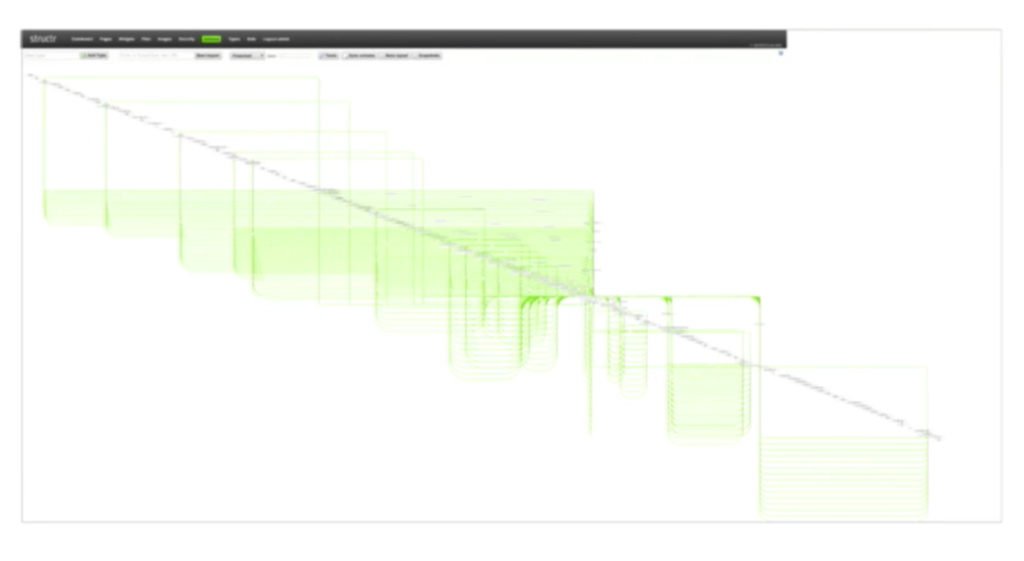
Below is the initial data model that resulted from importing a couple of gigabytes of RDF and OWL into the system:
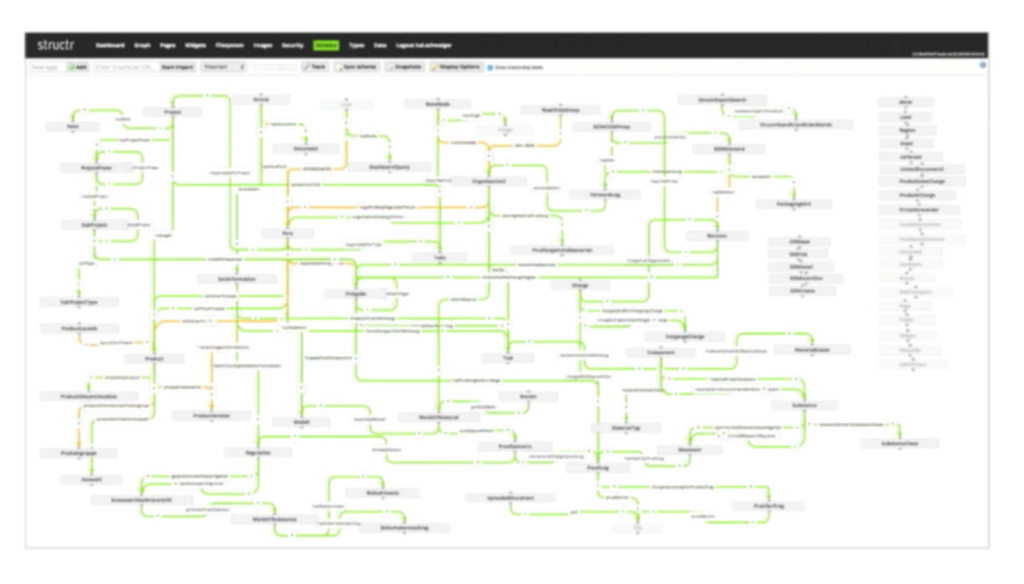
Over time we refactored the data model on the running system, and after some reshuffling and sorting, our data model ended up looking like this:
We also help the customer get a better understanding of a data model because there is only one for the entire company. You have to keep in mind that there’s ongoing work to extend and refactor any data model, but we don’t have to go through all those steps to redesign — we just add a new node. Let’s take a look at how that works.
The microservice could look like the following:

A micro app is more or less an interactive web page with forms and tables. It could also look like a mobile application with a very limited set of elements that people can download onto their iPad or iPhone.
To see how creating a data model works in Structr, watch the live demo below:
Learn more about how relational databases compare to graph technology: Download this ebook, The Definitive Guide to Graph Databases for the RDBMS Developer, and discover when and how to use graphs in conjunction with your relational database.
Share Article


Explore
Related Articles
Bolster Your Cybersecurity by Visualizing Attack Graphs With Neo4j & G.V()


Top 10 Graph Database Use Cases (With Real-World Case Studies)

15 Best Graph Visualization Tools for Your Neo4j Graph Database
