Expedia’s Entity Graph Powers Global Travel

Principal Engineer, Expedia Group
11 min read

Editor’s Note: This presentation was given by Chris Williams and Raghu Sayana at GraphConnect 2022.
At Expedia, we heavily leverage graph databases across our brands and maintain an innovative self-service infrastructure to enable developers to use graph databases. Across our company, graphs enable us to achieve our mission: empowering global travel for everyone, everywhere.
At Expedia, we support several distinct brands, which complicates the engineering problems we have to solve; each of these acquired brands typically starts with their own distinct technology stack. Over time, we’ve unified these architectures using graph databases to simplify our infrastructure across brands.

Expedia’s Data Infrastructure Challenges
With all of these brands, we have tons of data that we have to unite and manage across our platform. To store this data, we have 10+ database technologies in our stack, including open source tools like Neo4j, Cassandra and MongoDB. We also support AWS data stores like DynamoDB, ElastiCache, NeptuneDB, and Aurora. Engineers are spinning up new databases hourly, and we built a database platform to support the provisioning of all these clusters across all of Expedia.
For our brands, we have thousands of database clusters and more than one hundred AWS accounts, all of which used to be managed and provisioned by different teams, often manually and with varying degrees of database familiarity. Because the DB provisioning and automation processes weren’t synchronized across the company, we couldn’t ensure that best practices were always followed, leading to serious governance and license tracking problems. In addition, our inconsistent tooling across brands made it really difficult to resolve issues because of these inconsistencies.
Facing these challenges, we wanted to solve them by creating a unified experience for our developers where they could self-serve provision their data stores. We didn’t want developers to worry about managing any of the databases in their applications, and instead have these be managed completely by the ops team.
Cerebro: Expedia’s Fully Managed Self-Serve Database Platform

To do this, we created a fully managed self-serve database platform that we call Cerebro. Cerebro allows developers to create high quality products without needing to manage any databases. Cerebro supports single-click provisioning, meaning that all a user has to do to provision a database is to fill out a form with simple questions: What’s the cluster name? What’s the size they want? And that’s it! Within 15 minutes, they’ll have their new cluster available.
Within Cerebro, we developed APIs that they can integrate into their CI/CD pipelines. Upon deployment, the new database is automatically provisioned. We designed the platform to be highly scalable. Whenever there is a new AWS account to be integrated, we can onboard that account within minutes. Similarly, it’s simple for Cerebro to support provisioning and management of new data store technologies with a minimal amount of effort from the ops team.
We designed the platform to be self-healing; if a node in a cluster gets terminated for whatever reason, the new node will automatically be created with all the information it needs to join the existing cluster. All of this happens without any manual intervention. So nobody’s losing sleep fixing terminated nodes! Cerebro allows us to take all our best practices and apply them across our databases, using automation to bring our DB experts’ best understanding into every cluster.
Solving the Scale Problem
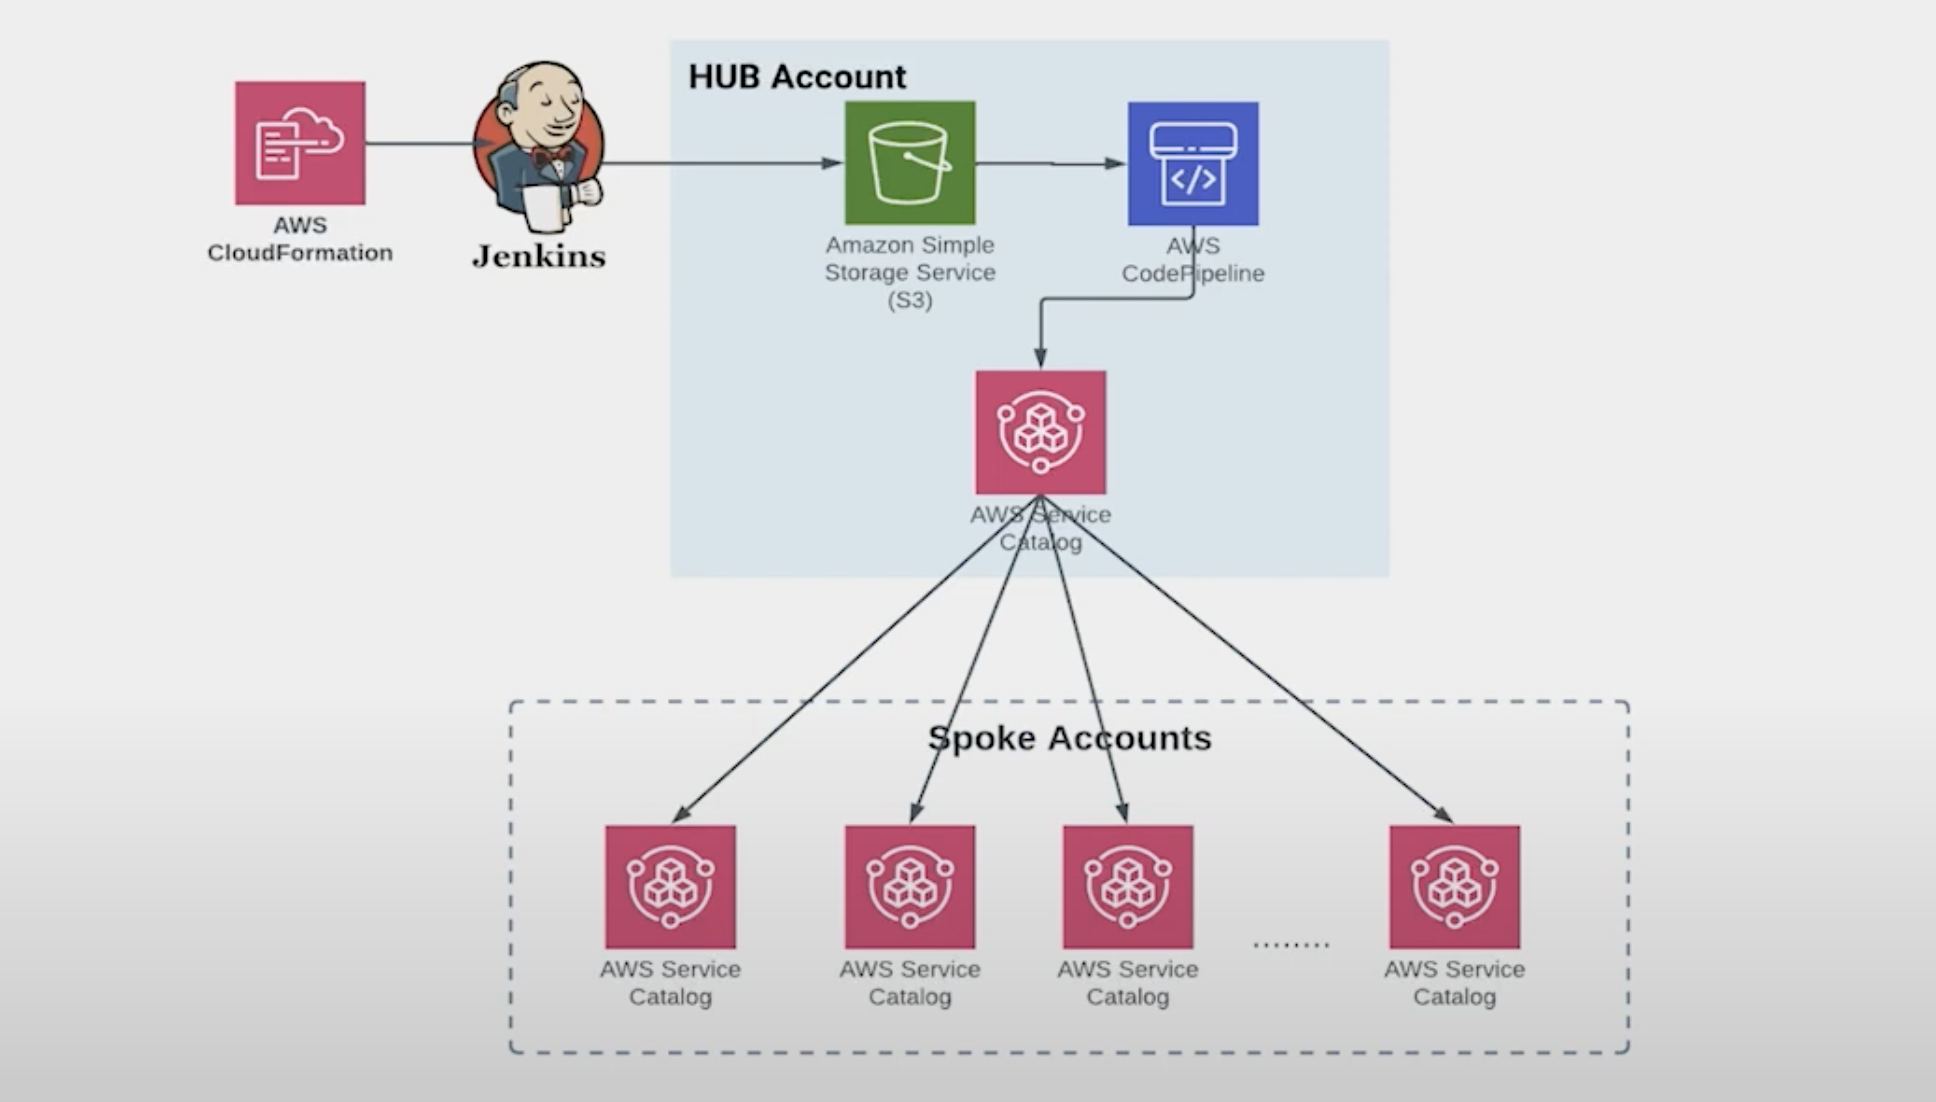
We have 150 AWS accounts that we need to be able to provision. Due to this scale problem, when we designed our platform we worked with AWS and used their service catalog to solve this problem. The AWS service catalog creates, organizes, and governs all AWS products in a hub and spoke model. This allows our ops team to do all their platform development in the hub model, create their product, and then seamlessly push it to the spoke accounts where our internal customers can use the tool and automatically provision databases.
As an example, let’s say we want to release a new version of Neo4j. We’ve already created a pipeline using CloudFormation and Jenkins. All we have to do is create a CloudFormation for Neo4j’s new version and just push it onto our GitHub. That’s it! CloudFormation runs, Jenkins runs, the result is automatically pushed into S3, the code pipelines run, it shows up in the service catalog, and the service catalog now takes care of making that version available across all of the spoke accounts.
Platform Architecture
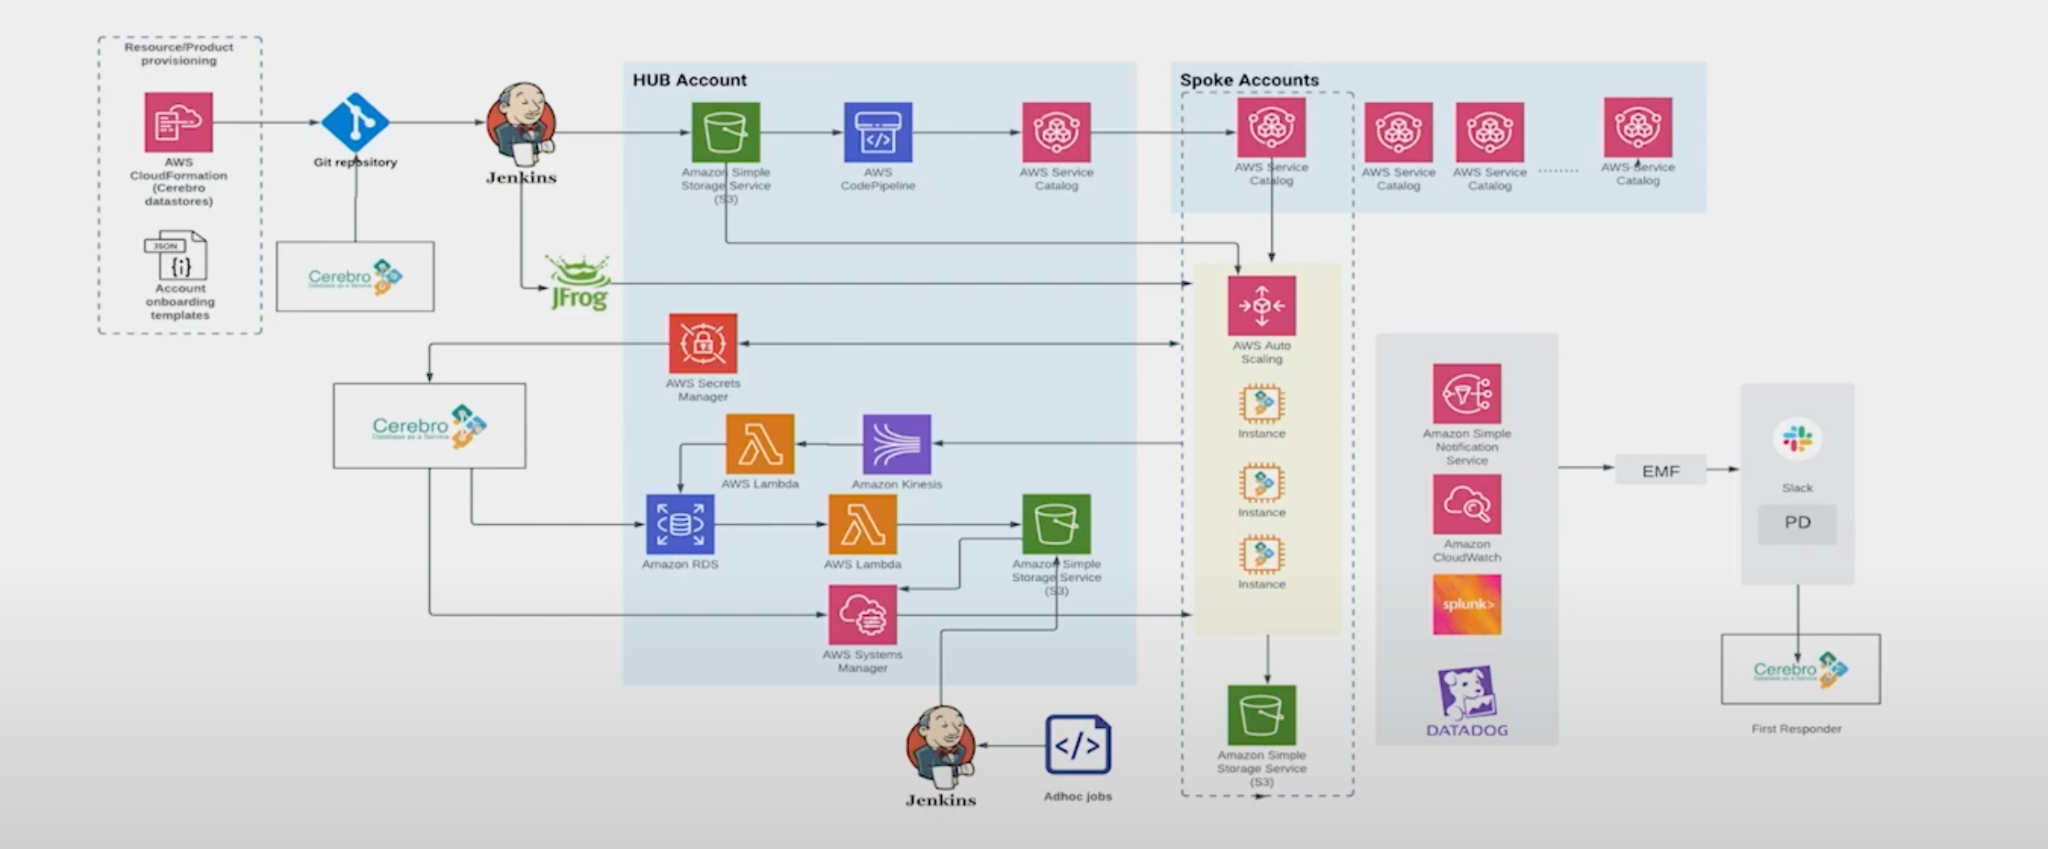
This is the complete platform architecture we have. Across the top we have exactly what I just wrote about: the service catalog, where all the products are seamlessly getting pushed to spoke accounts.
In the center going down from the service catalog are our spoke accounts. We use Auto Scaling groups to provision all the EC2 instances and to create the clusters. Along with this, we also create the load balancer. When these EC2 instances are provisioned, we have an internal Cerebro agent that contains all the logic of creating a new cluster, joining to an existing cluster, and doing all the maintenance backup. This is continuously running on the EC2 instance and performing all the management for us.
The bottom right hand side covers the end-to-end management we do once the cluster is created. We push all our metrics to our logging and monitoring tools and assign pager duty. We have alerts configured on these monitoring tools so that whenever there is an issue in the database we are the first ones to get notified and can be quick to fix it.
On the bottom left is the development hub of the hub-and-spoke system. We pull all the inventory data into our hub and use it as our ops manager. From there, we’re able to quickly answer questions: What is the cluster status? How are the nodes behaving? If we want to run patches and do version upgrades, we also do it from this hub account.
Platform Outcomes: Security, Governance, and Increased Productivity
This database platform allowed us to improve security, governance, and productivity. By default, all databases created by the platform are secure. This means they are encrypted, and provisioning and access has been restricted to certain individuals.
We were able to improve our database governance because the platform automatically enforces all best practices. We’ve added launch constraints for Neo4j so it can only be provisioned on certain larger instances because it is memory intensive. We can even disable old versions of software and make that unwanted software version unavailable for users to provision on new instances.
Most importantly, this platform has increased productivity. The developers who use Cerebro are not waiting on others to provision their clusters. If they want to do a POC they can quickly go to our tool provision for all the data stores they like. Once their POC is done, they can even take it to production. And for production clusters, they can easily scale the clusters themselves in a frictionless process.
Implementation: Strangler Pattern
For transforming a legacy application to an application that uses our standard Neo4j/MongoDB architecture, we’re gonna follow the Strangler Pattern. If you’re on-prem, the Strangler Pattern is a great way to get into the cloud. All you need to do is enable change tracking on your data store, throw these events into a new cloud data store, and then you can move your app to read from this new data store. Doing this allows you to slowly strangle your traffic from your old system onto your new system.
We’ve used this to move from on-prem to the cloud. We’ve also used it to unify the architecture for many of our brands, bringing them together in a unified store,

So let’s talk about the Strangler Pattern we want to follow across our brands. On the left, we have our data sources. Using the Strangler Pattern, we want to create a change stream on all these sources and throw all of that into a queue– for us, it’s usually Kafka. Then, we want to process that change. Here, we pair Neo4j and Mongo.
We use Neo4j to create what we call an entity key graph, which I’ll talk more about in a moment, and finally we put an API on top of it. This lets you render your view of data in your application. We call the combination of Neo4j, Mongo, and the API our Event Driven View.
Design Use Case
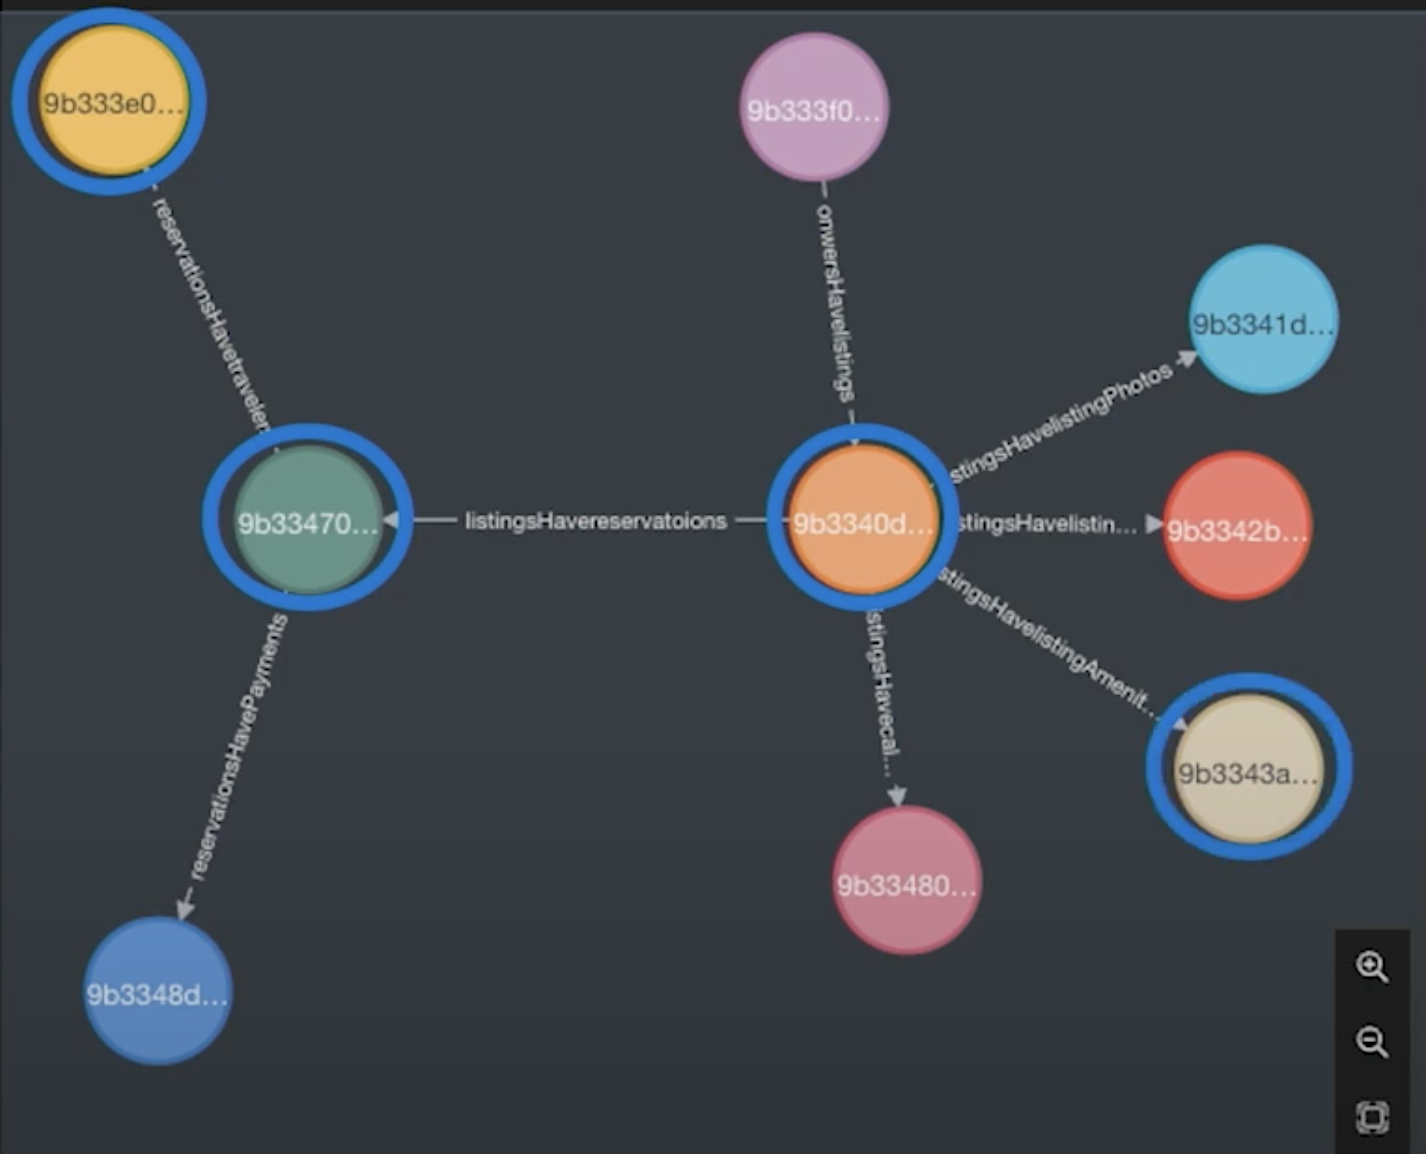
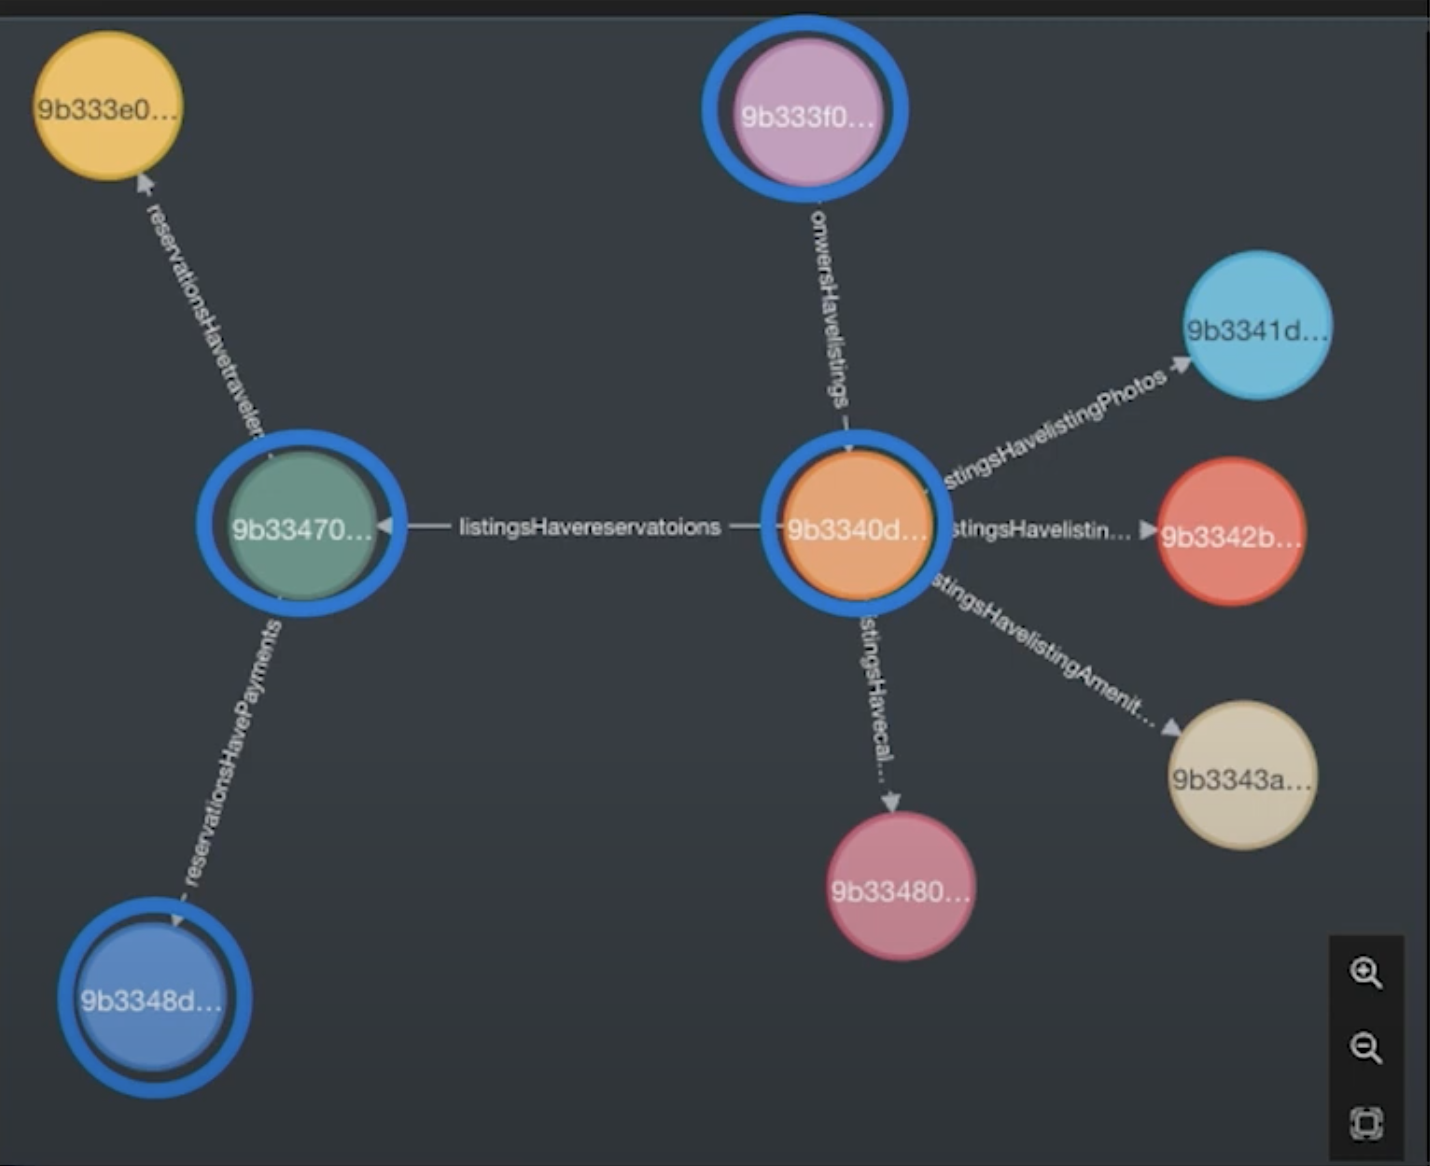
Let’s design a company that Expedia might buy. First, we have a website, which means we have users. What kind of users? If you’re a travel company marketplace, you’re trying to bring together people that are buying and people who are selling. This means we’ll have owners (our suppliers), and travelers (our purchasers). If this business is a vacation rental marketplace, we’d need an entity representing properties and a way to make them look attractive– so, we’ll probably want photos and text. We’d also want to include amenities: Does it have a hot tub? Does it have a hair dryer? Can I bring my dog? We’ll also need to create bookings or reservations against these properties. To do this, we need dates and payments.

In this model, we have our owners and related properties. These properties have photos, headlines, amenities, calendars, and reservations. When a traveler creates a reservation, they’ll make payments on that reservation. This quickly starts to look like a graph. We haven’t done anything explicitly graphy here– all we’ve done is model this in the old relational way,
Building the Graph
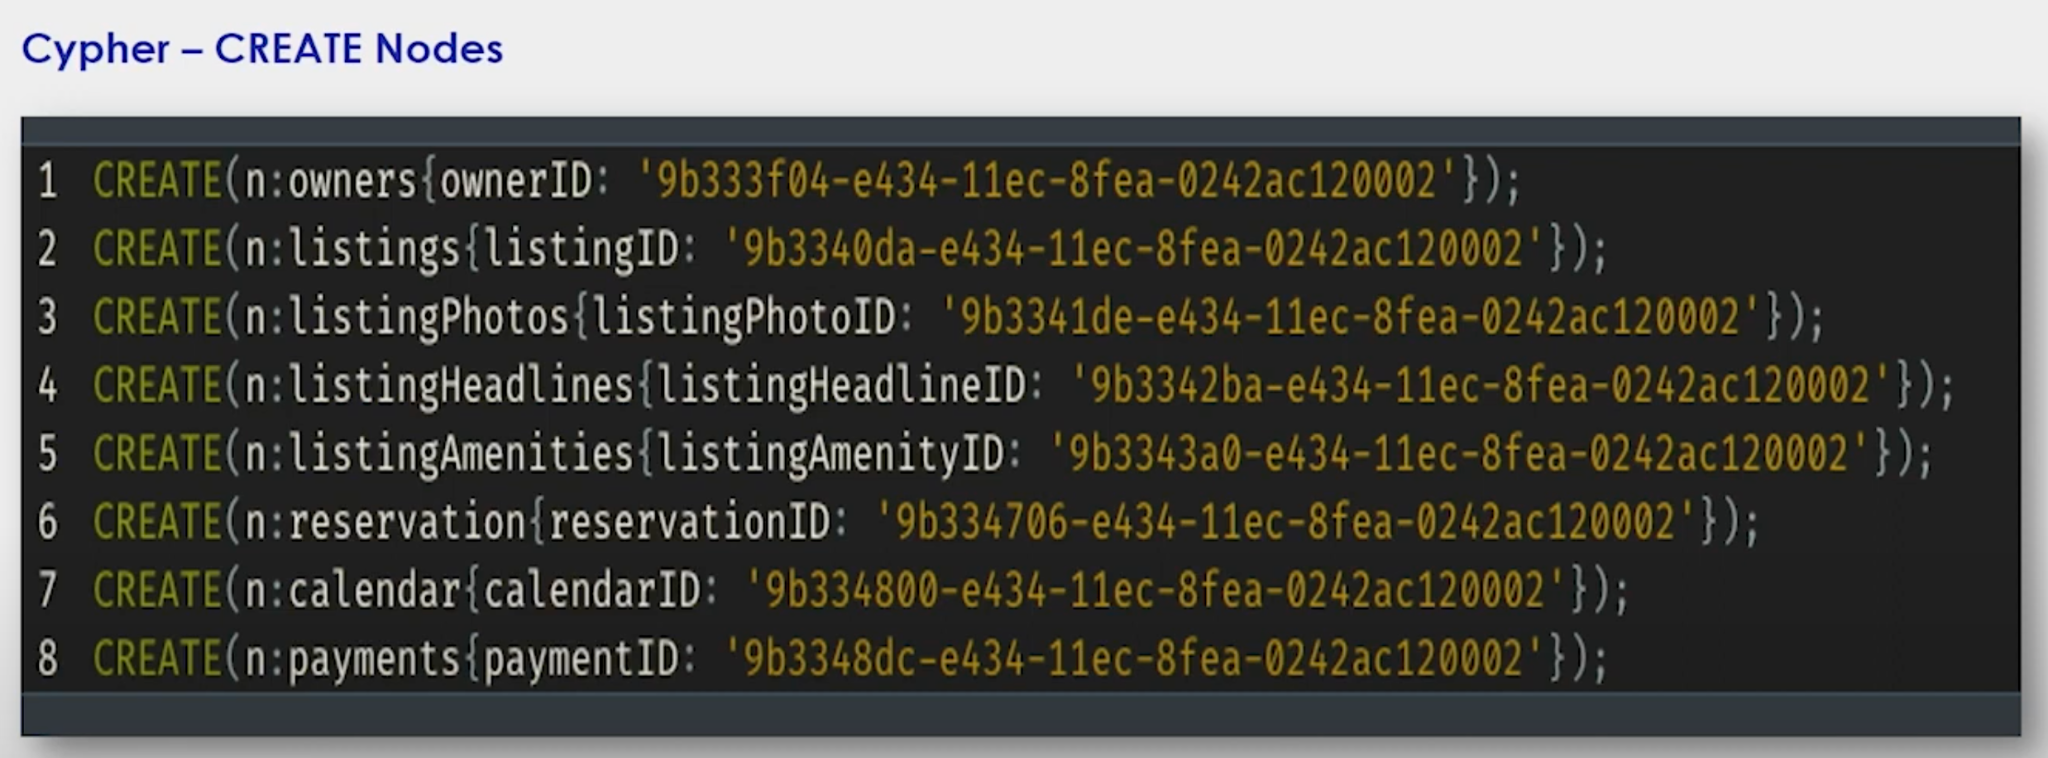
I created some dummy data that has our CREATE statements for all our owners, listings
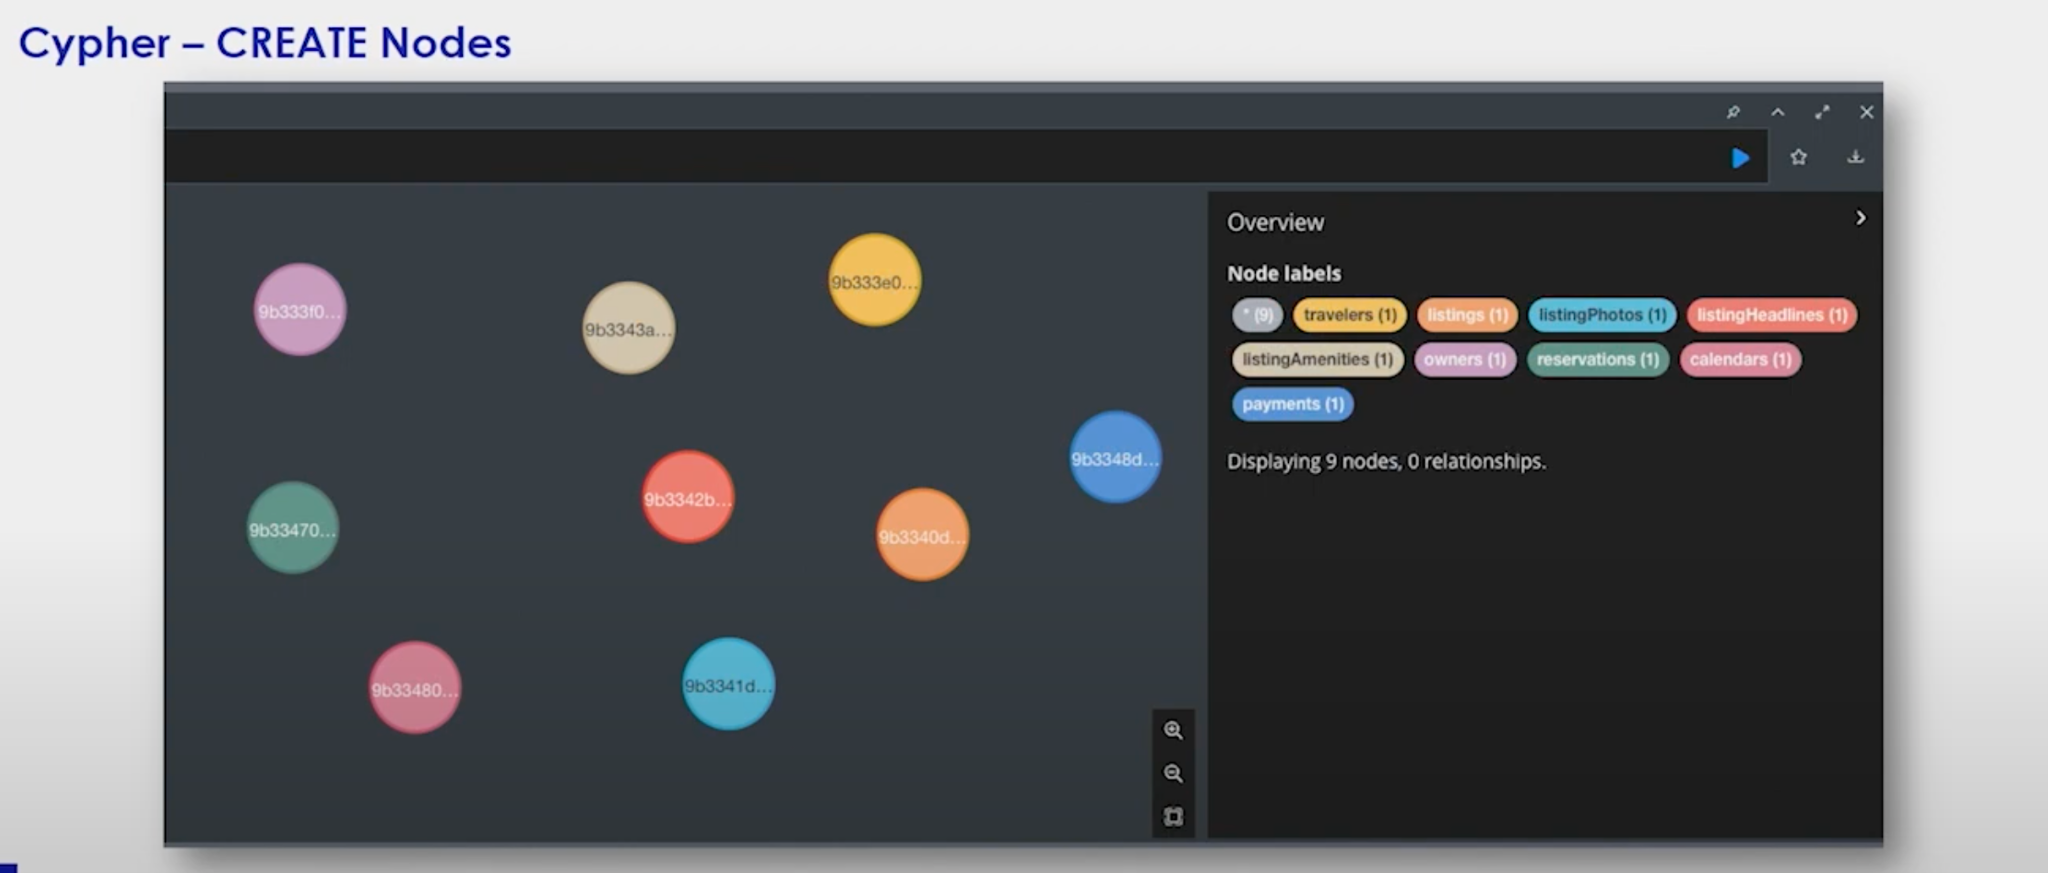
After executing this, here are my nodes.

Now, I create relationships between these entities. I’m free to start solving business problems because I know that things are related.
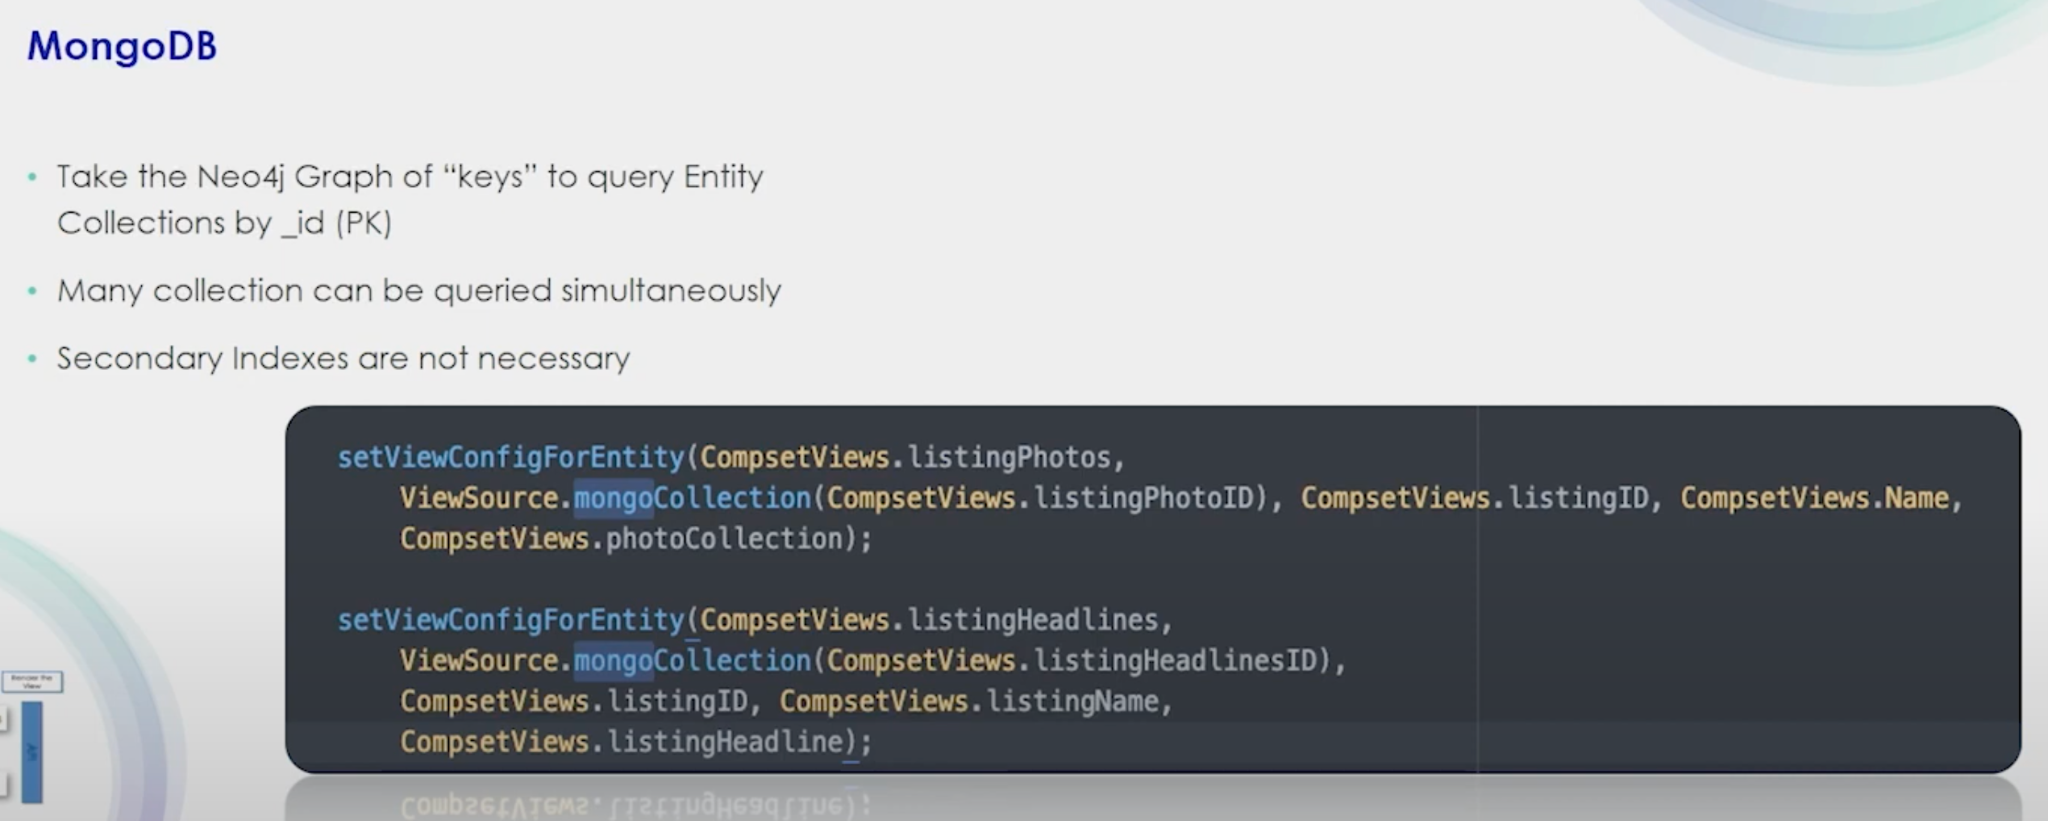
Storing the Attributes: MongoDB
Pairing Neo4j and MongoDB together is a classic pairing, You’ll find white papers and use cases covering this very common pairing of Neo and Mongo.
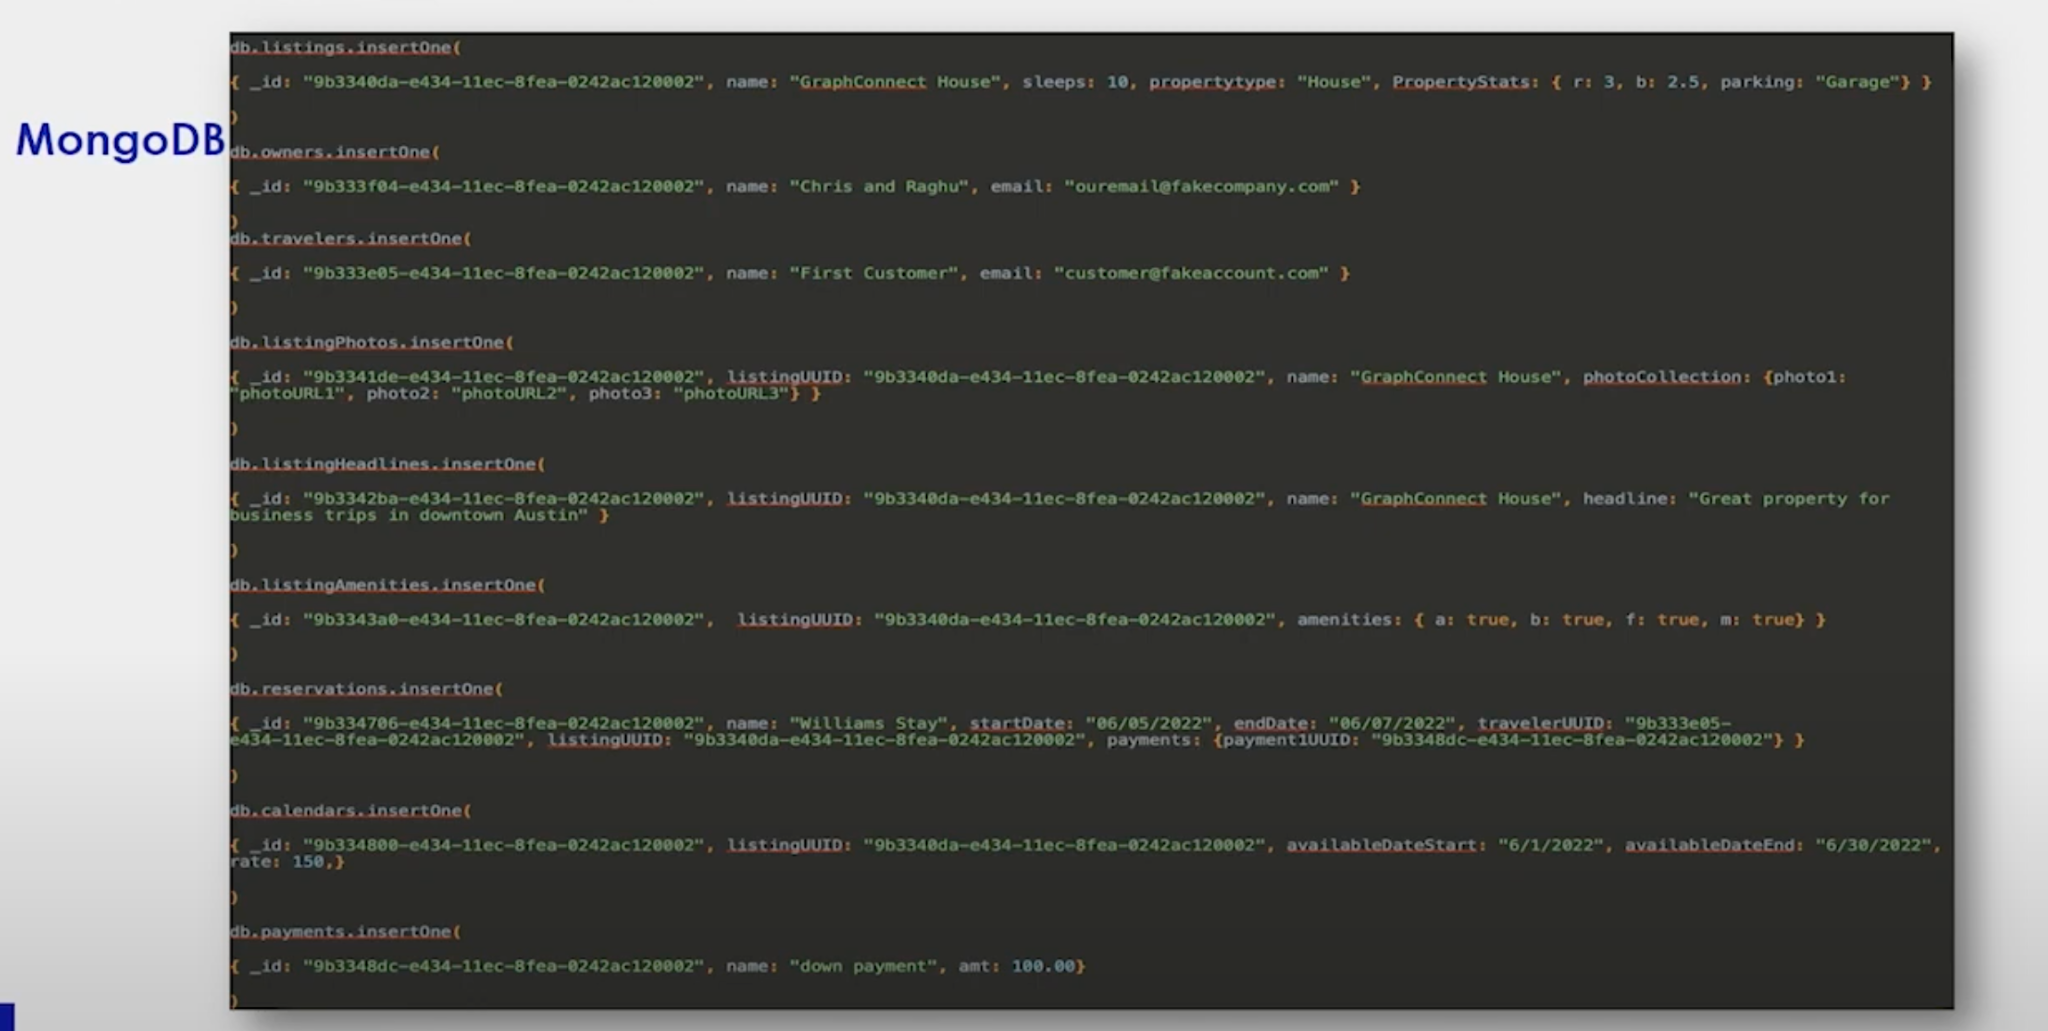
These are our Mongo statements to create the documents inside my collections. There are a couple of places I want you to pay attention to:
- Property Stats: The rooms are three and the sleeps is ten. When we create a listing, it will say three bedrooms, sleeps ten people. It also has a garage and photos to make it look inviting for people to come and stay there.
An architecture using Neo4j and MongoDB together makes it very easy to deal with chatty systems. The way you do this is update Mongo first and then come off of that for Neo. The reason you do it this way and not the other way around is that Mongo dedups for you because it only writes to its change. This dedup is invaluable, now only when key changes are made in Mongo do we propagate that change to Neo.
Rendering the View
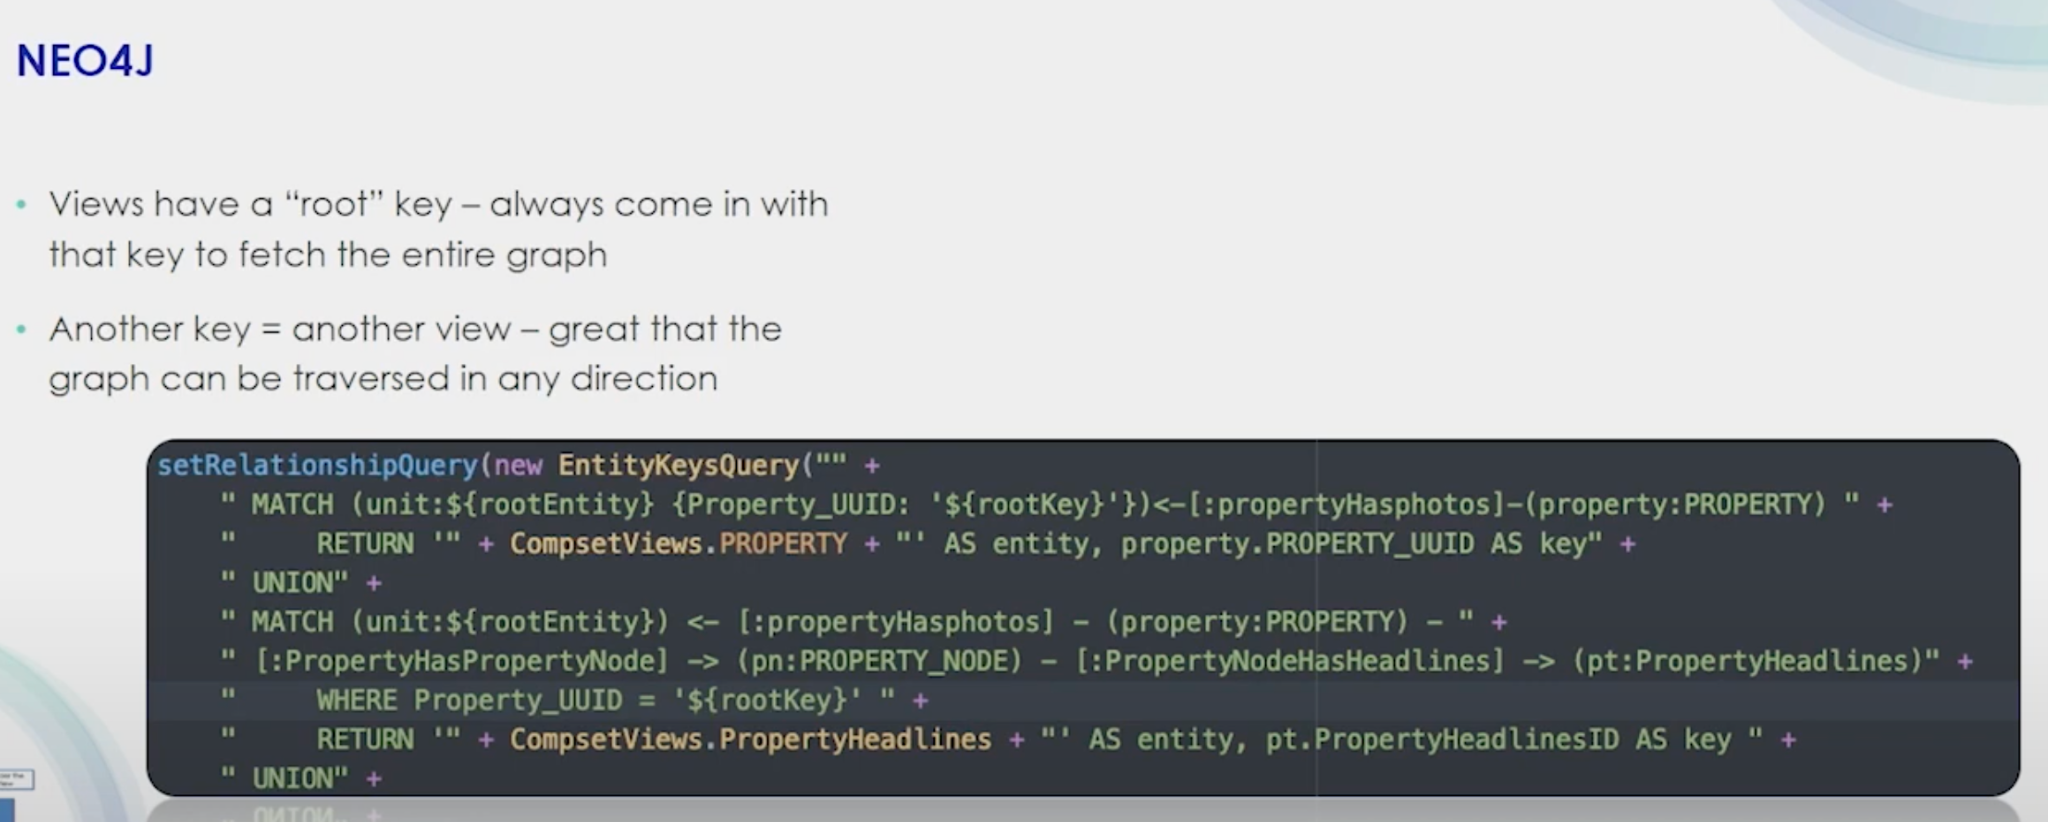
How do we pull all the information we want out of Neo4j and Mongo? We start with a root key, which allows you to start with a key in the graph and find the chain you are looking for. Then you go to Mongo and, using that key, grab all the information in Mongo you need to hydrate your view. Your API would run inside of Neo4J to get the graph that you’re after.
Now you have a full payload for that particular view. Because of this root key architecture and storage in Mongo, our graph is very lean with nothing but IDs in it. The graph keys allow me to jump straight over to Mongo, which uses the same key. This is very scalable because whenever we need to add new information, we just add a new collection, have our new query, and we’re ready. There’s no tuning.
Let’s look at the graph and ask it some questions!
Graph In-Practice: How Many Rooms Does an Owner Have?
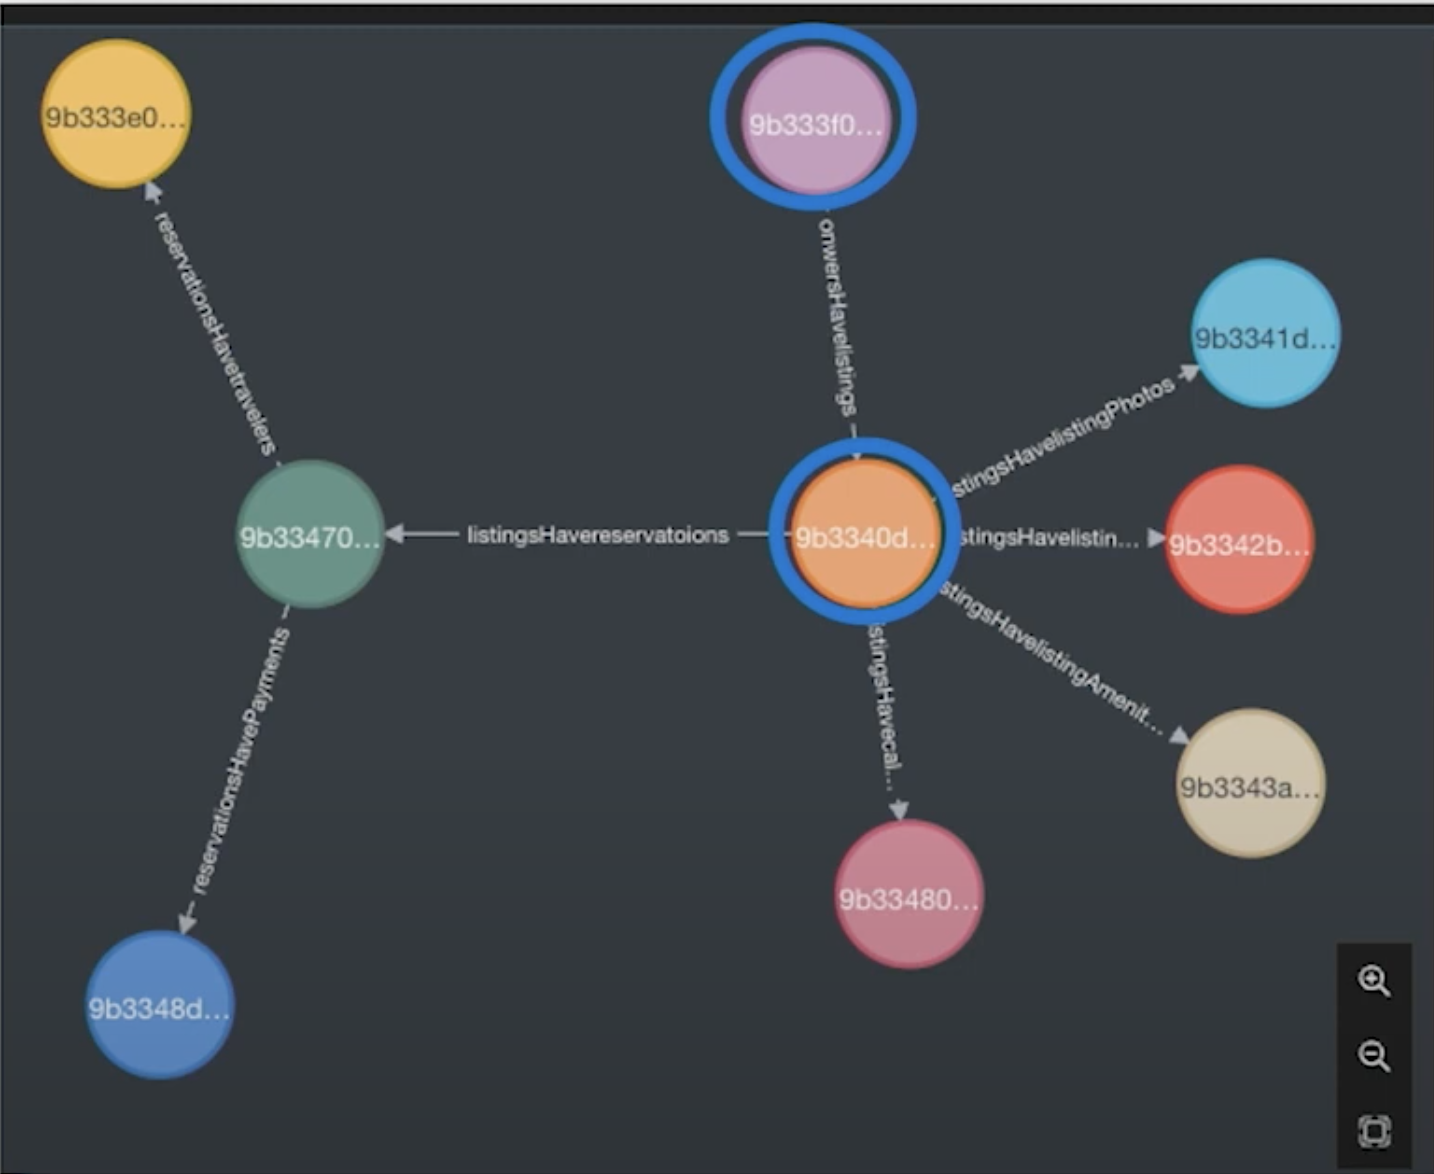
How many rooms does an owner have? If I’m an owner, room nights are a thing that people report on. We can do that easily by starting with that owner node, jump down into all the properties they own, grab that stack, and use those keys to jump over to Mongo. To do analysis, we can grab all the payloads, sum up all the room nights, and answer some real business questions.
Graph In-Practice: Is My Listing Available for That Day?
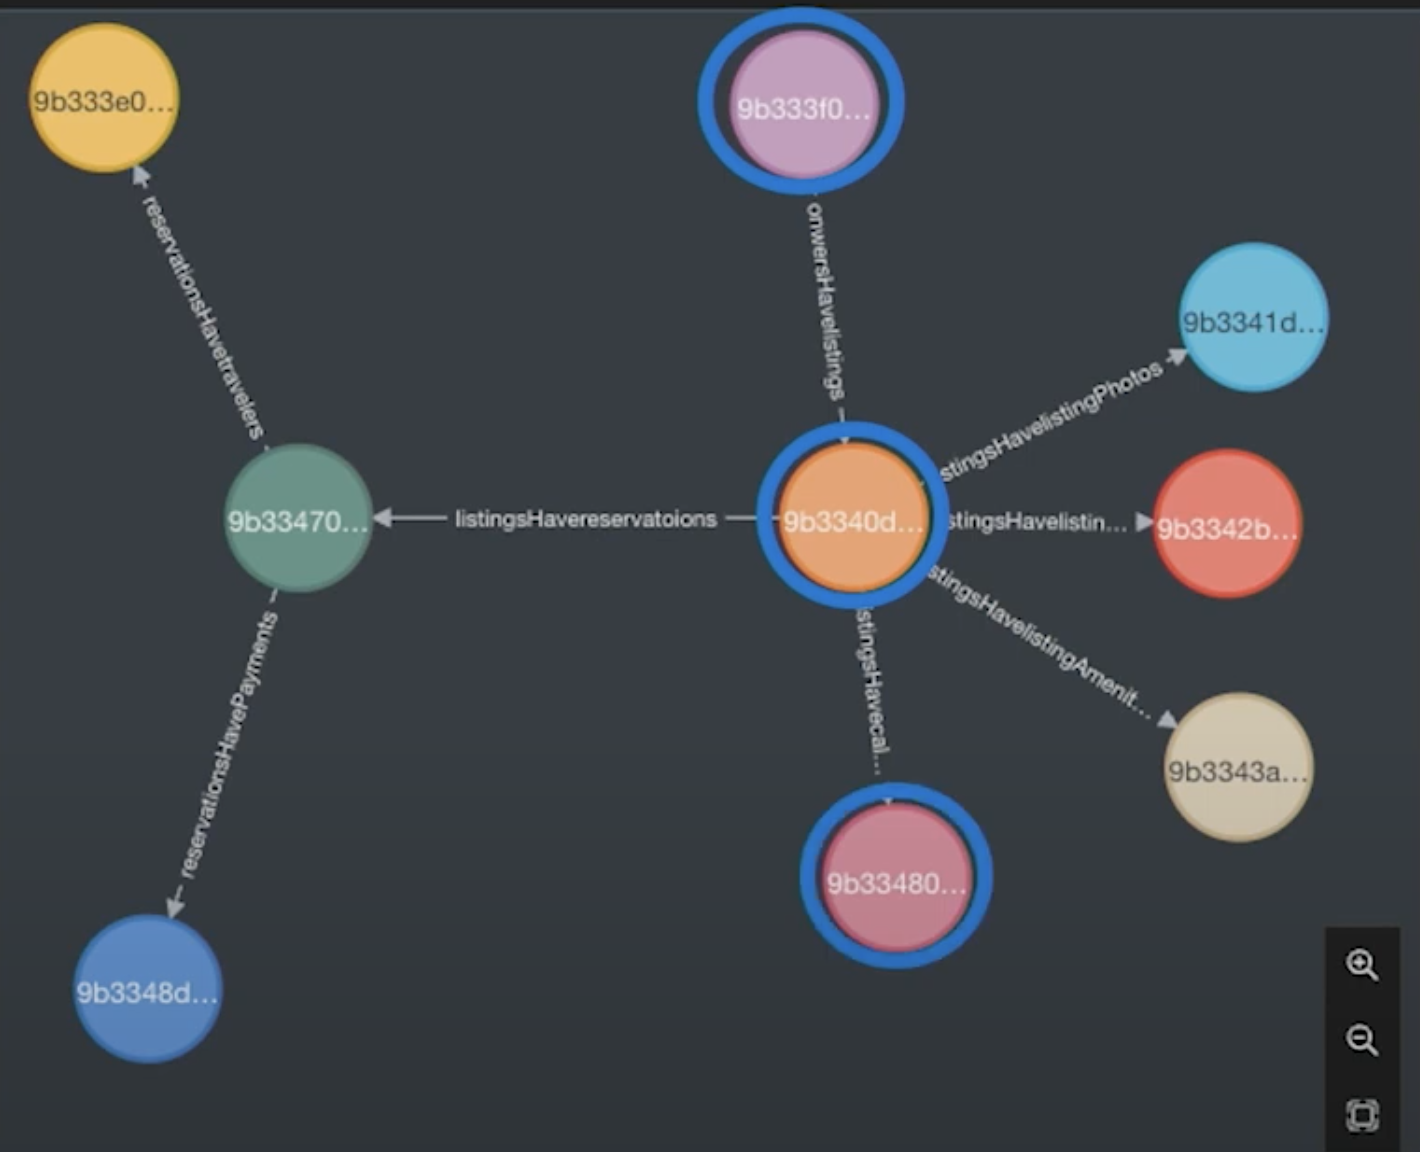
Is my listing available on that day? If I’m an owner, I want to go to my listing and then go to my calendar. From there, I’ll use that graph to jump over to Mongo again, pull the data, and do my analysis.
Graph In-Practice: Does an Owner Have a Listing With a Hot Tub?
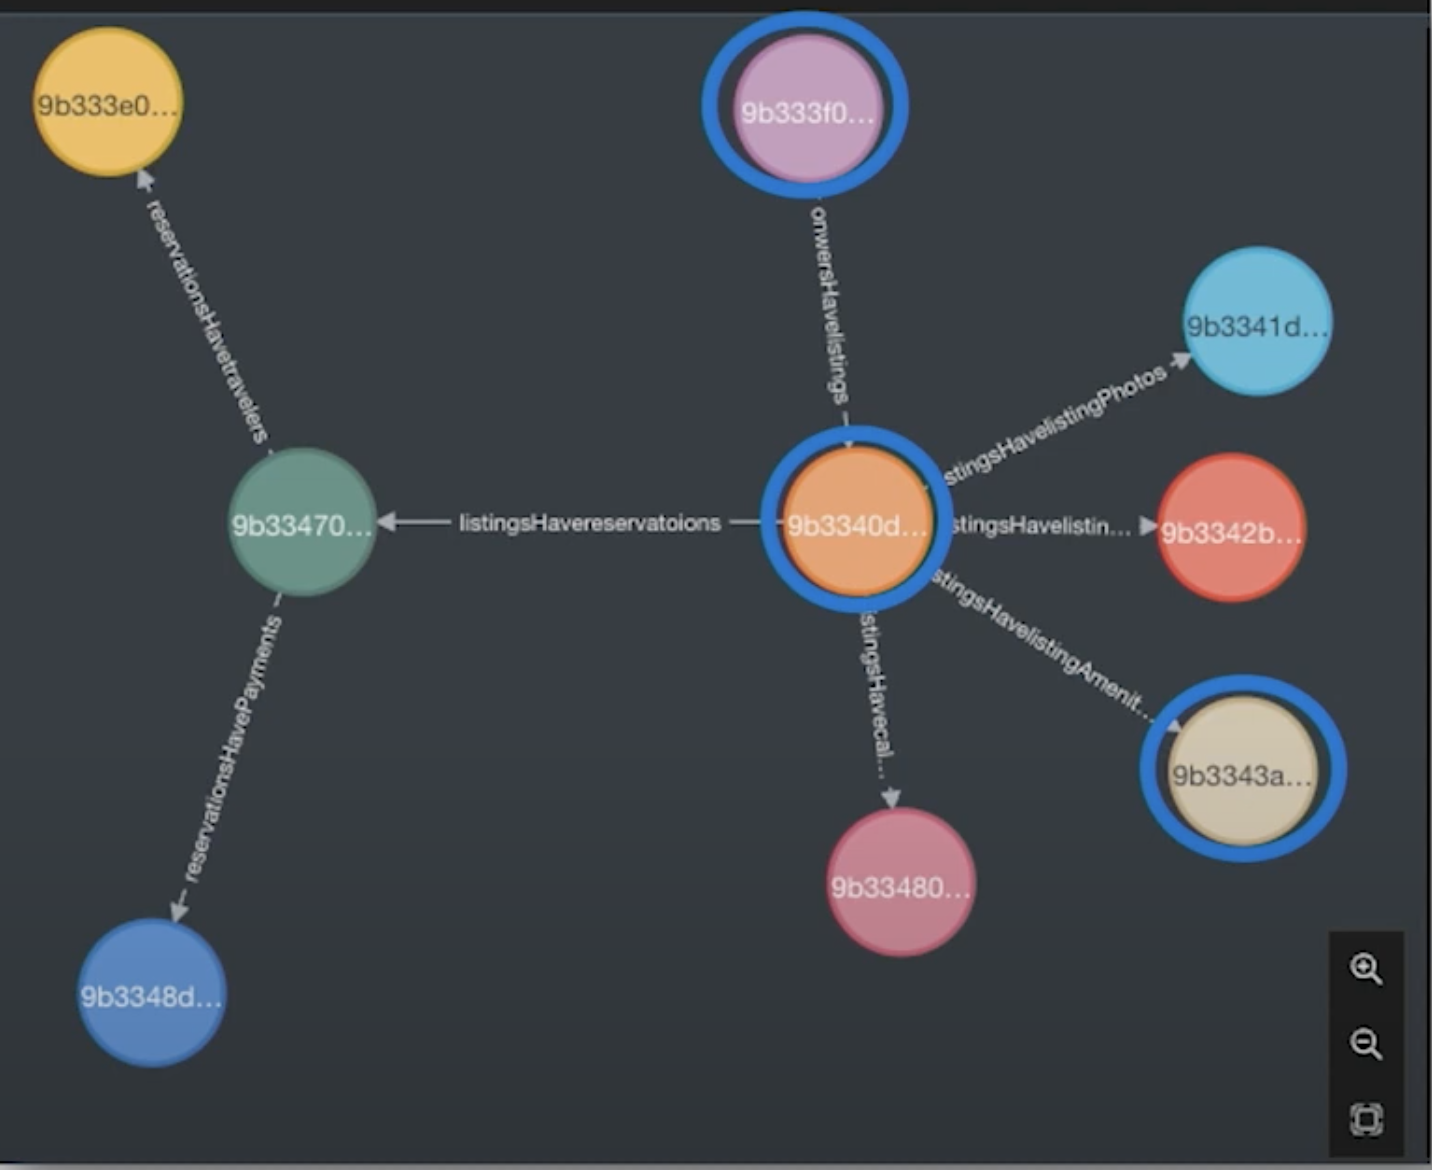
Does an owner have a listing with a hot tub? I start at the root key of the owner and then jump to listings and then to amenities. Now that I have that part of the graph, I can jump over to Mongo and do my analysis.
Graph In-Practice: What Are the Most Frequent Amenities by a Traveler?
What are the most frequent amenities of a traveler? Say someone always stays in a place where they can bring their pet. To find this information, we start with a traveler as our root key, jump over to their reservations, jump to the listings, and then jump down to their amenities.
Graph In-Practice: How Much Money Have I Made?
How much money have I made? Starting with an owner, I go down to my listing, then to my reservations, and finally I can see how many payments have been made.
Graph In-Practice: How Many Photos Does a Property Have?

How many photos does a property have? Let’s say you’re conducting a listing quality check and you’re asking how many photos a property has. We can start at properties, run through to the photos side, and if we see only one photo, that could possibly explain why a property isn’t getting a lot of traffic.
One Graph to Power it All
Remember, this is one graph that is able to answer all of these questions. I don’t have 53 views and 53 graphs to go with it. Each view has a root key. We don’t need to add indexes because we use the ID of the collection in Mongo, giving us super fast queries.
If you think back to our brands, all those brands come with reservations. All those brands come with users. All those brands come with their inventories. And if you set up Neo4J and Mongo right, you can start to funnel all those into a single data store and quickly unify your platform.
Share Article


Explore
Related Articles