What are the different types of graph algorithms & when to use them?


13 min read

Graph algorithms are powerful analytics tools for exploring how entities are connected, revealing patterns and structures within complex networks and allowing you to uncover insights that are otherwise hidden. They provide structured ways to navigate and understand a variety of networks, whether that’s a social network, a map of roads and highways, an organizational chart, or how parts of a system work together.
Traditional tools like relational databases are great for returning lists but can struggle to show you how data relates to other data. The connections are there, but you need a fast and flexible way to see the full picture and recognize connections that aren’t implicit and are, therefore, harder to find. Graph algorithms are designed specifically to traverse the relationships between data points, helping you identify paths, important hubs, natural groups, and patterns in your datasets.
Once these hidden connections are surfaced, you gain the kind of deep insights that lead to smarter and more impactful decisions.
More in this guide:
Understanding graph fundamentals
Graph algorithms are rooted in graph theory, a field of mathematics focused on studying networks — structures made of nodes connected by relationships. Understanding the fundamental concepts of graphs will help clarify how graph algorithms work.
What is a graph?
A graph represents data as a connected network. It consists of:
- Nodes: These represent the individual entities or objects in your data, such as customers, products, employees, locations, or even concepts.
- Relationships (or Edges): These are the connections between nodes, showing how each data point relates to one another. Examples: a customer
BOUGHTa product, an employeeREPORTS_TOa manager, a personDRIVESa car, or two people areFRIENDS. - Properties: These are key-value pairs holding attributes or metadata about your nodes and relationships. A
Carnode might have properties like brand orvehical_identification_number, while aBOUGHTrelationship could have apurchase_date property.

Graph traversal
One of the most basic operations in graph analysis is traversal — the process of systematically visiting nodes by following their relationships. Imagine navigating a map by moving from city to city along roads; graph traversal is similar. The two most fundamental graph traversal algorithms are breadth-first search and depth-first search.

Breadth-first search (BFS)
This algorithm explores the graph layer by layer. Starting from a node, it visits all the nodes’ immediate neighbors first, then visits all their neighbors, and so on. Think of ripples expanding outwards on a pond.
Depth-first search (DFS)
This algorithm explores as far down a single path as possible before backtracking. Starting from a node, it picks one neighbor, visits it, picks one of its neighbors, and continues down the path until it hits a dead end, at which point it backtracks to explore other branches.
While simple, BFS and DFS are crucial building blocks used within many more complex graph algorithms.
Key graph properties
The characteristics of your graph data influence which algorithms you might use and how they behave.
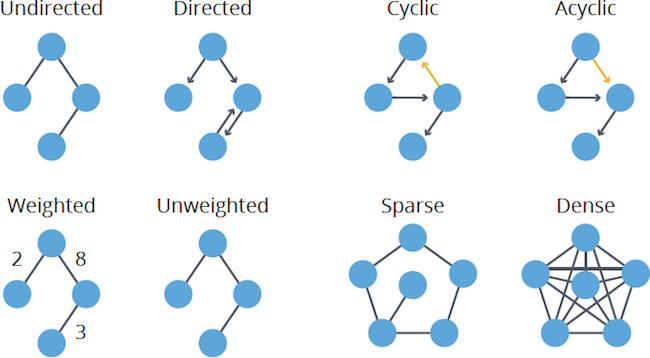
Directed vs. undirected
Do relationships have a specific direction that matters (e.g., FOLLOWS on social media, which is a one-way street)? Or can they be treated as mutual or bidirectional (e.g., FRIENDS_WITH, more like a highway)? Some algorithms work differently depending on directionality.
Cyclic vs. acyclic
Does the graph contain cycles — paths that start and end at the same node (e.g., circular dependencies)? Or is it acyclic, meaning it has no cycles (common examples include organizational hierarchies or project task dependencies, often called Directed Acyclic Graphs or DAGs)? Cycles require special handling in some algorithms.
Weighted vs. unweighted
Do your relationships (or sometimes nodes) have numerical values, known as weights (e.g., distance between locations, cost of a connection, strength of a tie)? Or are all connections considered equal (unweighted)? This heavily impacts pathfinding algorithms, where “shortest” might mean the lowest weight instead of the fewest hops.
Sparse vs. dense
Does the graph have many connections relative to nodes (dense) or relatively few connections (sparse)? Most real-world graphs are sparse, and density can impact algorithm choice and performance, particularly for community detection.
Understanding the core components of a graph, traversal methods, and graph properties provides a solid foundation for exploring the types of graph algorithms we’ll cover in the next section.
What are the different types of graph algorithms?
There are many graph algorithms, each designed to answer different kinds of questions about your data, generally using the graph properties and traversal methods we just discussed.
The good news is that you don’t need to design these algorithms yourself. Neo4j Aura Graph Analytics provides a library of 65+ pre-built graph algorithms that you can easily access and apply to your data.

Pathfinding algorithms: How are things connected?
Pathfinding algorithms focus on finding the best way to move from one node to another within your graph. These algorithms are essential for understanding connections and routes, often considering factors like distance, time, or cost represented as weights on the relationships.

Key Questions Answered:
- How are these two entities connected?
- What’s the shortest/cheapest/fastest route between A and B?
- Are there any loops (cycles) that include certain nodes?
- What’s the critical path in a process or dependency graph?
- What are the degrees of separation between two nodes?
Key Algorithms:
- Dijkstra’s Algorithm: Computes the shortest path based on relationship weights (e.g., cost, distance) in graphs with non-negative weights.
- A* Search: An informed search algorithm for weighted graphs, often used for routing (like maps), that uses heuristics to find shortest paths efficiently.
- All Pairs Shortest Path (APSP): Calculates the shortest paths between all pairs of nodes in the graph.
- Single Source Shortest Path (SSSP): Finds the shortest paths from one specific starting node to all other reachable nodes.
- Minimum Spanning Tree: Connects all nodes in a graph with the minimal total edge weight possible without creating cycles.
Centrality Algorithms: What’s Important or Influential?
Centrality algorithms help you measure the importance or influence of individual nodes within the network based on their position and connections.

Key Questions Answered:
- Which nodes are the most influential or critical?
- Which nodes act as key connectors, bridges, or hubs?
- Where are potential bottlenecks or centers of activity?
- Which nodes are most easily reachable by others?
Key Algorithms:
- Degree Centrality: Measures importance based simply on the number of direct connections a node has; useful for identifying locally popular nodes.
- Closeness Centrality: Identifies nodes that have the shortest average distance to all other nodes.
- Betweenness Centrality: Measures how often a node lies on the shortest paths between other pairs of nodes, highlighting bottlenecks or bridges.
- PageRank: Measures influence based on the quality of incoming links from important nodes; commonly used for ranking relevance or influence.
Community detection algorithms: What are the natural groups?
Community detection algorithms help you find natural groups or clusters within your data. They identify sets of nodes that are more densely connected to each other than they are to the rest of the network.

Key Questions Answered:
- What distinct customer segments exist based on behavior or connections?
- Can we spot potentially coordinated groups, teams, or fraud rings?
- What are the natural subdivisions or clusters within a network?
- Are all parts of my graph connected, or are there isolated islands?
Key Algorithms:
- Louvain Modularity: Finds communities by optimizing network modularity (density within vs. between groups). This method is widely used and is good for large networks.
- Leiden Modularity: An improvement on Louvain, offering better-defined and more stable community detection.
- Label Propagation (LPA): A fast, semi-supervised approach where nodes adopt the majority label of their neighbors; good for large graphs where speed is key.
- Strongly Connected Components (SCC): Finds sets of nodes where a path exists in both directions between any two nodes within the component (only for directed graphs).
- Weakly Connected Components (WCC): Finds sets of nodes where a path exists between any two nodes, ignoring relationship direction.
Similarity algorithms: What entities resemble each other?
Similarity algorithms calculate how alike entities are, comparing them based either on their properties or their connections within the graph.

Key Questions Answered:
- Which customers have similar tastes or behaviors?
- What products are frequently purchased together or are structurally similar?
- Are these two entities related in a meaningful way, even if not directly connected?
- Can we find nodes that share similar network neighborhoods?
Key Algorithms:
- Node Similarity: Calculates similarity based on shared properties or relationships connected to the nodes.
- Jaccard Similarity: Measures similarity based on the ratio of shared neighbors to the total unique neighbors between two nodes; good for finding nodes with overlapping connections.
- K-Nearest Neighbors (KNN): Finds the ‘k’ most similar nodes based on property vectors or node embeddings.
Link prediction algorithms: What connections might happen next?
Link prediction algorithms estimate the likelihood that a relationship might form between two currently unconnected nodes in the future. They typically work by analyzing the existing network structure around the nodes in question.

Key Questions Answered:
- Who might become friends or follow each other soon in a social network?
- What product is a customer likely to buy next based on similar buyers?
- Which potential connections (e.g., in fraud or research) warrant further investigation?
- Can we infer missing links in our data?
Key Algorithms:
- Adamic-Adar: Predicts links based on shared neighbors, giving more weight to less common neighbors.
- Common Neighbors: A simple metric based on the number of neighbors two nodes share.
- Preferential Attachment: Predicts links based on the principle that nodes with more connections are likely to form new ones (“rich get richer”).
- Resource Allocation: Models potential links based on how “resources” might flow between nodes via their common neighbors.
Node embedding techniques: How can we use graph structure for ML?
While distinct from traditional graph algorithms, node embedding techniques are powerful methods often used with graph data. They create numerical vector representations (embeddings) for each node, effectively capturing its complex context and relationships within the graph’s structure. These embeddings serve as rich inputs for machine learning (ML) models, enabling sophisticated tasks like highly accurate node classification, advanced recommendations, or finding nuanced similarities based on deep network patterns.

Key Questions Answered:
- How can we represent complex graph structure numerically for machine learning?
- Can we find deep similarities or analogies between nodes based on network position?
- How can we use relationship information to improve ML model accuracy for tasks like classification?
Key Algorithms:
- GraphSAGE: Generates node embeddings by sampling and aggregating features from a node’s local neighborhood, enabling inductive learning that can generalize previously unseen nodes.
- Node2Vec: Creates vector representations of nodes by optimizing a neighborhood-preserving objective with parameters that balance local and global network views.
What are graph algorithms used for?
Graph algorithms aren’t just theoretical concepts; they’re used across industries to tackle real-world problems. By analyzing relationships within data, they reveal insights from connections that traditional methods often miss, leading to improved decisions and better outcomes. More often than not, a use case requires using multiple graph algorithms concurrently or sequentially to deliver results. Let’s look at some common real-world applications of graph algorithms.
Detecting sophisticated fraud
Fraud rings coordinate complex schemes (using fake IDs, layering transactions, etc.) that are hard to detect. While each single action or account might fly under the radar, the pattern of connections often reveals the fraud.
Graph algorithms are particularly effective for fraud detection: Community Detection can find clusters of accounts acting together suspiciously or identify fraud rings with algorithms like Weakly Connected Components, while Similarity algorithms spot new accounts sharing details (like phone numbers or devices) with known fraudsters. Pathfinding can follow the trail of money or connections between accounts. Analyzing these links helps catch complex fraud earlier, cut losses, and make alerts more accurate.
Powering smarter recommendation engines
Good recommendations require understanding user preferences and item relationships hidden in the connections between them, going beyond simple popularity or demographics. Graph algorithms help uncover these nuanced patterns to make better, more personalized recommendations.
Similarity algorithms find users with similar tastes or items often bought together, Community Detection algorithms group users for targeted recommendations, and Link Prediction algorithms suggest items a user might interact with next. This leads to more relevant suggestions, better user engagement, and improved discovery.
Optimizing supply chains and logistics
Supply chains are complex networks connecting suppliers, makers, distributors, and customers. Understanding the links revealed by analyzing the graph structure is key to optimizing routes or managing risks by revealing bottlenecks and key pathways that are often otherwise missed.
Pathfinding algorithms help find the most efficient routes considering factors like distance or time, while Centrality algorithms identify bottlesnecks, such as important hubs or suppliers where delays would cause the biggest impact. This analysis helps improve logistics, lower costs, speed up deliveries, and make supply chains stronger.
Simplifying identity and access management (IAM)
Understanding identity and access is critical for security, especially with complex hierarchies of users, groups, roles, and resources. Representing these relationships as a graph allows for a clearer analysis of effective permissions than list-based approaches.
Pathfinding algorithms can determine a user’s access rights by tracing through all relevant connections (groups, roles). Centrality analysis might identify overly privileged accounts. Using graph algorithms helps ensure correct access levels and simplifies audits by clearly mapping complex access rights.
Optimizing network and IT operations
Modern IT infrastructure relies on complex dependencies between components, making troubleshooting difficult when only monitoring individual metrics. Graph analysis helps visualize and understand the vital connections between servers, applications, and users for better planning and issue resolution.
Pathfinding can trace dependency chains to find the root cause of outages or map potential attack paths. Centrality algorithms pinpoint critical components whose failure would have the widest impact. This helps IT teams resolve issues faster and improve system reliability.
Enhancing ML with graph features
ML models perform best with rich features, and key information often lies in the data’s connections, which standard feature engineering on tables might miss. Node Embedding techniques address this by translating complex relationships and a node’s network position into numerical features (vectors).
These graph-derived features allow standard ML models to understand network context. Using embeddings can significantly boost the accuracy of tasks like predicting customer churn or classifying content because the model gains insight from the network structure.
Getting started with graph algorithms
Now that you understand the types of graph algorithms and their uses, how can you start applying them? Neo4j Aura Graph Analytics is designed to help you do just that, providing the tools to uncover connected insights from your data and improve decisions.
- Extensive Algorithm Library: Access 65+ ready-to-use graph algorithms covering all the categories we discussed, pre-tuned for performance.
- Run Anywhere, Zero ETL: Integrate graph analytics seamlessly into your existing workflows. Run analyses on any enterprise data without complex ETL processes, and work within familiar data science environments.
- Efficiency and Scalability: Scale compute up or down independently for intensive processing of analytics needs, all with the confidence of pay-as-you-go pricing.
Check out the graph algorithms documentation for detailed implementation guides
Get Started for Free
Ready to implement graph algorithms? Get started with 65+ graph algorithms in Neo4j Aura Graph Analytics for free now.
Share Article


Explore
Related Articles
Neo4j Named “One to Watch” in Snowflake’s 2026 Modern Marketing Data Stack Report

SumoDB in Neo4j: Chaining Multiple Graph Algorithms in Snowflake — Part 3


Why machines need embeddings: Turning graph structure into features