Graph Analytics for Business Users: 5-Minute Interview with Robert Allison of Kineviz

Partner Marketing Lead for the Solution Partners, Neo4j
5 min read

I am pleased to share this interview with Robert Allison, Director of Product at Kineviz. Robert has a strong background in software development, engineering, and architecture, which makes it a perfect crossover between art and technology.
In this conversation, Robert explains how Kineviz provides products and services for graph analytics, how it works with a graph database like Neo4j, and also dives into their awesome GraphXR product, which helps users sort through data seamlessly.
Julia Astashkina: So Robert, I know that Kineviz is in the business of providing graph analytics. Why do business users actually need graph analytics?
Robert Allison: So business users, they’re in the business of gathering and analyzing data in order to make good business decisions and to support those decisions with the data. So the graph, graph analytics and graph visualizations help with that process.
Graph analytics also give business users the support they need to not only make the decisions – and not only to sort of gain the insights into the data – but also then to support those decisions to other stakeholders in their business, clients and so forth.
Julia: Are there any obstacles that hold users back?
Robert Allison: As things stand in the technological environment that we have today (which is it’s still very new, really), a lot of the tools that business users would need to use or would like to use in order to support their decision-making are still in their infancy.
They are also still very technological, because of course they’re technological tools. So they’re grown out of scientists and technologists who have been working with data more at the technical level. The tools are still in their infancy and they’re perhaps not as user friendly to non-technical people.
So this is a big challenge at the moment. For example, queries. You have a database and you can query the database with SQL, and SQL is a very, very powerful tool that can tell you many things. But in order to use SQL properly, you need to have a reasonably good technical insight into SQL and the database systems you might be using.
As we move beyond SQL and SQL systems to AI-type systems or more complex information gathering and producing management systems, these tools and interfaces themselves are, again, more complex. So that’s what causes a lot of headaches for business users when they’re trying to use these technologies.
Julia: Given all that, what does the graph enablement look like?
Robert: It’s about assembling data from different sources. The great thing about the graph database is that it’s sufficiently general to support relational databases, as well as to support data from social media as an input. It can serve as an overall, one data structure to rule them all.
But at the same time, it’s actually very intuitive and it corresponds quite closely to the way we understand the world around us. So you don’t need deep technical knowledge to get the most out of a graph representation for data.
Julia: And I understand that you have a product, GraphXR. How can this product support business users?
Robert: GraphXR can talk to the data sources you already have, so it can talk to your SQL databases. It can talk to your social media as information sources. And it can assemble these various data sources into sort of one coherent whole. This includes enrichment from other data sources. It may include existing data that you have, that you can just put in there, and GraphXR allows you to visualize the data and filter the data to sort through the data.
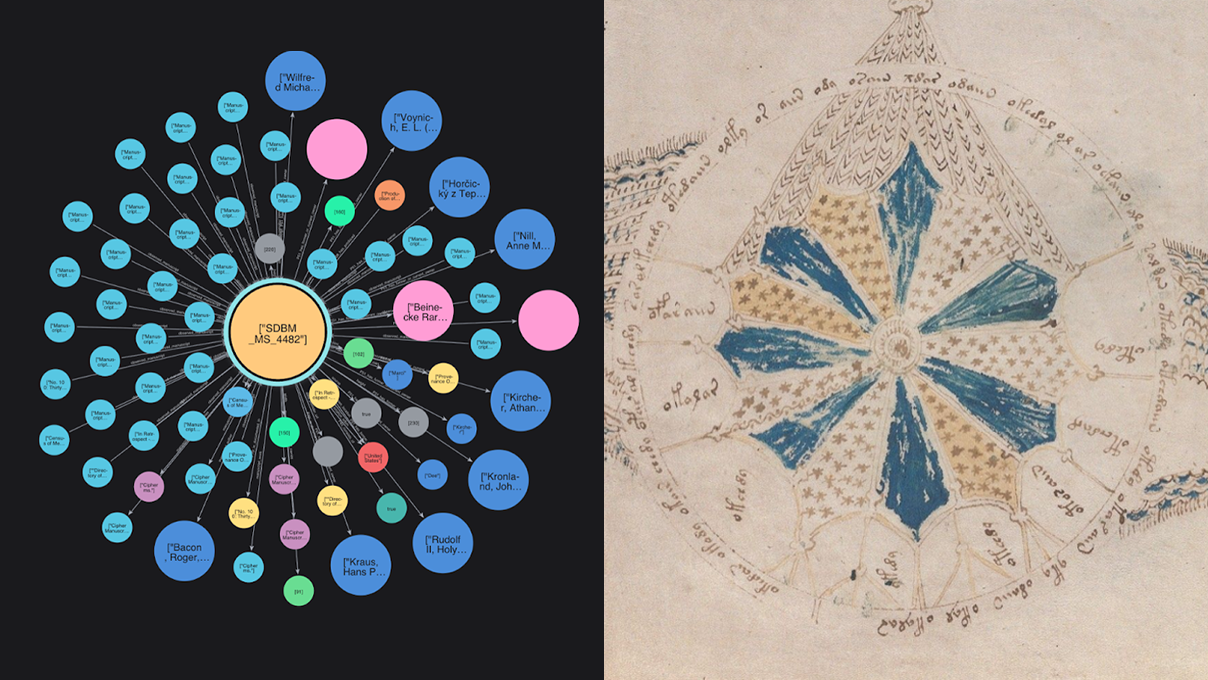
When you have all this data available to you, the first thing you need to do is a bit of discovery, really, and to see what data you have and how clean the data is. So GraphXR can help you with that by immediately showing and visualizing how your data connects together in this intuitive, three-dimensional graph representation. GraphXR is three-dimensional, which is an advantage over a two-dimensional representation because more complicated relationships can be expressed, mapped and visualized.
And because of the physics engine that’s behind the forced layouts of GraphXR, it untangles your data for you if you like. So it will associate pieces of data in a more connected way.
One example is social media data, which relates to people’s connections through work and college. If you have a large amount of data and you can make these connections, then people who are very connected will, of course, immediately stand out, but also clubs of connections. So maybe it’s surrounding a school or a college or a workplace. You can easily see which sort of societies exist within your social media data. That’s very easy to do with GraphXR, it’s just as soon as you just bring the data in from SQL, from CSP or from other sources immediately, these sorts of connections jump out at you.
So that’s discovery. But then you could work more with your data. So if you need to highlight or emphasize particular insights that you’ve gained through your discovery process, you can use GraphXR to filter out things that are not of interest to do transformations.
So perhaps aggregation transformations, where you may collapse some of those and just represent it as a value, or even tease out some of the values that you’ve seen in your data and build new relationships that weren’t necessarily present in your original data, but you can see and you can then promote some brick to the foreground.
And then finally, GraphXR will help you visualize this in a way that helps with your reporting, so that when you do want to present your insights to other stakeholders, GraphXR makes it easy for you to do.
Julia: Fascinating. Well, thank you very much for sharing this with our audience. And we are looking forward to following Kineviz and our audience can check out more at kineviz.com. Thank you, Robert.


