Graph-based enterprise architecture management

Co-Founder, Linkurious
4 min read
In this process, understanding and modeling interdependencies between entities is key. With relationships at the center of their model, graph technologies like Neo4j
and Linkurious are ideal to drive change and innovation in complex environments.
Enterprise architecture: Managing change & complexity
Where startups start with a blank page, mature organizations have to accommodate a complex set of objectives, infrastructures or processes when they consider change. Unmanaged, this complexity turns into paralysis and eventual replacement by more agile competitors. That’s why enterprise architecture is necessary for business or IT executives who need to balance the need for innovation against security and operational efficiency.
Typically an enterprise architecture framework is divided in four domains: business architecture, data architecture, applications architecture, technology architecture.

Taken separately, each layer has its own complexity.
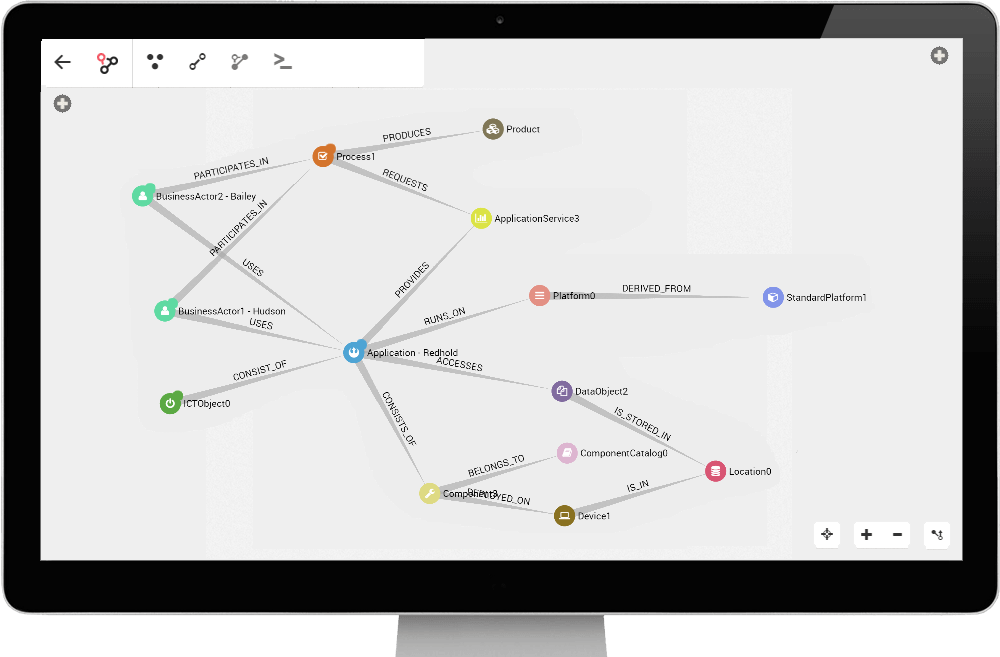
The technology architecture, for example,describes the hardware and network powering an organization’s applications. This is the domain of network engineers and network management.
It involves mapping servers, devices, systems, locations to build an accurate picture of the network infrastructure. Understanding the interdependencies within the network infrastructure is necessary to diagnose failures or identify anomalies. As the network grows, it becomes harder and harder to minimize interruptions and guarantee security.
These issues are compounded when you start considering the interdependencies across the whole enterprise architecture. If a new product is released, how will it impact the data, application and network layers? If a data center is experiencing outages, what are the impacts on the applications, data and business architecture?
Today, enterprise architects are struggling to tackle growing complexity. Symptoms include:
- Inability to understand interdependencies within enterprise architecture
- Inability to adapt enterprise architecture to changes
- Inability to implement analytical queries due to performance issues
This results in lower organizational agility with new projects failing and difficulties in driving innovation.
From relational database to graph database
A big part of the problem is the lack of a single unified view of the enterprise architecture data. Information is scattered in siloed tools (landscape map, CMDB, system inventories, UML tools, process chain, balanced scorecard, etc.).
The reason? They are often backed by relational databases. Using tables to structure information make them ill-suited “to deal with data that is rapidly changing not only in content, but in structure.”
Graph technologies like Linkurious and Neo4j provide a natural advantage to enterprise architects. The graph data model uses nodes and relationships to store data. This is a natural way to think about the interdependencies of enterprise architecture with very concrete benefits, including:
- A unified view of enterprise architecture means there are less blind spots due to siloed information
- A more flexible data model means that it’s easier to adapt to changes (e.g., update your enterprise architecture metamodel or adopt new frameworks)
- Creating advanced, rule-based analytics to deliver insights faster and more easily (e.g., running impact analysis)
Empowering enterprise architects with graph visualization and analysis
At Linkurious, we are already supporting a number of organizations who are building their enterprise architecture based on a graph approach. Linkurious Enterprise provides an off-the-shelf solution to search, edit and visualize graph data. Directly compatible with Neo4j, Linkurious Enterprise supports the security, scalability and extensibility constraints of large organizations.
What we have learned is that it’s not enough to build an accurate enterprise architecture. The real difference happens when enterprise architects and business leaders can:
- Investigate the data intuitively to answer questions
- Monitor the data to identify anomalies or problems quickly
- Curate the data in real time
- Share reporting that speaks to decision makers
- Collaborate and work securely
This leads to a more transparent enterprise architecture, faster and better decisions and greater agility.
Build a scalable enterprise architecture
For businesses with massive volumes of data and digital assets, graph technologies like Linkurious and Neo4j provide a foundation for a scalable enterprise architecture. Join us at GraphConnect Europe to discover how financial institutions are using graphs in data lineage and watch our webinar on enterprise architecture.
Linkurious is a Silver sponsor of GraphConnect Europe. Use discount code LINKURIOUS30 to get 30% off your tickets and trainings.
Share Article


Explore
Related Articles

Hybrid Search in Neo4j: Full-Text, Vectors, and Graph Topology with Cypher