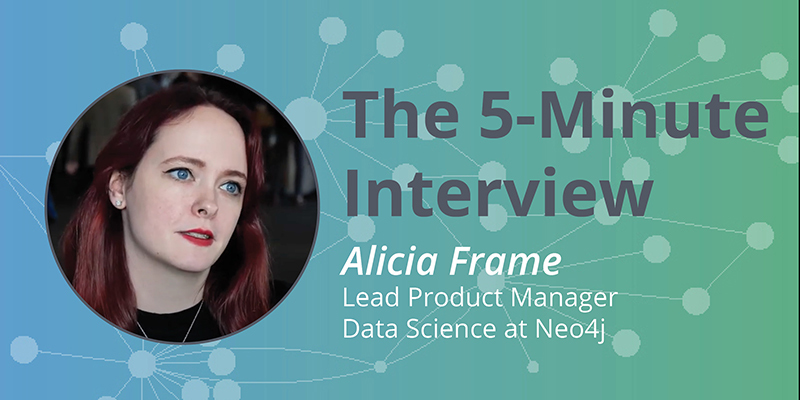
The Power of Graph Data Science: 5-Minute Interview with Alicia Frame

Product Marketing Manager, Neo4j
7 min read

“When do you use graph data science? When relationships matter. If there are no relationships among the things you’re trying to predict, you probably don’t need us, but odds are, there are,” said Alicia Frame, Senior Data Scientist, at Neo4j.
Data is inherently connected, but most data platforms do not enable you to leverage those connections. A graph database like Neo4j stores the relationships in your data, and the Neo4j Graph Data Science Library enables you to unlock the network structures in your data to gain deeper insight.
In this week’s five-minute interview (conducted at GraphTour NYC 2019), we speak with Alicia Frame, Senior Data Scientist at Neo4j, about the Neo4j Graph Data Science Library and its primary use cases.
What is the Neo4j Graph Data Science Library?
The Graph Data Science Library is a plugin that sits on top of your Neo4j database. It lets you flexibly reshape and subset your database to run analytics and machine learning AI workflows. It includes both the technology and procedures to reshape your graph into an optimized data structure to do analytics, as well as a package of 48 algorithms across three tiers (alpha, beta and product supported) to summarize key aspects of the topology of your graph.
For example, how important are different nodes, or what are the communities of nodes, or how many paths are available? You can take the information in your global graph and make it into something that’s machine interpretable, or even human interpretable.
What are the Graph Data Science Library’s primary use cases?
We’ve seen three big use cases in our first batch of early adopters.
Far and away, the most popular is fraud detection, where you’re looking for unusual patterns and transactions, or misuse of identifiers. What does typical behavior look like and are there any nodes that are outliers? This node might be much more highly connected, or that node has a really short path to a known fraudster. There are ways of summarizing behaviors and finding anomalies.
We also have some customers using the Graph Data Science Library for disambiguation. Basically, I have all of this data; which nodes are duplicates? Which groups of nodes all represent the same thing?
We have customers using algorithms like node similarity or weakly connected components to say, out of all of this data, I have hundreds of nodes, or I have billions of nodes, how many actual users have I seen touch my product? How many of these online profiles that I’ve built are actually the same? How many of my account holders, or account creators, are really the same user? Then they can leverage that information to track a customer’s journey across multiple platforms or many different datasets.
The third use case is around targeted marketing. If I have a message that I want to communicate about a product, who do I target?
In the past, we’ve talked about marketing with Neo4j using collaborative filtering, which tells me that customers who bought this item also bought that item. But if we bring data science to the table, we can say something like, who’s the most important customer that you know, based on your social connections? Maybe that person is much more influential, and we should recommend what they bought to you.
Or we might look for other customers who are a lot like you, based on their buying patterns, their transaction history, and their customer journeys, and make recommendations based on a similar topology instead of just blindly querying.
Why is graph data science so powerful?
I think the main power of graph data science, in general, is that it’s a way of taking relationships into account. If you’re a regular data scientist in Python land, everything is rows and columns. There’s no way of linking together data points naturally. Every row is something you’re trying to predict, and you have descriptors, like age, gender, or location.
The graph lets you link everything together, with relationships. Who knows who? Who is connected to who? Who’s important? How does information disperse across the graph? And then you can start to look at these multi-hop patterns in traversals across a graph.
So when do you use graph data science? It’s when relationships matter. If there’s no relationships among the things you’re trying to predict, you probably don’t need us, but odds are, there are, and that’s what the Graph Data Science Library is for.
What advice do you have for people who are getting started with graphs?
I think a really good place to start is framing your questions. Spend time thinking about the questions you want to answer. How do relationships matter? Is this a graphy question? Then figure out the right match for your question among the algorithms that we offer. If you have a question about how to subset your graph, you may be looking for community detection. If you want to know who is important, that’s a centrality algorithm.
Once you know what questions you’re trying to answer, that informs what data you go after and how you structure your graph. Then think about how to get started and how to measure success.
How can people get started with the Graph Data Science Library?
The Graph Data Science Library is available in Neo4j Desktop; you install it as one of your plugins.
It’s also available on our download center or on our GitHub repo for graph data science.
We also have a graph data science sandbox, so you can have a curated experience and introduction to get you started quickly, both with running algorithms, as well as using Bloom to visualize the results of the algorithm, to understand what all those numbers and patterns mean.
Want to share about your Neo4j project in a future 5-Minute Interview? Drop us a line at content@neo4j.com


