Graph for customer golden profile & fraud detection: 5-minute interview with Allianz Benelux

Product Marketing Manager, Neo4j
7 min read
“Here at Allianz Benelux, we strongly believe in graph, as it allows us to look at data from a connected-data perspective. Instead of looking at data as individual pieces of information, we want to understand how all those pieces are linked to each other,” said Jan Doumen, Head of Business Intelligence at Allianz Benelux.
In this week’s 5-minute interview, we are speaking with Jan Doumen, Head of Business Intelligence, Aarthi Kumar, Lead Data Scientist, and Niels Holtrop, Data Scientist, all with Graphie Award Winner Allianz Benelux about how they are using Neo4j to create customer profiles and in fraud detection in the insurance industry.
Tell us a little about yourself.
Jan: Good morning, good afternoon, good evening, or good night. Whatever the time is where you’re watching this.
We are Allianz Benelux, specifically the Data Office, which is a business unit within our organization. Allianz is the largest insurer in the world, and as Benelux, we are a truly cross-border operation entity covering these three countries – Belgium, the Netherlands, and Luxembourg.
Our business is focused on retail, SME (small or medium-sized enterprises) and mid-corporate, both in the P&C (property and casualty) and life lines of business. We sell insurance primarily in broker-mediated markets. We will present to you what we do with graph.
I’m Jan Doumen, Head of Expertise and team lead for Customer Insights and Intelligence and Management Information and Insights.
Aarthi: Hi everyone. I’m Aarthi Kumar, Lead Data Scientist and epic lead for Customer and Broker Insights and Intelligence
Niels: Pleased to meet. My name is Neils Holtrop and I am the Data Scientist and epic lead for the Fraud Intelligence team, and together with our Fraud Business unit, we aim to incorporate advanced analytics and machine-learning algorithms into the fight against fraud.
How are you using Neo4j?
Jan: Here at Allianz Benelux, we strongly believe in graph, as it allows us to look at data from a connected-data perspective. Instead of looking at data as individual pieces of information, we want to understand how all those pieces are linked to each other. There are two areas that already greatly benefit from this ultimate view.
One is customer intelligence, where we created a truly 360 degree view of our customers. We’ve started to understand what our customers really need. The other one is fraud intelligence. As you might imagine, fraud represents a considerable slice of our costs, and that negatively impacts the largest portion of our customers who play according to the book.
How were you solving that problem before Neo4j?
Niels: In insurance, the problem of fraud is a big one. Estimates indicate that around 5 to 10 percent of claim costs that are paid out are paid out for fraudulent reasons. This entails both professional fraudsters, as well as regular consumers who are exaggerating their claims. The usage of graph technology within insurance mainly focuses on the more professional frauds which involve staged or exaggerated claims. These kinds of claims are mainly found through the social links that arise within the claim with people that know each other in one way or another.
The process to detect these kinds of relationships in the past used to consist of many manual steps, causing the process to be highly time-consuming. To prove a case, the entire network has to be drawn out to see who is related to whom and exactly in which way. With the graph, the network can be generated using the click of a button. And hence, a lot of time can be saved by generating the initial overview of the parties.
Aarthi: Customer data is the gold mine for any organization. Without graph, we would have used customer Golden Record (a single, congruent view of a customer) against the customer Golden Profile (a central customer master profile).
Traditional relational databases provided a fact record that was difficult for human conception to understand a customer. It was increasingly becoming difficult for our sales and marketing teams to use this as we added more dimensions to the data. One of the key use cases is cross and upsell opportunity. Based on a McKinsey study, cross and, upsell opportunity for insurance companies can result in at least a 10 to 20 percent boost in sales. We would definitely not want to miss that.
What made you choose Neo4j?
Jan: We had been looking at a few providers of graph databases. In the end, most of them deliver graph on top of a traditional database. There are only a few who make a native graph, and Neo4j is one of them. So we have played around a bit with different ones. I’ve talked to the people behind the companies to understand how much they’re really willing to support us in a far-reaching implementation.
And then we chose the one that we thought suited us best. To be fair, we have multiple data scientists with PhDs in graph. So we knew the markets and what each of the different tools was worth.
What are you able to do now that you weren’t able to do previously?
Niels: With the graph database, we are now able to see relationships in claims the way that normal human beings would see them, instead of in the database view. If a link exists, we can get an instant visual confirmation of the relation between the different parties. Compare this to the traditional way of trying to remember or recognize that the same name is present in two different claims. We realized that the amount of time is vastly reduced to find the new social networks within a claim.
Aarthi: Being able to view the customers as a graph with all the data points helps the business teams in faster understanding and thereby faster decision making. A household view of the customers resulted in better understanding of the customer, the ideal ones, and their needs. We do not want to sell what we have to our customers but sell the right insurance protections for their needs.
What is next for your project?
Niels: The best part about using Neo4j is that once the initial database is set up, there are many ways to interact with the graph, either using the recommended GRANDstack but also using open source libraries and software like R and Python. This actually allows for a large flexibility to do experimentations and to quickly see if something works or not..
Niels: The best part about using Neo4j is that once the initial database is set up, there are many ways to interact with the graph, either using the recommended GRANDstack but also using open source libraries and software like R and Python. This actually allows for a large flexibility to do experimentations and to quickly see if something works or not.
What is the best part about working with Neo4j?
Niels: For us, the next step will be to investigate what the graph data science library can bring us. Network analytics will be a top priority but this will come with its own challenges in terms of information leakage, given the chronological order of the data present in a claim. Here, we will assess together with Neo4j what our options are and where they can support us in developing new features for the graph.
What do you think the future holds for graph technology?
Jan: Frankly, we think that graph has a bright future. Relational databases have been around simply because the compute was not there to look at data from a connected perspective. Oversimplifying, this can be compared to our brain. We only use an estimated 10 percent of our brain. So imagine we could use the full hundred percent. One of our friends recently even obtained a PhD on graph data warehouses. So there’s a legion of possibilities to explore and exploit. And we believe that using graph is a key differentiator of the market.
Want to share about your Neo4j project in a future 5-Minute Interview? Drop us a line at [email protected]
Share Article


Explore
Related Articles
Fraud rings hide in the connections: Graph-Enriched Detection for Databricks Genie with Neo4j
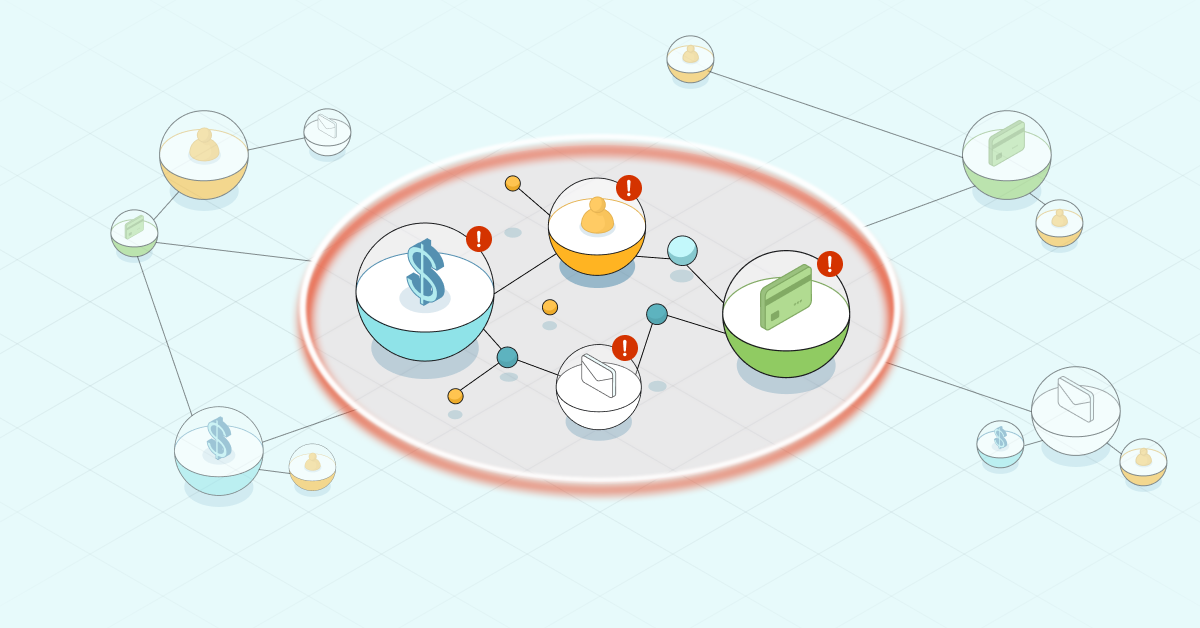
Detect fraud faster with a transaction graph

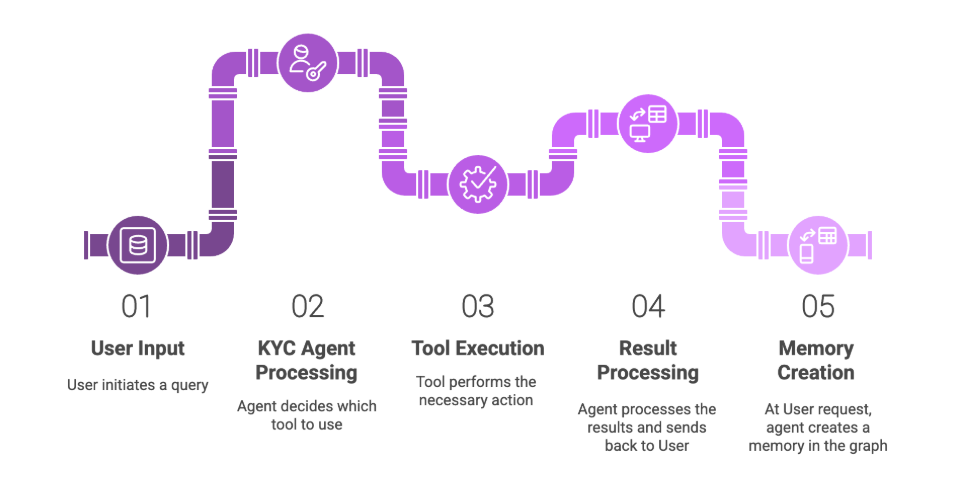
GraphRAG in action: A simple agent for know-your-customer investigations

Mastering fraud detection with temporal graph modeling
