
Graph Technology for Enterprise Master Data Management (MDM)

Principal Product Manager, Pitney Bowes
8 min read
Editor’s Note: This presentation was given by Aaron Wallace at GraphConnect San Francisco in October 2016.
Presentation Summary
Modern enterprises need to have a full, 360-view of their customers drive their bottom line. This requires the integration of data from a variety of different sources through enterprise master data management (MDM).
In this GraphConnect presentation, Aaron Wallace shows you the importance of a Single Customer View approach to metadata and master data within the enterprise. Specifically, Wallace demonstrates the power of the Spectrum platform engineered by Pitney Bowes Software.
Underpinning Spectrum is Pitney Bowes’ approach to and vision for the evolution of customer information management. That evolution began with processing, matching and de-duplicating postal addresses.
Over the next 30 years, that has changed to include data quality, analytics, ETL processes and natural language processing. The next step, Wallace believes, is tapping into the power of knowledge graphs for a 360-degree view of the customer no matter where or how they are interacting with your enterprise organization.
Wallace sees mastering customer information as a new business discipline, and Pitney Bowes chose Neo4j because of its schema-optional data model, its ability to scale with connected data and its ability to protect data quality.
This flexibility and novel approach to data has created a number of unique, cross-vertical use cases for the Spectrum platform, including sales optimization, fraud detection, anti-money laundering (AML), and customer support.
Full Presentation: Graph Technology for Enterprise Master Data Management
What we’re going to be talking about today is a solution Pitney Bowes has developed for managing enterprise information and metadata:
Single Customer View and Metadata Management
We work directly with Neo4j, which we embed inside of our Spectrum platform. I’m going to give an overview of this platform as well as some of the reasons why we chose graph technology for metadata management.
Many of you have heard of Pitney Bowes in the context of mailing. Our company is 100 years old, and two-thirds of our business includes hardware that is mailing related — things like sorting machines, scales and meters.
I work in the Pitney Bowes Software Solutions side, which is considered the growth engine of the company. I work as a member of a team that is driving towards managing single customer views for personalized sales, reducing operational costs and optimizing regulatory compliance.
The main go-to-market focus we have is around the single view of customers, which is the Master Data Management (MDM) use case at its heart.
A single view provides the ability to access all relevant and trustworthy information about a customer across an organization, facilitating effective business decisions.
It’s not just about the power of graph technology; it’s also about the surrounding capabilities you need to make sure that information is trustworthy.
The Evolution of Customer Information Management
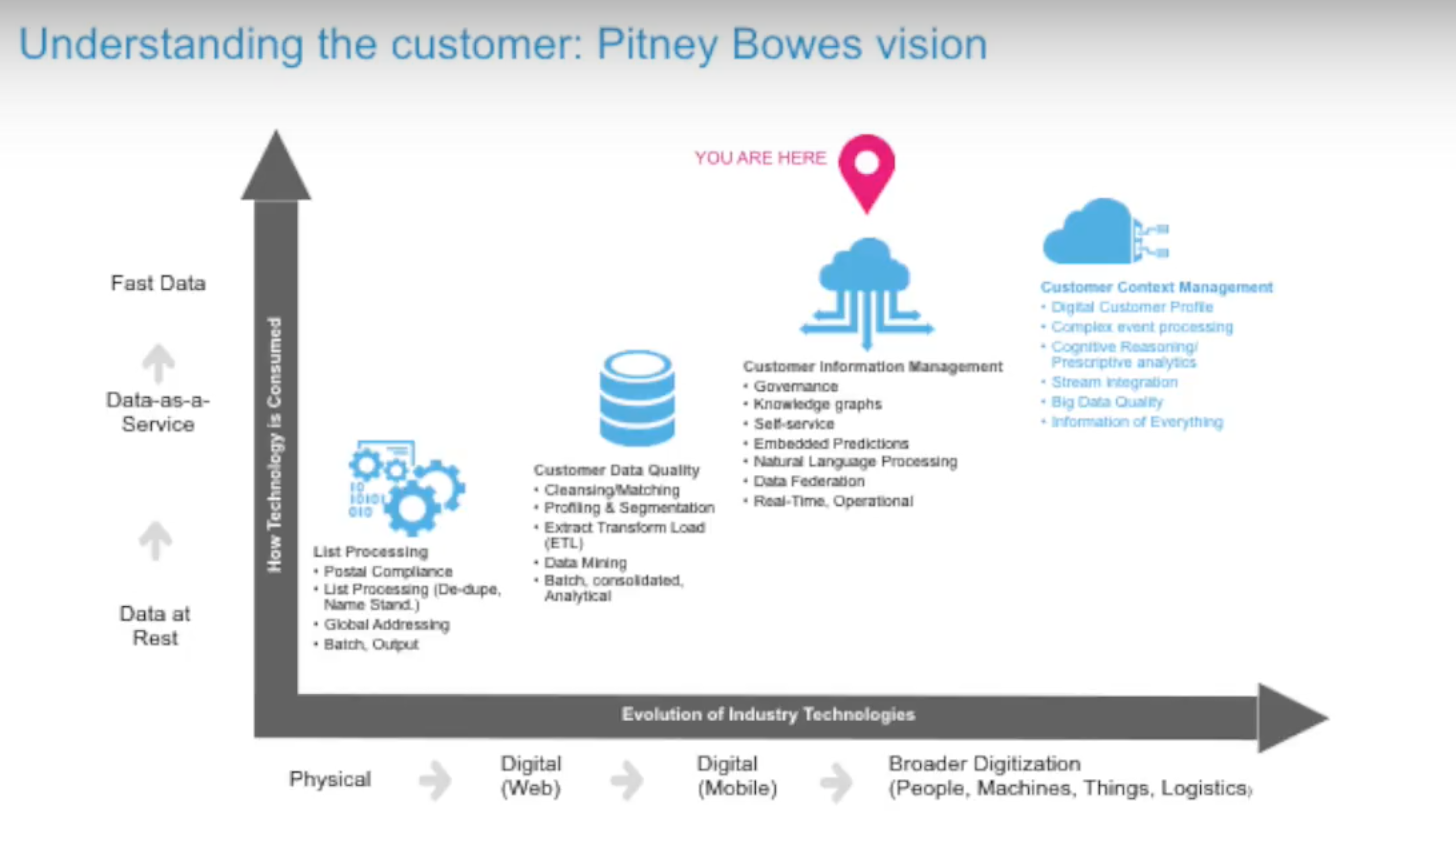
The way we view managing customer information has evolved over time:
There’s been a pretty dramatic evolution over the last 30 years or so.
When we first got into this business, it was all about large batch jobs on the mainframe, processing addresses, matching and de-duplicating. More recently, it’s been about an enterprise-level capability for customer data quality.
So not just executing things in batch, but the ability to take the same kinds of capabilities and operationalize them through web services. You have to be able to integrate with the various systems to pull data together under a single view.
The red indicator in the chart above marks where we are today with customer information management. This is where we dove into the knowledge graph concept and began partnering with Neo4j.
A good number of other capabilities that are relevant includes unstructured data and natural language processing, and treating that as a data source for your enterprise. We see this evolving around context management, so as a customer reaches out through an organization — whether it’s an airline, retail organization, bank or insurance company — you’re able to really understand the person you’re speaking with and understand the context of that interaction. We see mastering customer information as a new business discipline.
When you’re mastering data across multiple domains, it needs to be driven from the top down. And there are a lot of advantages to how we roll out these solutions, and where we see graph database technology really shine.
Below is how we’ve seen the single customer view evolve over time:
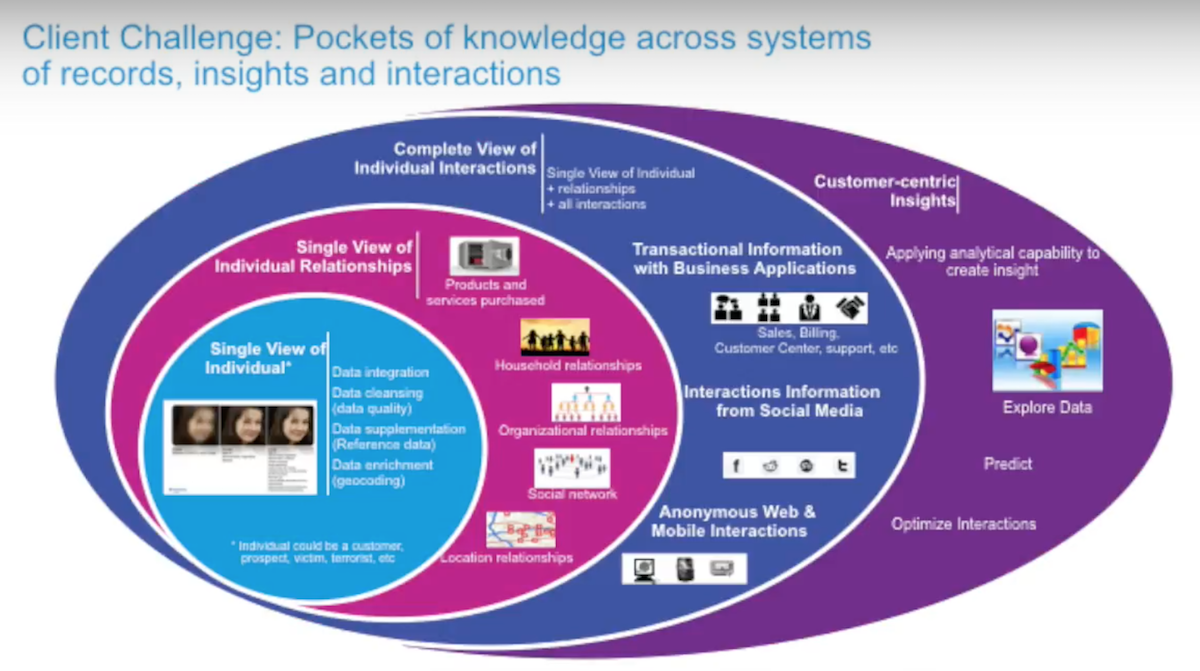
The basic capabilities that have been around for a long time are about the core profile of the individual. In the end, it’s really just an aggregation of data that sits in isolation because it doesn’t allow you to see relevant relationships.
The next step out is to understand those relationships, whether it’s what products they own, relationships to other people in their social network or as part of an organizational hierarchy. This leap from circle one to circle two is when we started our partnership with Neo4j.
The next level out adds interactions. Whether it’s calling into my support desk, a web interaction or a social media interaction, we also want to fold those into the single view. Ultimately, all of this needs to drive towards customer-centric insights that allow us to drive effective strategy for our business — and ultimately affect our bottom line.
Why Neo4j?
There were several key design principles that led us to partner with Neo4j. Data structures are the key to unlocking value in data that exists across your enterprise.
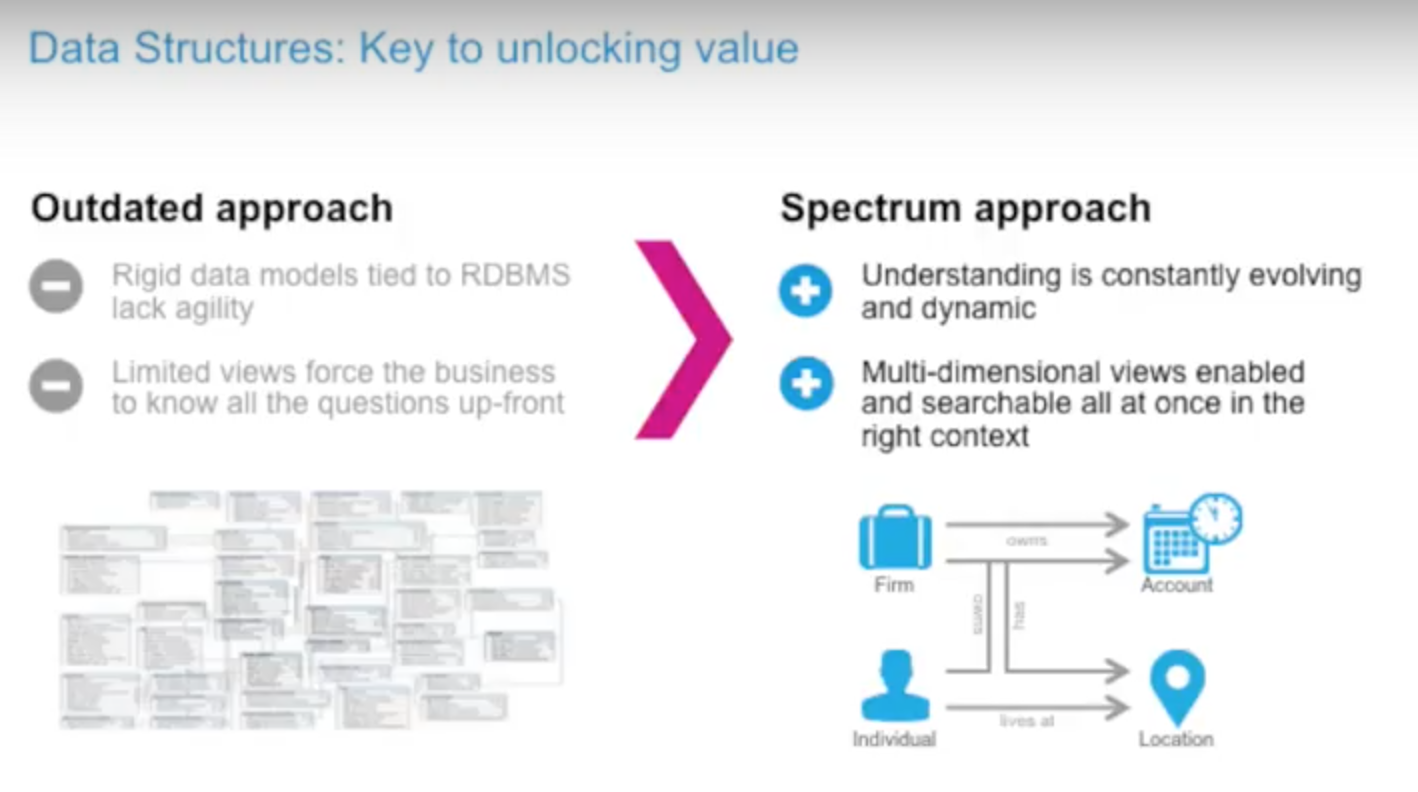
Enterprises of all sizes need to integrate hundreds of data sources for a single customer view — and your technology needs to support agile development to do so.
Otherwise, you end up with competing technologies designed around a relational database (RDBMS) model that prevents operating agility. Graphs are schema-free and therefore incredibly agile, can provide data connections that tell the whole story and scale really well.
While I’m not suggesting abandoning the relational model entirely, it really does struggle with problems at scale. For example, it’s incredibly complex from both a coding and SQL perspective to write queries to find “friends of friends” in a social network.
The RDBMS data model also forces you into a limited view of your data that requires you to know your questions at the very beginning. Graph technology is much better suited to an evolving, dynamic paradigm and allows us to drive multi-dimensional views that are key to the single customer view use case.
Six years ago we were mostly a data quality vendor, but we wanted to enter the MDM market — which was very crowded and included a lot of major enterprise software vendors. We needed to do something different than what was already out there, and were the first-to-market with a graph-based MDM solution.
We chose Neo4j because it was originally Java-based, which fits our core platform architecture well. It runs on multiple operating systems; it is highly performant; it provides for ACID transactional control, which is key when you’re talking about an operational, transactional MDM system; Neo4j is the market leader; and it offers the ability to operationalize and pull some of these query interfaces into real-time systems. As you’re on the phone with the customer you can see the relationships and some of this connected data in real time.
And while Neo4j is great as part of our MDM solution, they’re only one piece of the puzzle. You can’t just store something in a graph database and suddenly have a master data management solution. You need to surround it with capabilities for data quality, ETL and analytics — all of which are things that we deliver the platform we call Spectrum.
Below are some of Spectrum’s capabilities:
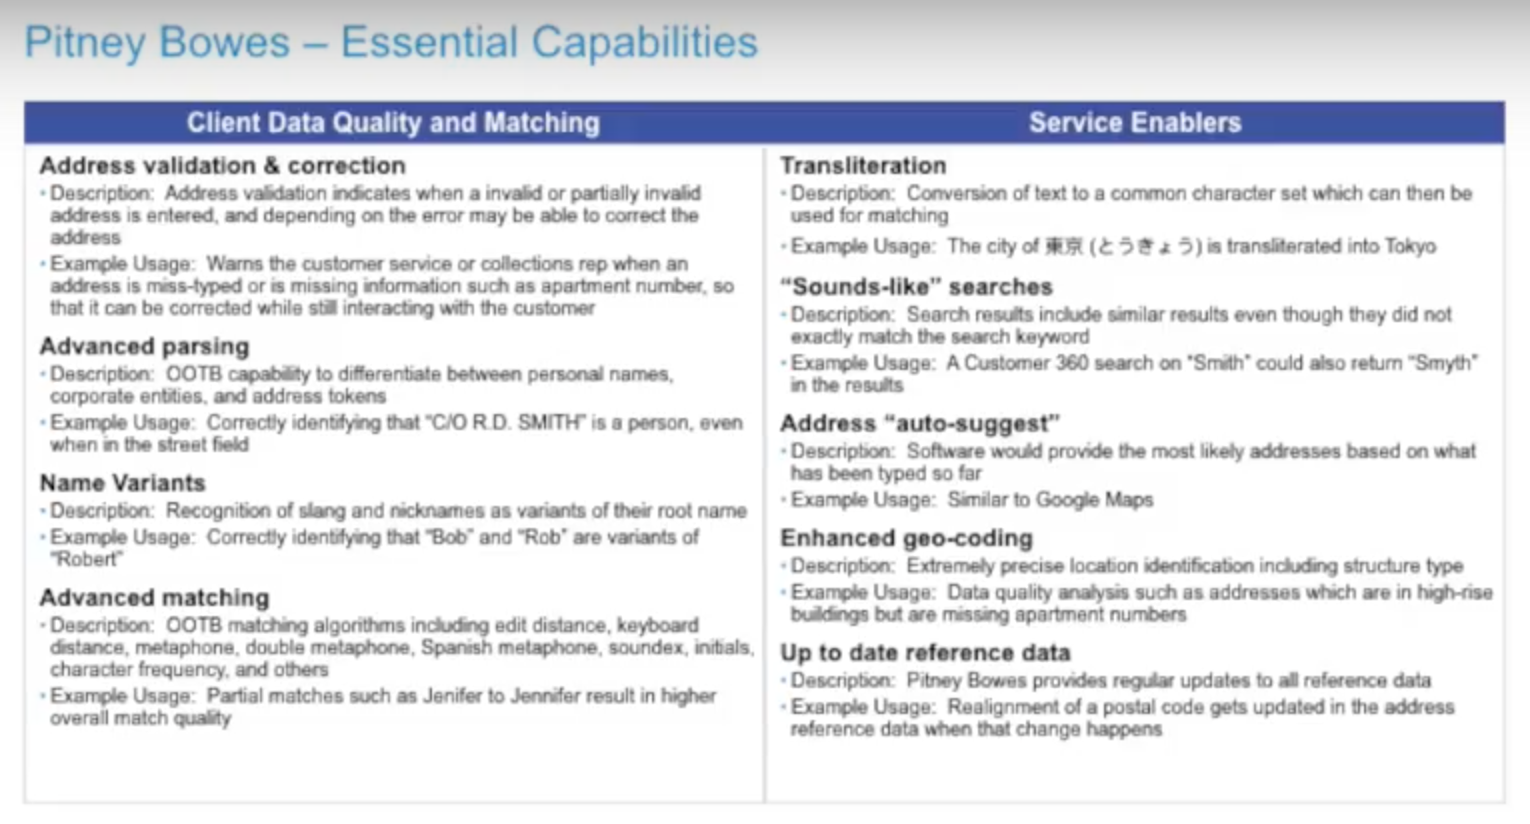
Most of the capabilities are data quality related, whether it’s matching, validating addresses or parsing conjoined data in a single field. All of these are capabilities we can set up in front of populating a Neo4j database as a master data repository.
We’ve also recently added the ability to virtually query from the graph, so you can design virtual nodes that reach out to other systems. This supports more of what’s called a registry pattern with MDM. Again, this suits the agile process because you don’t have to pull every data source in at once. You can centralize certain bits of data and store some virtually to progress along that path in a much more iterative manner.
Folding in the data analytics is key towards driving that insight and strategy. There are several different ways you can do that, including through classical aggregations like “Who are my highest spenders?” and “What sort of propensity do they have to buy, from a predictive perspective?”
We also have a core set of geospatial capabilities for folding that into the analytical process. The questions that are best answered with graph technology are “How do I understand influence within a network?” and “Who are my most influential customers?” Combine that with information about what they spend, and you end up with a decent list for targeted marketing.
Recommendation systems are also really well suited for Neo4j and graph database technology in general.
Use Cases of the Spectrum Platform
We’re currently working on a number of use cases for Spectrum:
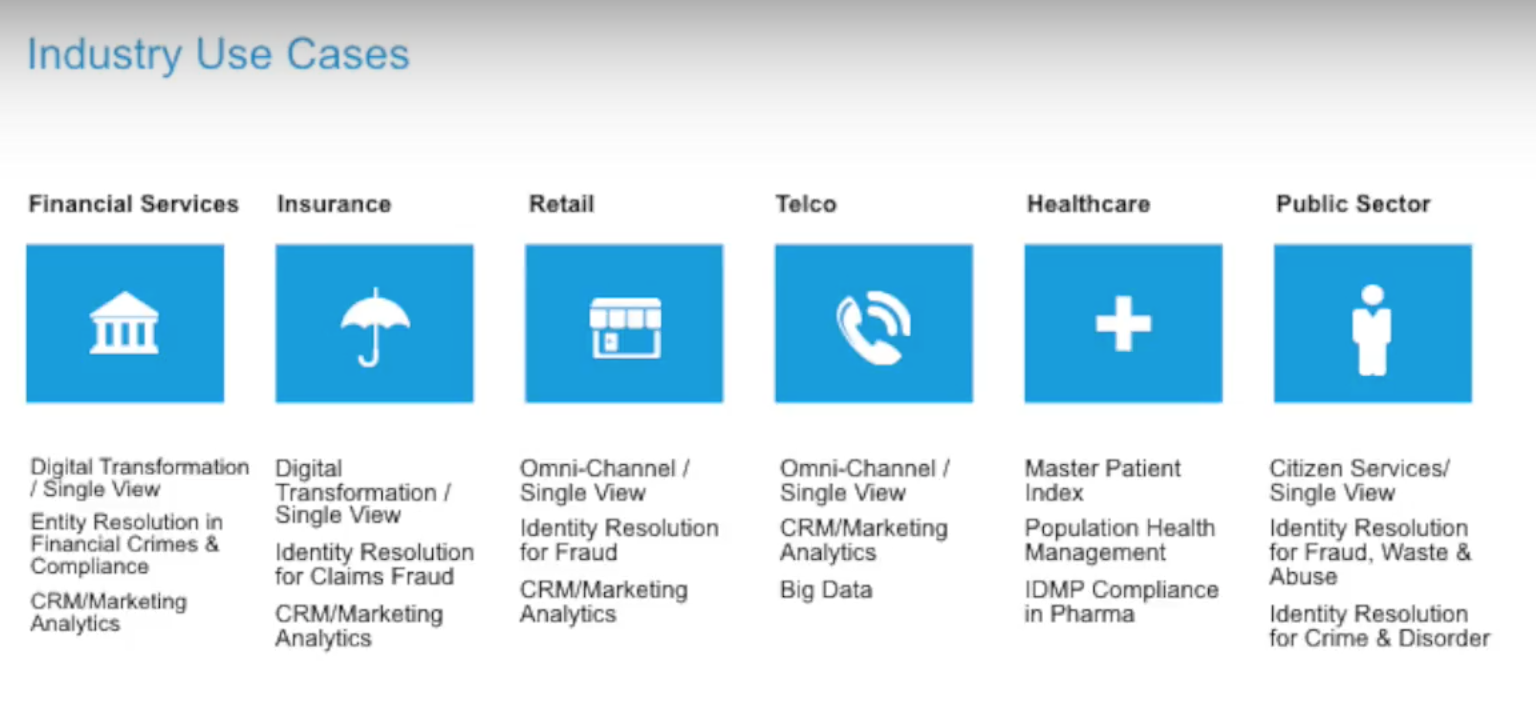
Most of these use cases are oriented around the customer single view to drive strategic transformations, whether that is to improve the effectiveness of sales, marketing or customer support. These are all key use cases we solve within each of these verticals.
One of our clients is a financial services company here in the US, which is using Spectrum to drive single-view to roll out a fully digitized process on the web. This is the first time the industry is using a graph-based technology, and is now adopting it as an enterprise standard for other projects they’re hoping to master across multiple domains.
Graph database are also really powerful with fraud detection. Most of our financial services customers need to comply with ever-changing regulations around anti-money laundering (AML). So we’ve got one customer that’s integrated this capability to find those not-so-obvious relationships and also detect what they call pseudo-customers that have been set up to propagate money laundering scenarios.
We also have a retail EMEA customer, an automotive manufacturer, that licenses a solution to drive cross-sell opportunities. Members of the sales team struggle to effectively identify their customers when they come into a physical location. To address this, they integrated the data hub — a capability that’s based on Neo4j — and are now able to reveal and integrate some of that information out of the point of sale.
What’s Next for Spectrum and MDM
Forrester has called this out as a leader in the master data management sector:

If you read the quote under “MDM: Leader,” you can see that this directly relates to graph technology: modeling, flexibility, ease of implementation and faster time to value. Again, surrounding Neo4j with other capabilities is how to effectively solve an MDM use case.
Our futures work includes using graph database technology not just as a physical datastore, but as a store for tracking enterprise metadata. And once you enter the graph technology domain, you start to see graphs everywhere.
For example, if you look at the layout of enterprise information in any organization, you have hundreds of data sources, workflows, data quality rules, governance rules, users, reports, dashboards and monitoring systems. If you want to analyze the impact of changing a column name or trace data lineage from a report field back to its original source, that’s a graph. It’s traversals, the ability to tag it with semantic information that is also really great for modeling entities.
Share Article


Explore
Related Articles


How to Improve Multi-Hop Reasoning With Knowledge Graphs and LLMs


Integrating Neo4j With Symfony: Profiling Queries and Centralized Logging

