GraphConnect 2022: Product announcements!

Chief Technology Officer, Neo4j
7 min read

We’re so pleased to follow up on the announcements we made today at GraphConnect. Our teams worked tirelessly to make the vision of the graph data platform a reality and today we shared updates that continue to make good on that vision. In this blog, we’re recapping the highlights Emil Eifrem and I announced during our keynote session today.
Enjoy the new features and stay turned for many more!
What’s New in User Tools
Neo4j workspace
What is it?: A unified tools experience that brings together Neo4j’s most powerful graph tools – Data Importer, Bloom, and Browser – all in one place, to help you get up and running with graph databases quickly, efficiently, and easily.
If you already have an existing database, simply connect the database in Workspace and begin exploring and querying your data without the need to log into Neo4j Bloom and Neo4j Browser.
Do you have new data you wish to bring into Neo4j? Data Importer, which was announced earlier this year, is integrated with Workspace so now you can pull in multiple datasets, sketch your data model, map your categories, import the data and voila – you can now Explore and Query the data in your Neo4j graph database.
Check out this demo to get a glimpse into Neo4j Workspace. And if this piques your interest, please sign up on this page so you can be the first in line to test drive Workspace when beta is available.
What’s new in Graph Data Science
What is Graph Data Science?
Graph Data Science enables fast, actionable insights about what’s important, what’s unusual, and what’s next through an easy-to-use engine that works with the data you already have, the data stack you already have, and the data pipeline you already have to quickly move more data science projects from proof of concept to production.
New features that support enterprise volumes of data, use cases, and complexity include:
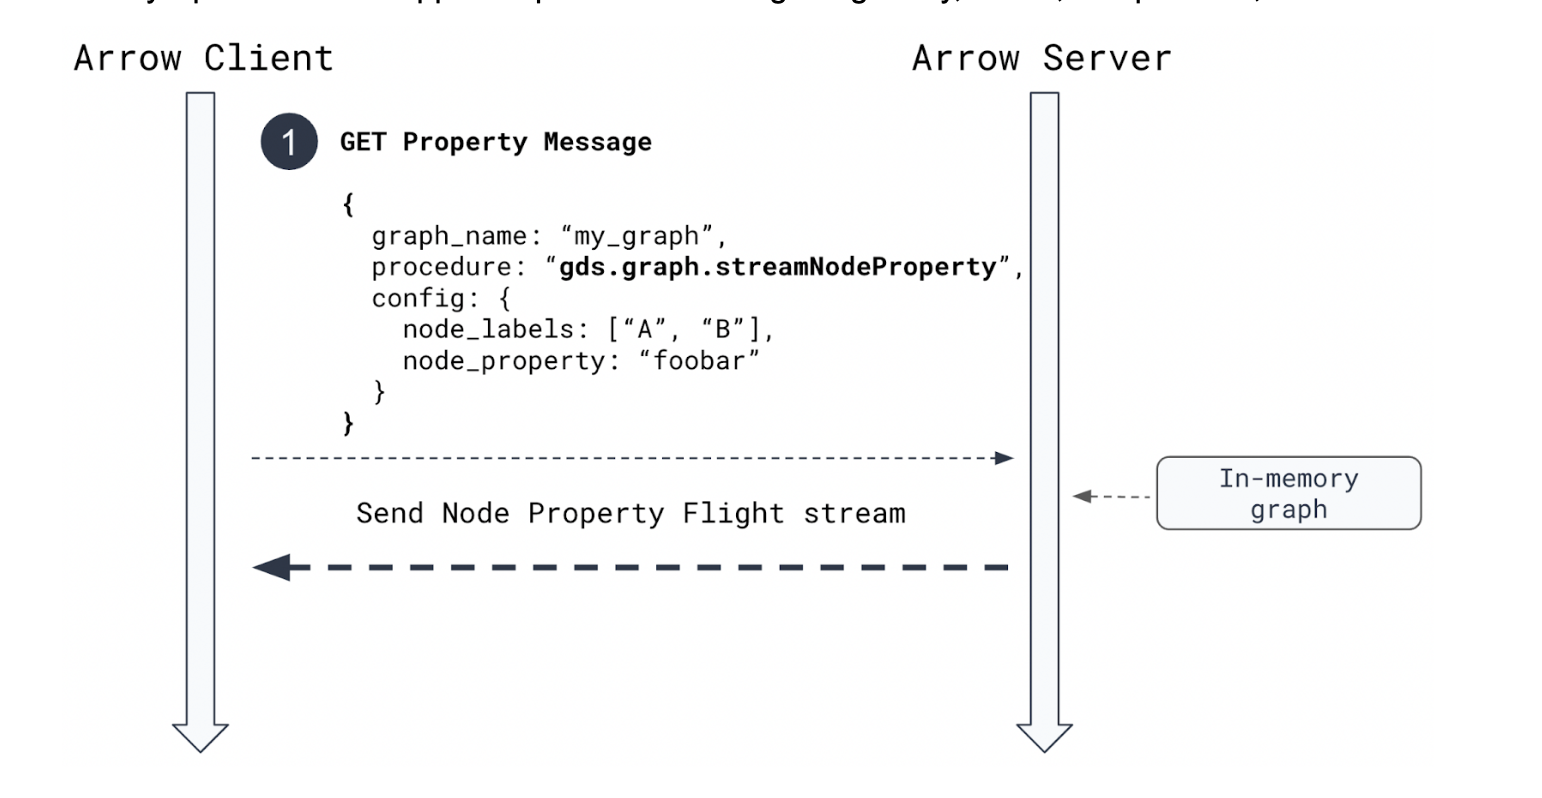
- Apache Arrow Integration for Graph Projections: Import and export massive graphs – up to 8 million objects/second! Insert Graph Data Science seamlessly into your existing ML pipelines and run analytics that need to be exported to a downstream system.
The integration provides convenience functions in the Graph Data Science Python Client to load from and export to data frames, and access to a low level Arrow API to integrate with any Apache Arrow supported product like Google BigQuery, Beam, Parquet files, and more.
New features that empower data scientists are:
- New alpha tier algorithm – Leiden: A new community detection algorithm, a hierarchical clustering algorithm that guarantees well connected communities. Similar to Louvain, users have requested this methodology to create more cohesive communities.
- New alpha tier algorithm – K-means clustering: Community detection algorithm intended to cluster nodes based on properties (like embeddings). Users can specify the numbers of clusters desired and Graph Data Science finds the optimal groupings.
- New alpha tier ML pipeline – Node Regression: Users can predict numerical property values for nodes using node regression pipelines. Node regression lets users fill in missing property values based on other node properties and graph topology.

To try the new features in Neo4j Graph Data Science, visit our Sandbox.
What’s new in Neo4j graph database
Neo4j operations manager
Up until recently, the operations teams that manage Neo4j databases didn’t have a visual UI for monitoring or administration. They have to rely on third party tools that require integration and a separate subscription or support contracts to monitor the status of the databases and health metrics of each instance. To perform administrative tasks, operations team members have to use the command line interface.
Operations teams are also facing the challenge of having to manage an ever increasing number and kinds of databases, each with increasing amounts of data deployed across clusters and hosts. They need tools to deal with these complex challenges. Specifically, you have been telling us you need a graphical UI based tool for managing your Neo4j estate.
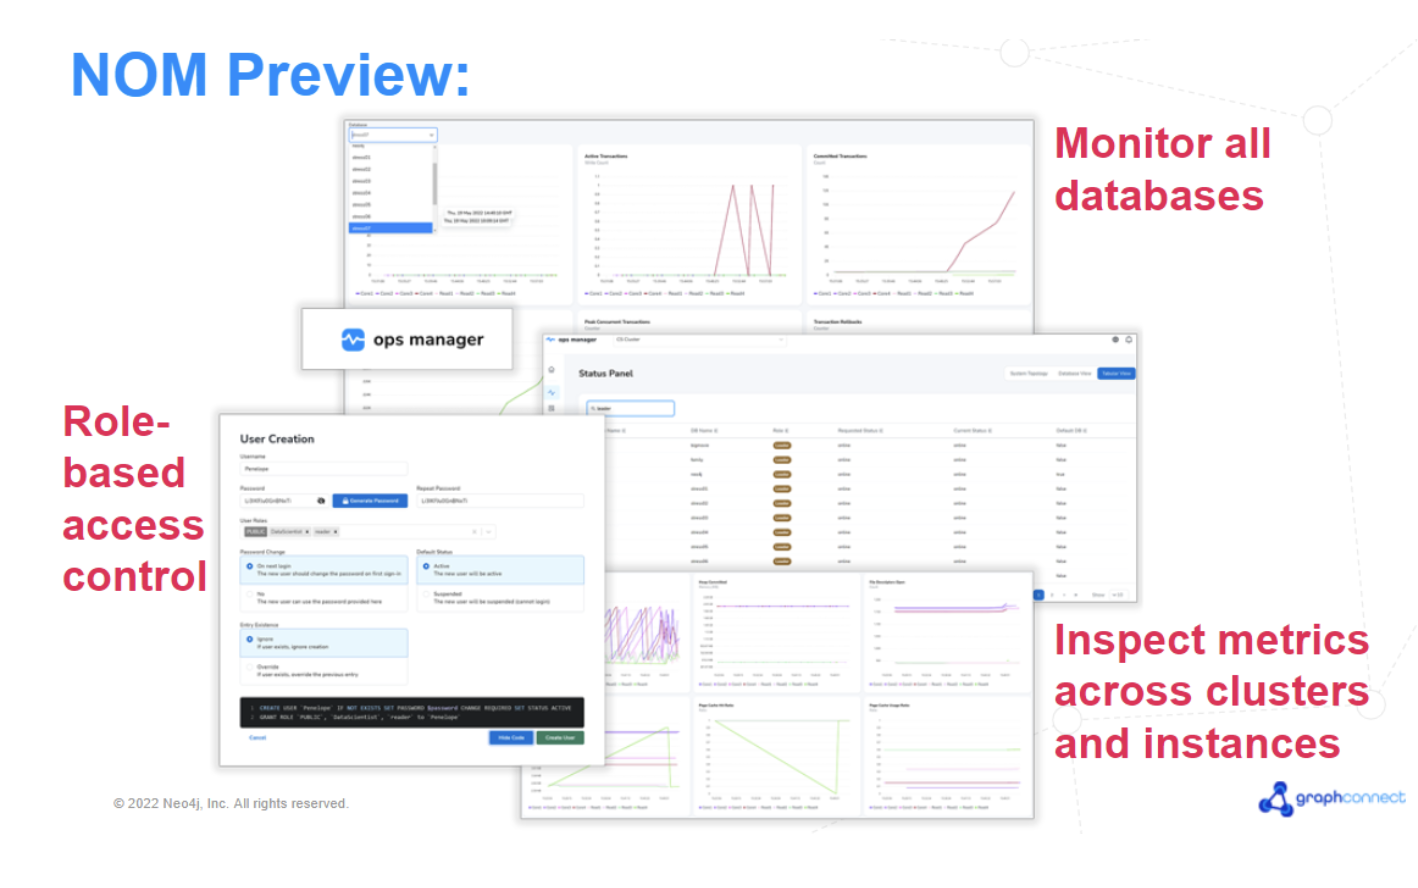
We listened and this is exactly what we are delivering. Introducing Neo4j Operations Manager, a new product that makes it effortless for you to monitor and administer all your Neo4j databases, instances, and clusters, from a central UI-based application.
Using Neo4j Operations Manager:
- Operations team members can instantly and graphically view the status of all databases under management. This will reveal whether all is well or if any cluster or instance may need attention at any given point in time.
- They can inspect the health of each instance, reviewing database-specific metrics, like cache hit ratio, to troubleshoot any concerns before they become a major issue.
- On the administrative side, we begin by delivering a way for operations team members to set up role-based access for each user.
As we adopt an agile delivery model, expect frequent future deliveries of other Neo4j Operations Manager capabilities, like automating important operational task or evaluating the performance of your Neo4j databases.
Using Neo4j Operations Manager to manage your Neo4j databases will help your operations team drastically increase their productivity and improve the reliability of their Neo4j deployments.
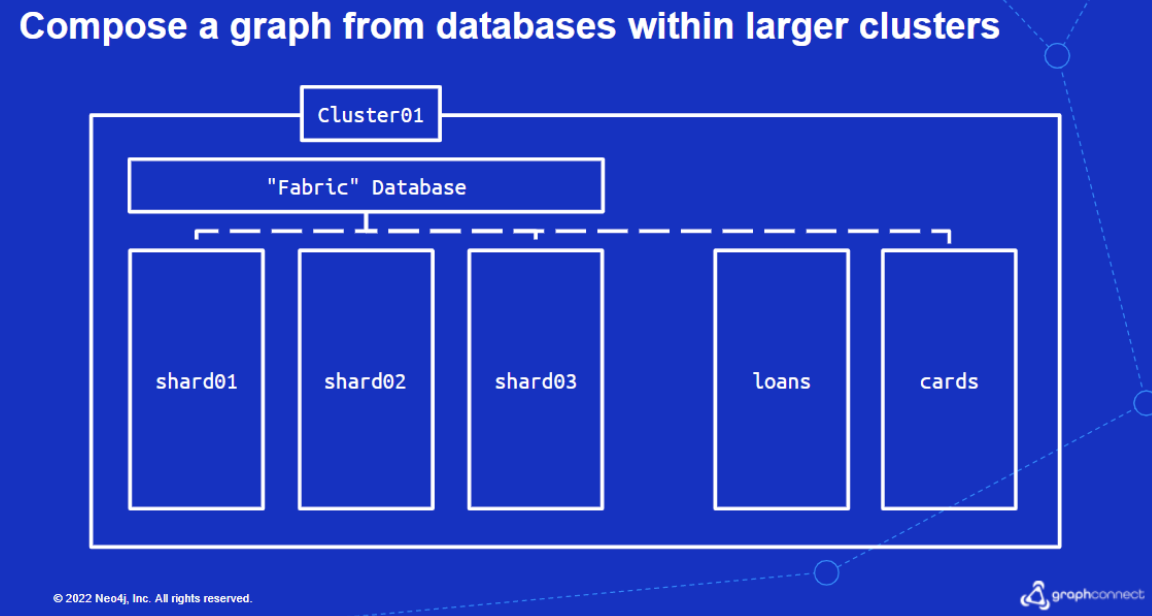
New Neo4j cluster and Fabric
As organizational data continues to grow beyond multi-terabytes – it becomes increasingly important to focus on the operational issues associated with managing and scaling very large graphs. Challenges include backup and restore times for the very large data sets, adding a new shard each month to an existing graph, or avoiding scaling an entire cluster at once.
Starting with Neo4j 5.0 – which will be made generally available (GA) around October 2022 – new clustering changes will offer horizontal scale without requiring existing servers in the cluster to be scaled vertically. This means that the number of databases, or the size of those databases, increases so your infrastructure scales effectively with your data.
Databases become operationally easier to manage (e.g. backup and restore) through sharding, and federated graphs can be composed in real time and queried with millisecond response times. With new changes in Neo4j Fabric in 5.0, graphs can now be composed across a cluster, multiple clusters, or AuraDB to achieve true cloud scale for your data. While any database infrastructure changes that occur are invisible to applications, for customers who need to scale Fabric beyond a single cluster, Neo4j Operations Manager provides an operational view of the entire Neo4j platform.

Clustering enhancements in 5.0 (available in Neo4j 4.4 Tech Preview)
Fabric Enhancements for Neo4j 5.0 – Coming Soon!
What’s new in connectors & extensions
We’re adding to our portfolio of connectors with the Neo4j Data Warehouse Connector. This new connector provides a simple way to move data between Neo4j and popular Data Warehouses like Snowflake, BigQuery, Amazon Redshift, and Microsoft Azure Synapse Analytics.
Neo4j data warehouse connector
You can use it in two ways:
- As Spark Submit Job by providing a JSON configuration that abstracts a Spark Job which moves data from one data source to another.
- As Scala/Python API in order to simplify writing a Spark Job that moves the data from one database to another.
This allows data scientists to move their data between sources so they can integrate graph and graph data science into their pipelines.
To learn more about the Data Warehouse Connector, check it out on Github.
Well, that’s a wrap… for now! We’re so thrilled to offer our customers and community these new enhancements. We are on a mission to make graph technology more accessible, powerful, and applicable than ever before, and these developments take us one step further along our journey. As we unveil these and other new offerings over the next few weeks and months, we look forward to hearing how your own work in the graph space has evolved.
We’re so grateful to be on this ride with you all – the future is looking bright!
Share Article


Explore
Related Articles
New research finds enterprises earn 230% ROI with Neo4j Graph Intelligence Platform
A knowledge layer for your agentic systems on Google Cloud