Graphs for Real-Time Transaction Processing: 5-Minute Interview with Jorge Zaccaro

Product Marketing Manager, Neo4j
6 min read
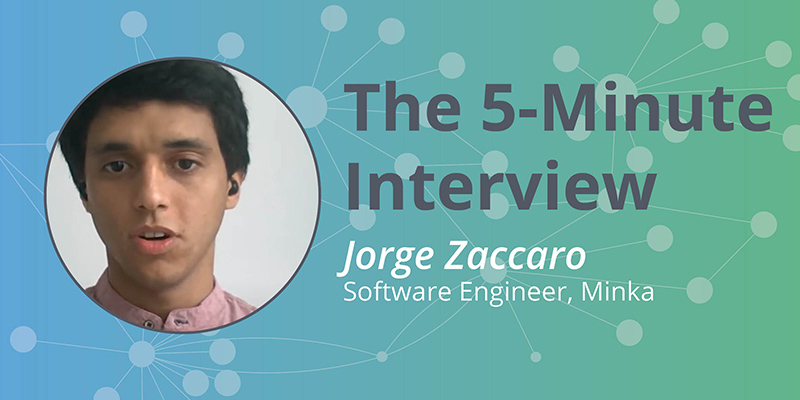
“Once we noticed that we were modeling transactions as a graph, we went out to look for a native graph database and we found that Neo4j was a great fit for this use case,” said Jorge Zaccaro, Software Engineer at Minka.
In this week’s 5-minute interview, we spoke to Jorge Zaccaro, Software Engineer at Graphie Award winner Minka about how they use Neo4j for real-time transaction processing.
Tell us a little about yourself.
I’m a software engineer, and I focus on digital currencies and monetary economics.
How are you using graphs?
A few years ago when we started designing the transaction-processing core, we borrowed some design elements from Bitcoin, especially something they call the unspent transaction outputs model. Basically, this is a model in which spending occurs by pointing to previous transactions – in Neo4j’s terminology, creating edges, or connections between nodes. Once we noticed that we were modeling transactions as a graph, we went out to look for a native graph database and we found that Neo4j was a great fit for this use case.
How does Neo4j help you solve that problem?
We describe our use case as graphs for real-time transaction processing. The problem we are solving initially is changing the way clearinghouses work. The way they settle interbank transactions today is by keeping a batch of all requests from one bank to another in a given time window, and then doing one processing batch every four hours or so.
But that has a few drawbacks. One of them is you have a four-hour wait in some cases for the money to arrive at your friend’s destination bank because you don’t have accounts at the same institution.
The second problem is that if it’s not a business day, then you have to wait up to three days for the money. But we are just talking about information, right?
And there’s really no limitation on processing this type of information in real time, so what we are doing is trying to communicate this to different customers, and selling the use case of modifying information in real time.
In this case it’s financial information, and at the beginning it takes a little bit of explaining and convincing, so that they go from thinking in batches to thinking in real time. But once they see it and they check the stack, they ask questions like “What do you mean, graphs?”, “What do you mean, connections?” and “How do you build a transaction chain?”
Once they understand that, they of course start asking, “Can you do it faster?” And that’s where we’re pushing the boundaries and even doing things that I don’t think we could do with any other database out there.
How were you solving that problem before Neo4j?
Well, we were not solving it before. The first implementation of the system used Neo4j right away but people were using other relational databases before and they of course didn’t have the advantages of what Neo4j calls index-free adjacency. We’re really happy to be using something that supports walking graphs without having to join tables because in our use case, it would be really slow to find the nodes describing the transactions.
What made you choose Neo4j?
We started a long time ago, when AuraDB was not in the market yet, and so we actually chose the community edition of Neo4j, because it was open source and free to use. Also, there was this licensing deal for startups with fewer than fifty people, which at the time was very far away in the future for us.
It was convenient for the licensing terms and it was also convenient as a developer to be able to download this community edition and just run it locally and develop something that was just a concept at the time.
Then Neo4j released a desktop application, which made it much easier to just go and create multiple graphs and turn them off and on as needed. And finally last year when we heard about AuraDB, it was right at the time we were thinking about production-quality deployments. It was perfect timing for us because we actually got into the early-access program.
We started testing this graph in Belgium first, and then we were really happy when we got the US Central region enabled because it’s way closer to our deployments in US East and West.
What have been some surprising results you’ve seen?
Recently we did a migration, and we were running this data set on AuraDB, but we needed to do some schema changes. It’s not really a schema, because Neo4j is schema-free, but we did have some changes in the way we were storing connections, naming nodes, and so on.
But the data set was running in production, so we didn’t have much time to turn the system off. We asked for some downtime, about three hours, and the interesting thing was that we could download the data set, process it locally using APOC procedures, and then upload it again in the span of approximately an hour. The second hour was spent preparing all the scripts and so on.
The actual process of downloading and transforming the over two gigabytes of data took about an hour. We were really happy to be able to do that and we continue to use a more efficient query that we just wrote this year.
What is your favorite part about working with Neo4j?
Besides the Cypher language (which is very intuitive because of all of the ASCII-Art indicators that show what a node and a connection are) I would say it was really useful to have APOC procedures because otherwise we wouldn’t have been able to do this migration.
Specifically we were using this periodic e-trade and periodic commit in large data sets that were just crashing when we were trying to transform 1.5 million nodes. Then we discovered this APOC procedure and we were able to do the migration in about nine minutes for this data set. That was pretty useful.
What’s next for Minka?
Well, of course we are always thinking about scale. We are looking forward to using a full graph in AuraDB. That’s going to take about 64 gigabytes of memory. We still have a long way to go.
But what I really like about these cloud-hosted graphs is that we can implement our vision of having multiple transaction-processing clusters, each running on its own graph possibly, then building bridges between them so that we can move money between the different graphs. We are not yet at that stage, because as I said, we are only using one graph at the moment. We envision first scaling up to the limit of one single cluster, and then spinning up different clusters to accommodate the demand.
What do you think the future holds for graph technology?
That’s something that I am personally really excited about. When I learned about AuraDB last year, I was living in China and I was working on better ways to learn Chinese. It turns out that transactions practically draw a graph in the Bitcoin system. Chinese characters also draw a graph between them.
So I see the future of graphs everywhere. Maybe I’m a bit obsessed about it, but definitely I see not only a big market for Neo4j, but also for developers trying to find better ways to model problems. So it’s not really about tables and rows; it’s essentially all about connections. Everything’s connected out there. We just have to go and find the connections between things, and then put it on a database, hopefully Neo4j.
Want to share about your Neo4j project in a future 5-Minute Interview? Drop us a line at content@neo4j.com
Get this white paper and discover The Top 10 Use Cases of Graph Database Technology.


