How the ICIJ Unraveled HSBC Fraud Using Neo4j & Linkurious

Online Editor, ICIJ
5 min read

 The world of offshore finance is a murky one.
In order to conceal the private lives and fortunes of the world’s most rich and powerful, ownership of cash and assets are deliberately obscured. It’s a world driven by vast networks with multiple layers of account ownership and company structures all with a singular aim: hiding money.
In early 2014, the International Consortium of Investigative Journalists (ICIJ) launched a major investigation after two French journalists – Gérard Davet and Fabrice Lhomme – received access to a massively complex dataset detailing over 100,000 private bank accounts of the Swiss branch of HSBC.
The Swiss Leaks investigation involved over 150 reporters from more than 45 countries analyzing this enormous leaked dataset composed of over 60,000 files – so we’re talking a very deep inside view of the secret world of Swiss banking.
So, how did ICIJ tackle this larger-than-life investigation into the shady world of offshore finance? As online editor Hamish Boland-Rudder reveals in a Q&A with Neo4j, many of the investigation’s findings came with the help of a graph database.
How much experience does ICIJ have in big data leaks and data journalism?
ICIJ is a tiny non-profit investigative news service with huge ambitions: we take on some of the largest corporations and entities in the world, exposing scandal and unethical behavior wherever we find them.
Particularly with our financial investigations, leaks of insider information has played a big part in this. But with such a small staff, we have to invest wisely.
Our biggest investment? Data.
Our data team is more or less half of our staff, and we’re always thinking about ways to improve upon our datasets and leverage them for a stronger story. Neo4j has proven to be a very useful mechanism for organizing and exploring these massive leaks.
What did the Swiss Leaks dataset reveal about the secret world of Swiss banking?
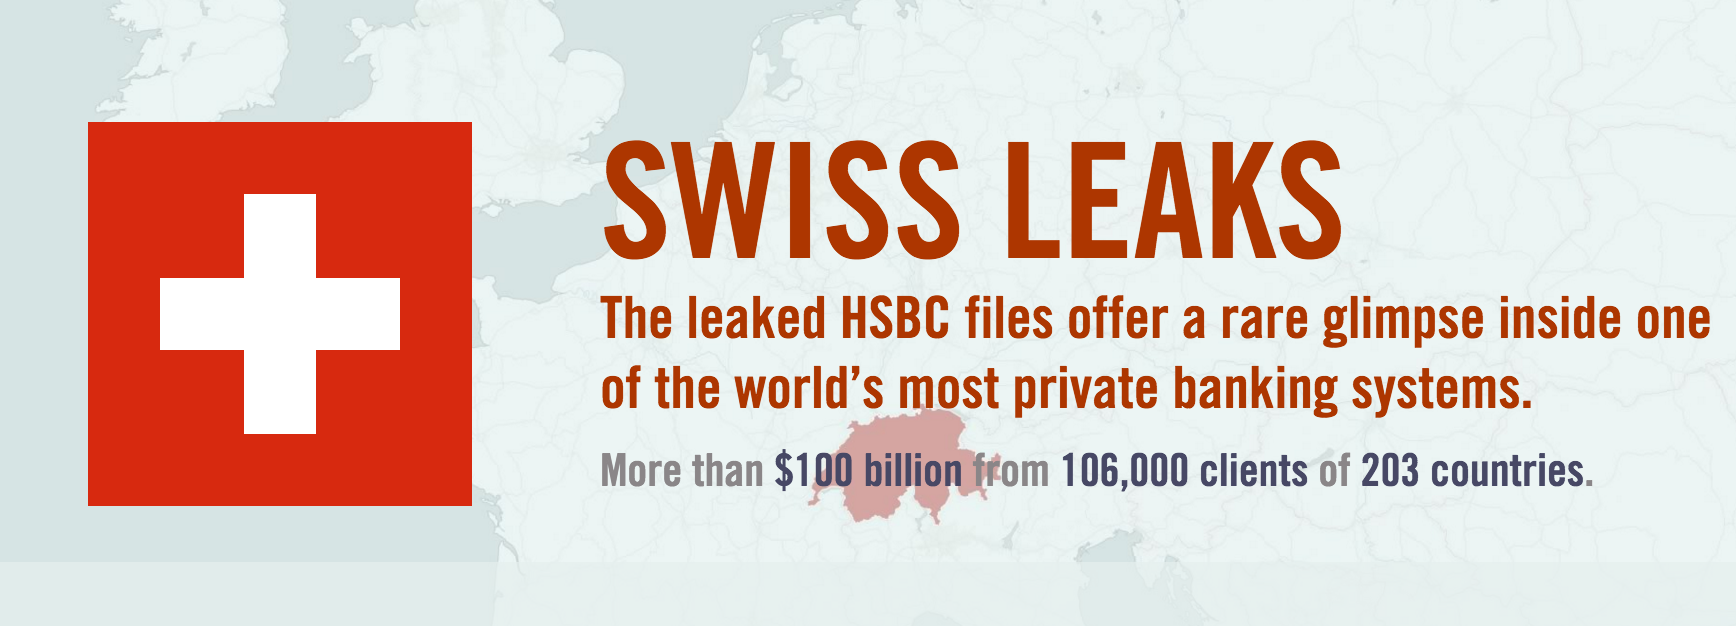
The Swiss Leaks data involved over $100 billion spread across about 100,000 clients.
Detailed account files combined with the complexity of the Swiss banking system meant we had a lot of data driving this investigation. In the end, our Neo4j database included more than 270,000 nodes of data
and 400,000 relationships.
Beyond these big numbers, the most surprising element of the entire investigation was witnessing the complicity of the HSBC staff in these seemingly questionable transactions and layers of accounts.
For example, particular clients were allowed to use code names instead of their real names, and in other cases clients were able to request that the bank keep all their account mail in Switzerland rather than send it to their home countries – a practice that has since stopped.
There were typically multiple layers of ownership over accounts and a lot of interconnectedness between them. Most of these tactics were deliberately designed to obfuscate any clarity over who really owns the money – making any data analysis that much more difficult.
This level of secrecy afforded to HSBC Switzerland clients was surprising to say the least, particularly when you think HSBC is the world’s second largest global bank.
Admittedly, this all happened through their Swiss branch which is a separate arm of global giant we all know as HSBC, but it’s essentially the same bank.
While average people like you and I don’t have access to these services, the über-rich and powerful are able to do amazing things with their accounts in order to hide it from the authorities, from the tax man (that’s a huge one), and even in some cases, from their own family members.
Once we saw this data and the stories it told, we knew it was worth every effort to investigate. But with such a vastly intertwined dataset, we knew we needed the right tool for the job to leverage every single data point.
How did Neo4j & Linkurious help in the investigation?
When you wind up with 60,000 spreadsheets, the best possible way to analyze them is to break them down into individual nodes. That way, the links and networks between each node are much easier to discover.
When you think about it in this way, a graph structure makes a lot of sense.
Our past experience with this sort of financial investigation helped: the Swiss Leaks story wasn’t the first time we’d used node-based databases. We first used them in a similar investigation known as the Offshore Leaks, in which we simulated a graph structure using a relational SQL database.
Once we received the Swiss Leaks data, we knew we needed to import it into a genuine graph database for easier and faster searching.
That graph database was Neo4j. We came to Neo4j while we were looking for an off-the-shelf solution for visualizing the data. When we discovered Linkurious, which is powered by Neo4j, we knew we’d found a tool that struck the right balance between power and usability.
ICIJ reporters know how to conduct a cracking interview and dive deep into documents, but they don’t necessarily know how to query a database or understand the results. Linkurious was lean, easy to set up and – most importantly – easy for journalists to use. Linkurious has a very visual front end that is relatively intuitive for journalists to use regardless of their graph database background.
Learn More at GraphConnect San Francisco
I will be presenting the rest of the details of the Swiss Leaks story – and the data science behind it – at GraphConnect San Francisco.
At my session, I’ll take you behind the scenes of the investigation and the dataset at its core, and show you how the story went from a mess of 60,000 Excel spreadsheets to an in-depth look at one of the world’s most secretive banking systems.
I’ll show you how – by using Neo4j and Linkurious – we were able to gain a much deeper understanding of how these personalities have structured their accounts for deliberate obscurity and how we were able to visualize the relationships between accounts and the real-world people and companies behind them.
Register for GraphConnect San Francisco to hear the whole story – from importing the initial data to breaking the news to the world.
Click below to register for GraphConnect San Francisco and join Hamish Boland-Rudder and many other graphistas at the only conference that focuses on the rapidly growing world of graph databases.


