
It’s Officially Fall: Let’s Catch Up on What You Missed This Summer

Senior Manager, Global Marketing Programs
2 min read
That’s right – it’s fall! Time to break out your sweaters, jump in piles of leaves, and warm up with pumpkin spiced lattes. What does this have to do with webinars? Nothing really, but it’s one of my favorite times of the year, so I thought I’d lead with that!
While you were enjoying the dog days of summer, perhaps by lounging in the sun or spending time with family, we were busy producing two of our marquee digital events – Connections. In this month’s blog, I’ll recap our July Connections – Knowledge Graphs for Transformation and the August Connections – Accelerating Innovation with Graphs.
July Connections: Knowledge Graphs for Transformation
Knowledge graphs are driving industry disruption and business transformation, as enterprises across the globe use them for data governance, data compliance, fraud detection, machine learning, medical research, and more.
When applied effectively, knowledge graphs put data in context, providing clarity about processes, products, and customers to drive complex decision making.
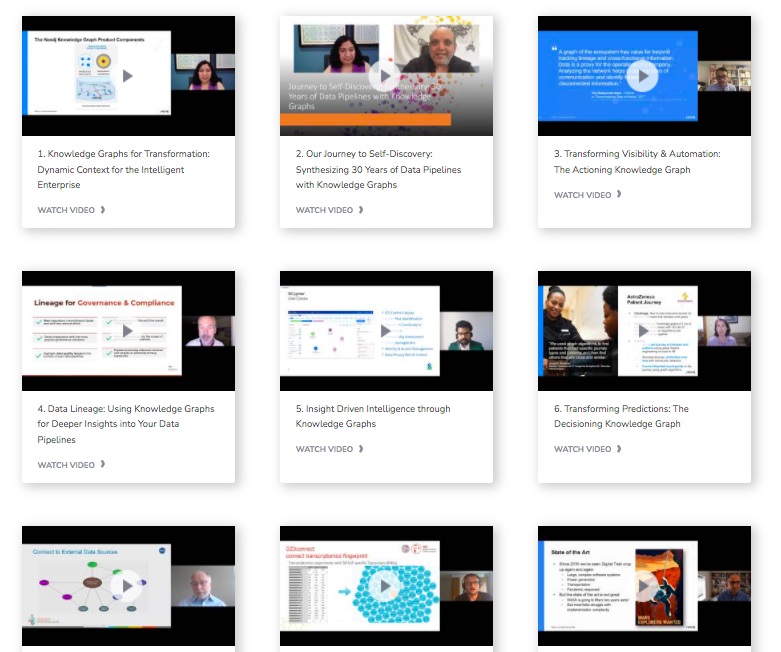
This half-day event featured a keynote from Mayank Gupta, SVP Technology at LPL Financial followed by a treasure trove of guest speakers from NASA, The German Centre for Diabetes (DZD), as well as Neo4j experts like Chief Scientist Jim Webber. The sessions were a dynamic mix of thought leadership and practical, real-world examples of how knowledge graphs are transforming businesses. Go to the Video Archive to check out all of the stellar presentations.
Knowledge Graphs for Transformation Video Archive
Check out the video archive
August Connections: Accelerating Innovation with Graphs
With artificial intelligence (AI), machine learning (ML), and graph technology taking the center stage for modern, intelligent applications, Neo4j is helping developers and data scientists find their fastest path to innovating.
Disruption in technology is driving change across every major industry today, and that change represents a unique opportunity for organizations, of any size and value, to differentiate through innovation. Whether it’s getting to Mars a year earlier than expected or connecting disparate information to take down a massive money laundering network, graphs are powering innovation on a global – and cosmic – scale!
The presentations are full of examples on how to innovate with graphs, featuring speakers from esteemed enterprises and partners. Neo4j experts also discuss why innovation is critical to your success and how to expand your graph use cases to spur innovation. Watch the recordings to learn more!
Accelerating Innovation with Graphs Video Archive
Check out the video archive
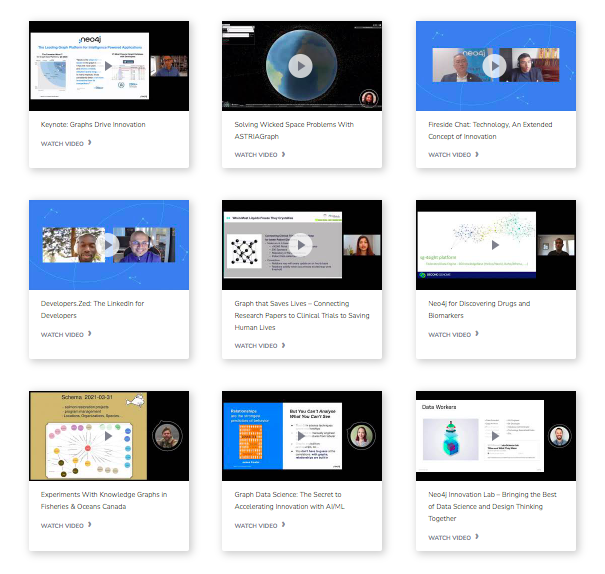
That’s all for this month. I hope you enjoy watching the sessions! Oh! And be sure to watch the August presentation from ASTRIAgraph on tracking space junk – super cool stuff – but then again, all of the sessions are super cool! I’m off to rake some leaves – it’s that time of year.
.
Share Article


Explore
Related Articles
Neo4j Named a 2025 Gartner® Peer Insights™ Customers’ Choice for Cloud Database Management Systems


How to Improve Multi-Hop Reasoning With Knowledge Graphs and LLMs

