Knowledge graphs: Data in context for responsive businesses [New Book]

Sr. Program Director, Knowledge Graphs
5 min read
Knowledge graphs have been around for almost half a century – as the term was first coined in 1972! For a long time, they simply languished in the academic world until Google announced their knowledge graph in 2012. Since then, knowledge graphs have evolved quite dramatically, and now there is no turning back.
The last 10 years have seen a meteoric rise in machine learning (ML) and artificial intelligence (AI). Because of their ability to drive intelligence into data and add context, knowledge graphs are used to make ML and AI more reliable, robust, trustworthy, and explainable. It’s only natural these two technologies are converging, spurring the growth and necessity of knowledge graphs.
Timely then, as we have exciting news to share.
We are thrilled to announce the availability of the O’Reilly: Knowledge Graphs: Data in Context for Responsive Businesses book – a practical guide for business leaders, data scientists, and developers.
A Sneak Peek at Knowledge Graphs: Data in Context for Responsive Businesses
Data is one of modern enterprises’ best assets. However, data is an asset only when deriving information and actionable insights from it.
Managing and leveraging data typically falls to the Chief Data Officer (CDO). In a 2021 NVP Big Data and AI Executive Survey 2021, where 76.0% of respondents held the role of Chief Data Officer or Chief Analytics Officer, only 39.3% of them viewed data as a “business asset.”
Yet, organizations lose an average of over $2 million per year due to ineffective data management. That’s because data volumes and sources are increasing and evolving so quickly, organizations find it difficult to use their data for insights.
Enter knowledge graphs
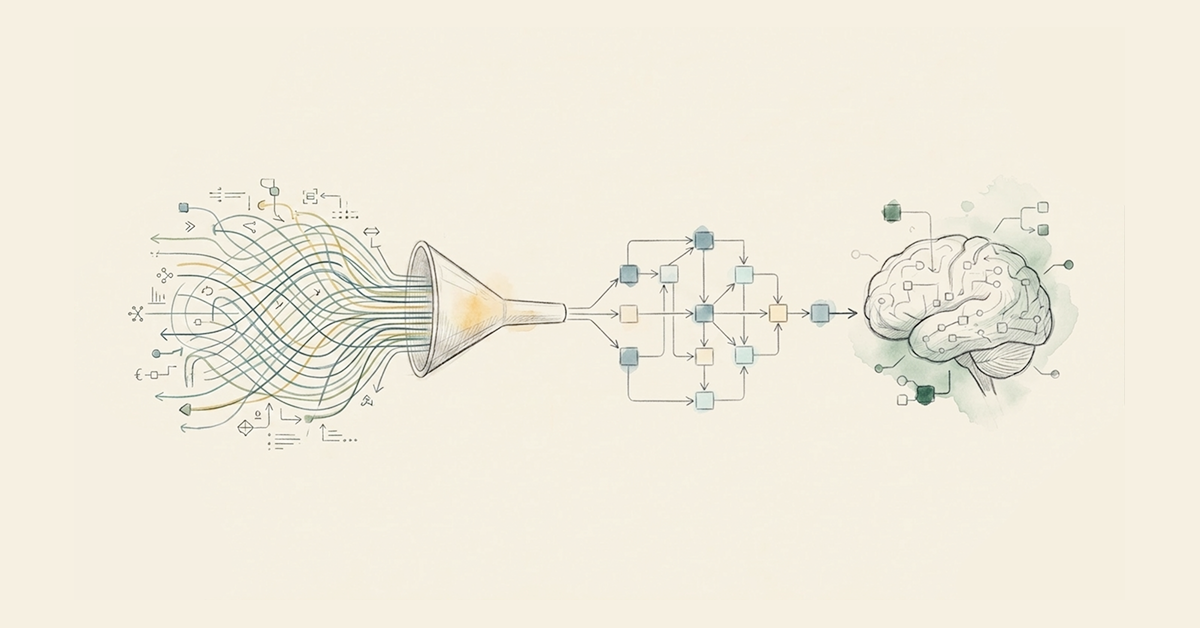
Knowledge graphs drive intelligence into data via context and relationships. Knowledge graphs organize and provide a single place to find relevant data and – just as importantly – to interpret and act on what’s significant. Connected data, enriched with meaning, allow for better answers to complex queries and find the most efficient path to invaluable insights.
How do knowledge graphs drive intelligence into data? With an “organizing principle.”
An organizing principle is an additional layer of organizing data (metadata) that adds connected context to better extract meaning from a graph and support reasoning and knowledge discovery. Rather than repeatedly encoding smart behavior into applications, knowledge graphs encode it once directly into data – smarter data facilitates reuse, while reducing duplication and discrepancies.
There are many flavors of organizing principles, more formally known as semantics – from controlled vocabularies like synonym rings, taxonomies, and ontologies to entity resolution and analysis to tagging, categorization and classification, and even AI.
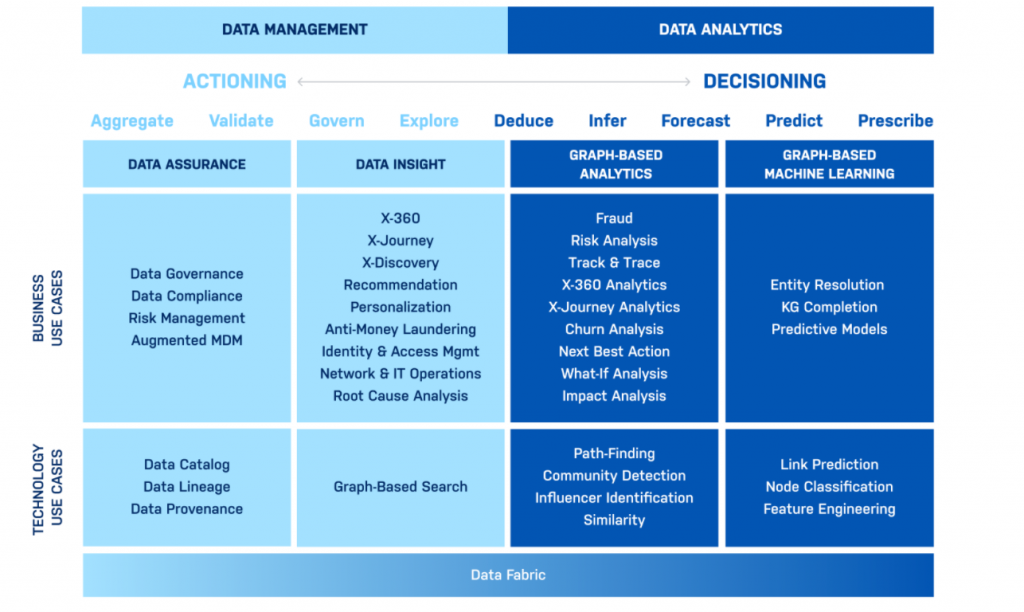
Knowledge graphs are multi-dimensional and multi-faceted, and lend themselves to a wide array of use cases. They span data management and analytics and fall into two distinct types: the actioning knowledge graph and the decisioning knowledge graph.
The actioning knowledge graph
An actioning knowledge graph provides a way to better automate processes and take action by providing data assurance, discovery, or insight. While data assurance focuses on data aggregation, validation, and governance, data insight is all about going beyond just visibility of information – it’s anchored around exploration, deduction, and inference of new knowledge.
Examples of actioning knowledge graph use cases include data governance and compliance, risk management, augmented MDM, X-360, AML, root cause analysis, and many others. Actioning knowledge graphs provide data assurance and radical visibility.
The decisioning knowledge graph
A decisioning knowledge graph is used for analytics, machine learning, and data science to surface trends in data and improve decisions.
Examples of decisioning knowledge graph use cases include fraud detection, risk analysis, track and trace, patient journey analytics, feature engineering, knowledge graph completion, and many more. Decisioning knowledge graphs provide better predictions and more breakthroughs.
The common thread amongst all these use cases is relationships. Relationships are highly predictive of behavior, but they are often ignored because, historically, it has been challenging to process them at scale. Instead of ignoring them, knowledge graphs incorporate relationships for data assurance and insights and into analytics and machine learning workflows.
The end result is improved governance and compliance, complete visibility, increased efficiency, and better predictions for better decisions.
Knowledge graphs for contextual AI
Knowledge graphs also play a very important role in contextual AI. By providing connected context for AI, knowledge graphs make AI more trustworthy, accurate and allow for better reasoning.
Knowledge graphs for innovations
Digital twins are all the rage now, spanning various industries such as manufacturing, power plants, supply chain, pharmaceuticals, and many more.
A digital twin is a software representation of assets and processes used to understand, predict, and optimize performance in order to achieve improved business outcomes.
Where knowledge graphs come into play here is that they provide the contextual blueprint for the analytics, algorithms, and simulations of digital twins, allowing for better predictive maintenance models and what-if scenarios for future designs.
Knowledge graphs are transforming businesses
From bridging data silos to building a data fabric to accelerating machine learning and AI adoption and providing a blueprint for digital twins, knowledge graphs are foundational and allow businesses to be competitive and thrive.
The three key takeaways from this book are the following:
- Knowledge graphs drive intelligence into data.
- Knowledge graphs lend themselves to a wide variety of use cases across the data spectrum from management to analytics and machine learning.
- Knowledge graphs bridge data silos and form the foundation for innovative applications like data fabric and digital twins.
It is not surprising then that over 67% of our customers have implemented knowledge graphs for various use cases across the data spectrum, including data governance at UBS, risk management at Standard Chartered, customer 360 at Qualicorp, skills discovery at NASA, fraud detection at Allianz, BOM management at the US Army, patient journey analytics at AstraZeneca, digital twin at TCS, and much more.
“Knowledge graphs are driving the next wave of breakthroughs and competitive advantage for organizations.”
Join the webinar “Meet the Authors” on September 14 or September 21, where you’ll hear from the experts on how knowledge graphs are used to drive key business decisions.
Share Article


Explore
Related Articles

Neo4j Named “One to Watch” in Snowflake’s 2026 Modern Marketing Data Stack Report


