
Missed Connections: A Tale of a Porsche, Paul Newman and a Relational Database

Hired Brains Research
5 min read
The promise of big data was the ability to apply analytics to data in volumes and complexity not possible before, but the promise was only partially kept. While it quickly became economical to gather big data, making sense of reams of data turned out to be elusive.
Among many reasons, one stands out: Data exists in many forms and drawing inference from data sources that are not compatible drained effectiveness from the effort.
In short order, SQL, a language designed for relational databases became the preferred tool, and big data became our unwieldy data infrastructure. Unfortunately, SQL was not optimized for a great deal of analytics demanded from big data, loosely defined as “data science,” such as:
- Noticing unusual activity, such as fraud, traffic patterns or ticket purchases
- Preventing crime and performing counterterrorism: connecting a phone number to a real person at a physical address and other phone numbers and addresses associated with a particular person
- Detecting influencers in groups, such as prescribing physicians or on social networks
- Analyzing traffic and performance of power grids and transportation networks
- Optimizing a wide range of analyses such as routes, supply chains and even yield/revenue management
- Researching in life sciences that requires linking enormous amounts of data from multiple sources such as genomics, precision medicine and disease vectoring
Data science doesn’t appear from thin air – it requires data, and a lot of it. Data for analysis comes from many sources and in many forms, such as:
- Data from social media
- Sequential storage or results from experiments such as machine learning
- Data from legacy databases and data warehouses
- Logs from servers
- Shadow systems developed using desktop software
- Existing analytical reference data not found elsewhere such as alignments, hierarchies, etc.
- External data either purchased or available for use from government agencies and even research data such as clinical trials
- IoT: streaming data in near-real-time from devices
The relational database is the workhorse of Information Technology and has been for roughly 30 years. An often overlooked fact is that relational databases are not particularly good candidates for big data. They are scalable at high cost and slow to produce results to analytical queries.
Over time, the technology has improved, both in terms of the software and the design methodologies. But one area where relational and SQL perform poorly is efficiently finding and deriving relationships.
Graph databases and graph analysis solve the problem of finding and manipulating information about relationships at scale. A graph approach to analytics solves many of the problems posed by SQL. But what is the value of transforming your data to a graph format?
Finding Connected Data Insights in Your Existing Data
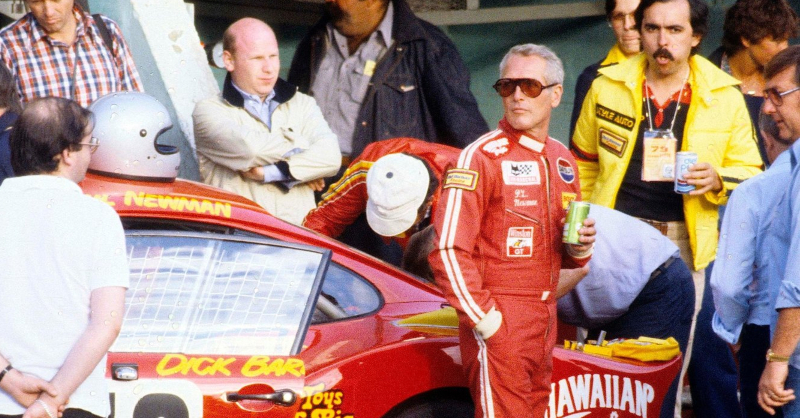
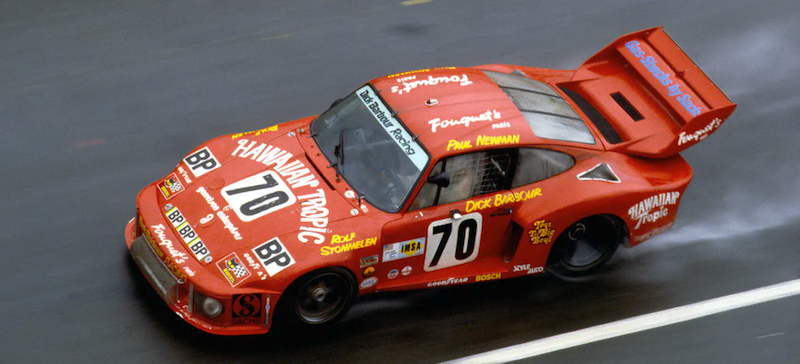
At a classic car auction in 1997, the Porsche 935 that Paul Newman, at age 54, co-drove to second place in the 1979 24-hour LeMans race, sold for $4.4 million (tack on the 10 percent buyer’s premium ($440,000) and it was quite an expensive day for the buyer.
Why would an obsolete race car that can’t be driven on the street be worth such a great sum? We know the lineage of the vehicle, but it is the provenance of it, that the late Paul Newman drove it, that gives it such value. In fact, the car’s provenance is extensive:
- 1979 class victory in the 24 Hours of Le Mans with Newman at the wheel (co-drivers were Rolf Stommelen and Dick Barbour)
- 1980 This very same 935 became known as the infamous “Apple Car” sponsored by Apple Computer
- 1981 Won the 24 Hours of Daytona
- 1983 Won the 12 Hours of Sebring
Typically, when an auction of high-end vehicles is scheduled, a catalog of the vehicles is created with detailed descriptions, including an estimated high-bid range.
Suppose for a moment that the analyst assigned to assess the value of the car was somewhat lacking in both racing and movie history. The promise of big data was to provide insight by drawing from large and disparate sources of data.
In this case, the task would involve finding and joining data from sources such as manufacturers VIN numbers, racing results and drivers. Using SQL, a complex set of queries and expensive JOINs would be needed to marry the essential facts about the vehicle, its racing history and, in this case, the prominence of a driver.
Graph Analysis
Essentially, there are four types of graph analysis that are most common in use by data scientists today – connectivity, community, path and centrality:
Connectivity analysis: Used to expose the strength of a network or networks.
Community analysis: Used to expose the relationship of people or other entities in a social network and its dynamics
Path analysis: Used to find the shortest distance between two nodes in a graph (how two things are related useful for supply chain, distribution, logistics and traffic management, for example
Centrality analysis: Used to attain an estimation on how important a node or edge is for the connectivity or the information flow of the network
Using graph analysis the true value of the car can be easily revealed in the graph – the relationship between the car, the driver (famous), the driver’s prominence and the race itself. Deep attributes of all these aspects will reveal the connectedness and importance of the details.
Graphs depict this instantly, where an SQL query on a conventionally designed database would require a number of costly JOINs across multiple tables, some quite large, and likely at least partial knowledge of what to look for on the part of the data scientist.
Connecting the Dots
Neglecting to do the required research, the uninformed analyst failed to discover that not only did the car have a racing provenance, but it was driven by an iconic movie star, a prominent philanthropist, well into middle age, to a second-place finish and first-in-class LeMans.
Applying just “comparables,” he priced the car accordingly to other racing 935’s that have sold recently in the $200,000 range. Imagine the embarrassment of the auction company if the catalog had been released at that ridiculously low price. Fortunately, they employed a graph-based solution for tracking provenance and quickly adjusted the price.
When the Porsche 935 in question went on the block it was cataloged at $3,500,000. Bidding quickly passed it to a record $4,400,000.
The point of this story is that discovery of the relationships that affected the price of the car would have been obvious with graph analysis. Using SQL JOINs and relational database tables, on the other hand, would limit discovery to those things the analyst chose to examine.
Conclusion
Modeling this information in relational databases serves the purposes of transactional integrity, archival and general referential uses, but also causes a high number of many-to-many relationships which in turn leads to a succession of very costly JOIN operations when querying the data.
Graph structures are ideally suited to use cases such as the one above. They are not simple aggregate solutions (such as Key-Value Stores, Column-Family Stores or Document Databases). Because the graph query can traverse relationships, instead of joining large tables, it efficiently teases out inferences that can only be drawn from SQL by, essentially, asking about them.
It is not a question of graph versus relational. There are use cases for both. But connections in data are as important as the data itself.
Share Article


Explore
Related Articles

What Are the Different Types of Graph Algorithms & When to Use Them?


Turning Your Tabular Data Into a Graph Using Cypher
Mix and Batch: A Technique for Fast, Parallel Relationship Loading in Neo4j
