Monitoring Neo4j Servers and Clusters

Senior Director of Developer Relations, Neo4j
2 min read
Editor’s Note: This presentation was given by David Allen at NODES 2019.
Presentation Summary
David Allen is a Partner Solution Architect at Neo4j. Today’s talk features monitoring clusters and single instances.
Monitoring can be pretty dense and complicated. Neo4j exposes a couple of different options for how you are able to get data and monitor it from the outside. Halin is installed through a monitoring tool that uses open sources back in the Neo4j Desktop.
Allen performs a Single Node and Cluster demonstration showcasing Halin’s essential features for a user’s Neo4j system health and performance. These features include heap size or your working memory, physical memory, page cache ratio, transactions, file descriptors and many more.
Allen jumps into a working example and breaks stuff. When things go wrong, users can rest assured knowing that Neo4j will still do the best it can. If a node gets weighed down too heavily, because of network issues, Neo4j supports leader re-election.
Halin has great diagnostic tools that will work alongside different elements of your Neo4j configuration. In the configuration tools, you are able to filter out options and get cluster response statistics.
Halin and Neo4j work together through Bolt, the binary protocol used to communicate with Neo4j. This works just like a relational database might use JDBC.
Halin does, however, have its limitations and Halin won’t do real-time alerting, 24/7 monitoring or set trip thresholds. Halin is not for sending pages after page cache faults exceed their threshold and therefore might not be great for the bespoke needs of big enterprise companies.
Full Presentation
I’m David Allen and I am a Partner Solution Architect at Neo4j.
Most of my job day-to-day deals in working with the strategic partners of Neo4j. My role includes the cloud platforms but also covers some of our technology integration partners.
I enjoy writing a lot of open source on the side, which is part of what we’re going to be talking about today.
We’re going to get into some deep monitoring stuff and some nerdy fun stuff about Neo4j.
The software that we’re going to discuss is installable right now. Anything that you see done in this session is something that you are able to play along with at home.
We’re here today to talk about monitoring and how to look after clusters and single instances of Neo4j.
Monitoring
Monitoring is a pretty dense and complicated topic.
In general, what I want you to know is that database software, whether it’s Neo4j or any other database, is pretty complicated software with a lot of moving parts. Fundamentally, that software is making sure your data is always available to you.
As such, your data tends to have a lot of care and feeding involved with it. This is relative to other types of software that you might encounter, like stateless microservices.
Before we get into how we’re going to do this, I want to say that at the product layer, Neo4j exposes a couple of different options for how you are able to get data out of the product and monitor it from the outside.
Those options include Grafite, Prometheus, JMX and CSV files.
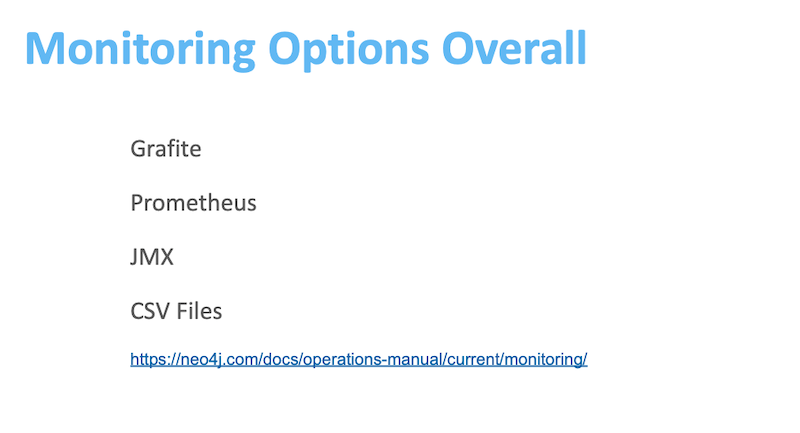
Click here to view our operations manual and see how those different options work and how to configure them.
Essentially, there are information streams that Neo4j produces at all times. You are able to get into any downstream tool to care for and feed a Neo4j cluster.
Halin
Today, I want to give you a tour of what some of the considerations around monitoring are. This tool is called Halin.
Let’s start by talking about why Halin in the first place?
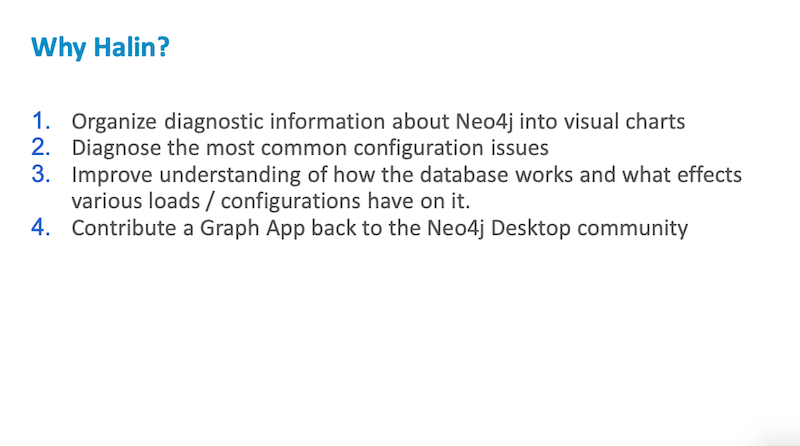
We want to take all of the different diagnostic information that Neo4j is able to emit. Then try to organize that information into a series of visual charts, this will allow people to see in real time what’s happening with a cluster.
We want to provide a way of diagnosing some of the most common configuration issues that you might run into.
Often, users would come to us and say, “I’m experiencing poor performance,” or “I’m experiencing out-of-memory errors.” A lot of that stuff is able to be detected before you apply a workload to a cluster.
We want to provide some feedback to the user about how their system is configured and how we are able to improve that. We also want to improve user understanding of how the database works and what impacts the loads and the configurations that you place on it.
We’re going to go over a couple of ways that you are able to educate yourself about Neo4j and learn more about database internals.
I use Halin because I like to do open source, just like many people at Neo4j. I wanted to contribute to a graph App back to the Neo4j Desktop community.
Before we get into a demonstration of Halin, I want to talk a little bit about how to install it and how to get started with it.
Getting Started
If you have Neo4j Desktop installed, you are able to click on the four-icon Graph App panel on the left by the first red arrow. At the very bottom you’re going to see a link that says, “Discover more Graph Apps.”
You have two options here. You are able to take the URL at the very bottom of the page, plug that into the install Graph App application box, click install and then you’re up and running immediately. Or you are able to click on the “Discover more Graph Apps” link at the bottom, and you will be taken to the Graph App install page.
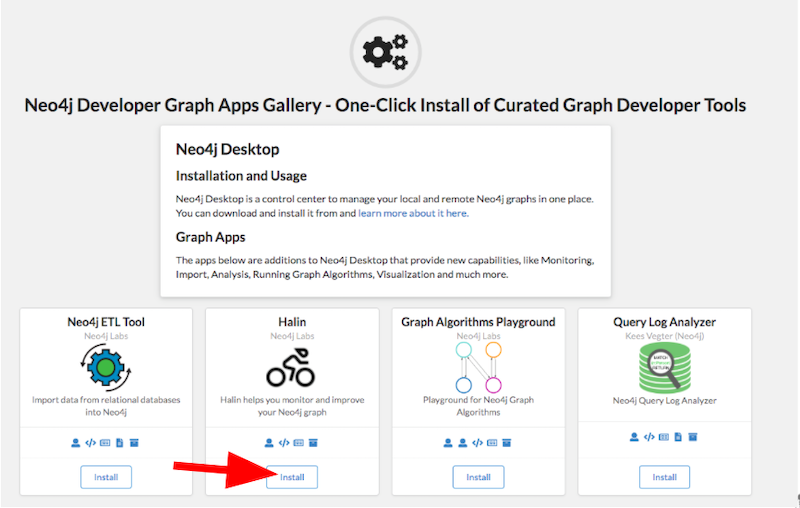
This is a separate web page that lists all of the different graph apps that Neo4j has available. Halin is going to be listed as one of them up at the top. That’s where there’s going to be an install button.
Now that install button interacts directly with your copy of Neo4j Desktop and will allow you to open that link as Neo4j Desktop, put Halin straight into your system, and allow you to use that with your current project in Neo4j Desktop.
The second option, if you choose not to run Halin within Desktop, or if you’re not on your machine where Desktop is installed, is that you are able to run it online as a regular web application.

As new versions of Halin become available, you are able to run it straight off of halin.graphapp.io.
Demo – Single Node and Cluster
Here we have halin.graphapp.io and I have a test cluster that I have created. I’m going to put in my username and password.
Next, I will encrypt the connection, and start up Halin.
After initializing the connection, we get to the overall user interface.
The overview panel gives you the single overview of your entire cluster and what’s going on. Each colored line represents one node in your cluster.
We’re looking at a four node Neo4j cluster. It happens that three are core nodes and one is a read replica. The lines are color-coded so you are able to tell which is which.
All of these displays have toggles. For example, I am able to turn individual lines off and on as they accumulate data and scroll over.
One of the things that Halin is going to guarantee is that the black line is always your cluster leader. You never have to wonder if you’re at what the leader is doing. You are able to toggle off everything but the black line will stay. Then you are able to see exactly what’s going on.
I want to go through a couple of things that it’s showing here. A lot of these things are critical to your Neo4j system’s health and performance.
Heap Size
The heap size that you specify is basically the working memory that Neo4j has for transactions that it runs. If you don’t have enough heap then you aren’t able to run transactions that are very large. If you’ve ever run into an “out of memory” error in Neo4j, it’s typically because you were trying to run a transaction that was bigger than the heap that you have available.
By monitoring your heap size you are able to see how much load your server is under, and how much memory it’s utilizing.
Right now, my cluster is really calm. One of the things I’m going to do in the background is kick off a sample benchmarking workload that I sometimes run. This is going to hit my server with lots of different queries and, for our purposes today, it’s going to make the lines jump around a little bit.
You are able to see that as I’m starting to place my leader under load, the heap size is starting to jump around as it has to allocate and deallocate memory in order to handle that query workload.
Physical Memory
Physical memory is all about your total memory that’s available, or RAM. Physical memory is broken down into a couple of different categories within Neo4j. You’ve got your heap, page cache, indexes and various other things as well.
Your last GC pause time is a measurement of how much time the database is taking up by reclaiming unused memory. One of the things that might slow down your Neo4j performance is when your GC pause time gets very large.
This pause is measured in milliseconds. We are able to see that our leader had a couple of 16 millisecond GC pauses. In general, they’re very low and this is very healthy looking. We are happy that garbage collection is not going to be causing this cluster an issue.
Next, we have one of the most important things about your overall system performance which is, page cache ratio.
Page Cache Ratio
The page cache is where you load data in from queries and it stays in a hot set. Cypher is able to give you a fast performance because it’s answering straight out of RAM.
You want to see a usage ratio that’s fairly high, and in particular, you want to see a high hit ratio. When Cypher queries are asking for data, you want to see that it’s usually coming out of the page cache. If it’s not usually coming out of the page cache that means it’s coming from disk and your performance is going to be slower.
Another thing that I want to draw to your attention is your faults per second on the page cache. Whenever the database needs something that it doesn’t have in memory, that’s called a page fault. It will go back to disk, fetch some data and then load that into memory.
If you see huge spikes in the page cache fault rates, that’s going to be a very strong sign that something is misconfigured with your memory configuration and that you’re probably going to be seeing very slow query performance.
Transactions
Transactions is a view of how many transactions are open, committed, rolled back, or peak concurrent. We are able to look at the high-water mark for each of our clusters and see that, right now, our leader hasn’t handled more than 10 at a time and max4 hasn’t handled more than six at a time.
You are able to see what your workload distribution is if you’re running an application against a cluster.
File Descriptor
File descriptors show how many open files are available on this system and this ties to some operating system limits.
If you’ve forgotten any of that technical detail that I’ve given you, I want to remind you that you are able to take a look at the little “i” icon. You are able to click those wherever you want inside of Halin, and that’s going to pop up a dialogue explaining what you’re seeing. It will also provide you with a link to further resources on the Neo4j website where you are able to get into things like, how do I tune this to be different, what are the best practices and so on.
This first screen is the overview that tells you something about the health of your cluster. The second is a list of breakdowns of what’s going on in each individual machine.
When we click on it, we see cluster members and then we see a display.
Clusters
The star always is referring to the leader of the cluster. Neo4j clusters are arranged into a leader-follower architecture where the leader takes all of the rights and the followers process generally read queries and also replicate your database to make sure that your data is always available.
This little copy icon is a read replica, meaning that is the fourth node in our cluster and it is available to scale out our reads horizontally. By hovering over this we are able to see that we’ve got this green signal bar, eight of eight fresh. We are able to get some data about how quickly this cluster member is responding. When everything’s green that means everything’s happy.
You are able to see overall performance, this is CPU load on the machine, memory within that machine. This covers the transactions that this particular machine is processing at the given moment and how much data is on disk and how that is stored.
For example, I am able to see that my graph is about three gigabytes right now.
Queries
In the queries tab, I’m able to see what queries are actively running on this node at any given time and inspect those. I am able to kill a transaction if it’s becoming problematic. Further, using the “Download” button. If I have a very high concurrent transaction load, I could download that as CSV to analyze that later.
Configuration
Inside the “Configuration” tab, also downloadable as CSV, I am able to take a look at how the entire system is configured. I am able to key in and look for particular configuration settings that I may have set along with getting a description of what those are about and what they mean.
Operating System
In the operating System tab, I am able to see that I’m running this on a Linux machine that has four cores with no swap memory enabled. I’m also able to see what the physical memory and file descriptors are on the underlying machine as well. Finally, I am able to see if I have the right APOC plugin installed, that enables me to see how much storage is available on the host.
Where I am storing my data I have 524 gigs of disk and it’s 98% free. This means I’m not at risk of just running out of disk anytime soon. That’s definitely a good thing.
Plugins
In plugins, we are able to see what’s available. You are able to tell that I have APOC and Graph Algorithms installed. Both of those are cool and I use them all the time.
APOC is the standard library of procedures and functions for Neo4j. In fact, some features in Halin even require or recommend the use of APOC.
One of the really cool things that Halin will let you do is live sample query collection. We are able to say, “I’m looking at my leader right now for 10,000 milliseconds, I want to collect every query that’s running on the system.” This is not happening in Halin, it’s just using a feature that’s already built into the database.
When the 10,000 millisecond frame is elapsed, it will display what queries were running, how many times they ran, how long it took to compile them and execute them and so on. All of that data is downloadable as CSV if you want to look at it another time.
Finally, with the right APOC configuration you are able to get access to some of your log files on disk. For example, I am able to load the debug.log file straight off of my node and this will allow me to diagnose issues from the outside.
So far this is all happy and nice and wonderful, but what happens if something goes wrong?
Let’s break stuff!
I want to move to a section where we’re going to break something and see what happens. We want to see whether or not we are able to see it going on using Halin.
The reason we want to do this is because a lot of bad things are able to happen when you’re running a Neo4j cluster in production. A leader re-election could happen if one node gets weighed down too heavily. A node is able to stop being the leader and another node in the cluster is able to assume the leader role.
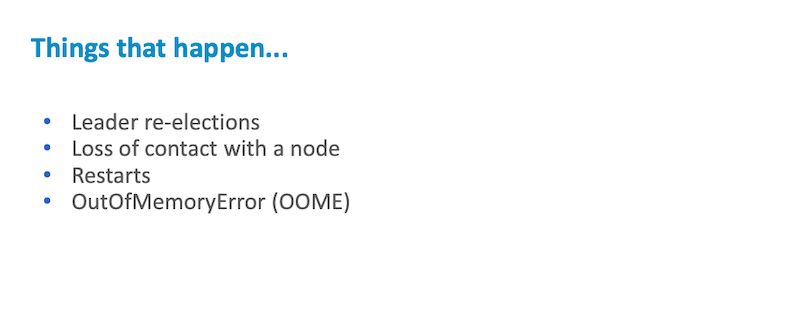
You could lose contact with a node because of a network issue. You could have a restart or an out of memory error.
To show you what that error is going to look like while monitoring a system with Halin, let’s do it ourselves.
Let’s say that we want to kick over our leader, which is max1. In the background, I have a Google project where I’m running these virtual machines that are backing the cluster.
I’m going to go over to max1 and wait for my SSH here to connect. I’m going to sudo systemctl restart Neo4j and knock over the database node on purpose, which is going to cause it to start and then restart the software.
In restarting that node I’m going to have a period of unavailability where the rest of the clusters aren’t able to talk to that node. It is going to be unavailable for processing queries. We can watch Halin and see what happens when we restart the node.
Our sign went yellow, then it went red and now our response times are starting to spike.
Now, if the cluster just lost it’s leader that’s really bad for the cluster because they are no longer able to process rights. Fortunately, the cluster topology that’s in Neo4j has already got that covered, and you’ll see that max3 just popped up to a star. That’s basically because max2 and max3 got together and they elected max3 the new leader. You don’t ever want to have a Neo4j cluster without a leader.
That took a couple of seconds at most.
In the background, the software should have started, sudo systemctl status Neo4j. We see that it’s in the process of coming back up and discovering it’s buddies in the cluster. When it does come back up, you should see the max1 icon go from red to green and then Halin will gradually realize, “Oh it’s actually not leader anymore, it’s a follower.” We’ve now simulated a cluster topology event and rolled over through that while monitoring it with Halin. The cluster event log will tell you when it detects those changes like that happening.
Diagnostic Feature
The next major thing I want to show you about Halin is the diagnostic feature. There is a wrench icon on the left in the cluster diagnostic tools. When clicked, there’s an option to run diagnostics. That is going to go through and systematically look through a lot of different elements of your Neo4j configuration. Then it will report back to you about what’s good, what’s bad, and what we might recommend doing differently.
Normally this is entirely private and Neo4j doesn’t get any of this information. If you’d like to help us improve the product you are able to click a button.
If you do click this checkbox, then the diagnostic package will be submitted to one of the services so that I am able to see it and we are able to tell what the common problems are. We are able to see what versions people are running and those sorts of things but that’s if you choose to opt in and it’s off by default.
Let’s go ahead and run diagnostics.
The diagnostics generate a package and then give you a set of advisor results. These advisor results are broken down by machine, level and also by category.
We are able to pick all of our warnings.
Sometimes, things go wrong with our cluster’s cluster.
One of my clusters say that the max1, page cache is not set, so it is not able to evaluate the appropriateness of our memory settings. For best performance, we must set heap and page cache sizes. We also have no constraints defined in our graph model. If we would define those constraints it would generally speed up a lot of our Cypher results.
We are able to look at the passes and all of the things that are right with this cluster to give you a sense of what this is looking at.
It takes a look at cluster TTL, your network port settings, your users and role sets. Next, it checks on whether or not you’ve got backups enabled, indexes in your database and a host of other issues. We don’t have to go through all of this, I just want to give you a sense of how much this is looking for.
Finally, you are able to organize these all into categories. One of my favorites is transactions.
When you run a transaction on a Neo4j cluster it has to get replicated to the other members in the cluster. Halin will let you see whether or not any of your members are falling behind.
For example, we are able to see that our leader has this last transaction id. We are able to see that our other cluster members are even with that. That means that they are replicating fine and that all nodes in the cluster have the full data set and that is what healthy looks like if you’ve got a Neo4j cluster.
Finally, when you’ve got this diagnostic package we have already gathered configuration information about every single node in your cluster so you are able to look at a difference.
Configuration
One of the things that I personally find a little bit challenging about Neo4j clusters is that all three machines have to have their own separate configuration file. Then a common theme is “what’s different?” Did I mess something up here on node three but node one is fine?
In the configuration difference tool you are able to see that. You could filter out and then go down to the options that are different. The advertised address of each node is different and that’s good, they should be. They all have different addresses and their roles are a little bit different. We have three cores and one read replica which is kind of what we would expect.
If I look at this configuration difference I would say “All three nodes in my cluster are synced up and are looking good in this way.”
Here on the final page, you are able to basically get some cluster response statistics and get a picture of how quickly your cluster is responding to network traffic going back and forth.
A source of slow query performance is able to respond to network traffic if your database is very far away. If you have 400 millisecond latency there and back then you are able to expect a fast answer out of a remote Bolt client. Then a number of detected settings and this is where Halin is telling you what it knows about your system.
User and Role Management
Using user and role management, you are able to get a graphical way of adding users.
Let’s add one called NODES2019 and then type in a password for our user, create that user, we’ll add a role called NODES2019.
Next, I’ll manage the user and pick the NODES2019 user. We assign them the roles of NODES2019, editor, and architect.
Over here in the cluster diagnostics we are able to see that user and role changes have been made to our cluster. You are able to verify this a separate way. You could go into the leader, go into its logs, look at it’s security logs and you’re probably going to see something similar.
Yep, created user NODES19. Then add those roles to that user. That user and role is now replicated all the way across the cluster.
How does it work?
How does all this magic work? If you’ve worked with Neo4j, you probably know about Bolt. Bolt is the binary protocol that we use to communicate with Neo4j. Just like a relational database might use JDBC, we use Bolt.
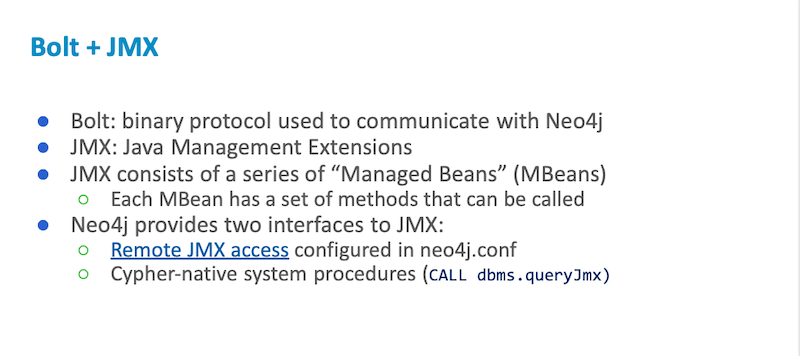
Now, a lot of Java applications have a thing called JMX, which are the Java Management Extensions. They consist of a series of Managed Beans. Beans have methods that you are able to call. Neo4j provides an interface to JMX. You are able to set it up remotely or you are able to call Cypher procedures inside of Neo4j and get JMX data out of it that way.
To give you a simple example in Cypher terms, if I ran this query against Neo4j 3.5, I would be asking for Java platform level statistics about the operating system underneath.
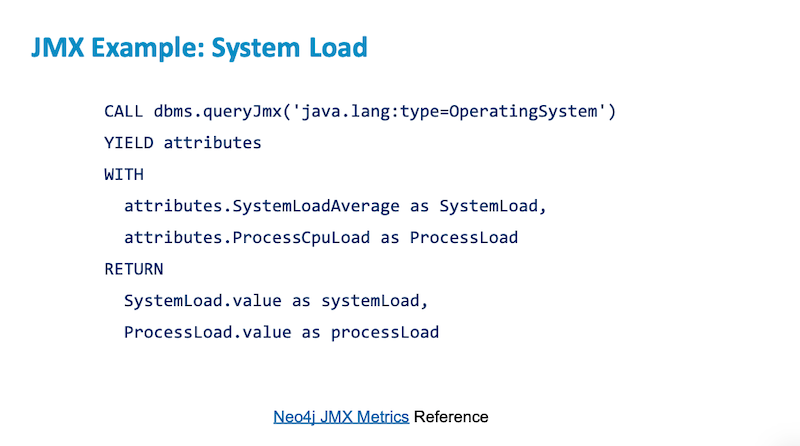
I could ask for its system load or its process load and then return those just as regular variables. That is effectively how Halin is working. Halin is a pure Javascript Bolt client, so when you’re running it in your browser you are a client of the database just like any application that would use Bolt. Everything that Halin is doing is pure Cypher. There’s no special access or anything different. If you have an administrative account, you could do everything that I’m doing in Halin with Cypher Shell – the only difference is that it wouldn’t be graphical.
What Halin Won’t Do
There are a couple of limitations of what Halin won’t do. Halin won’t do real-time alerting or 24/7 monitoring or setting of trip thresholds.
If you’re part of a big enterprise and you have bespoke needs like wanting to make it so whenever the page cache faults exceed some certain threshold somebody gets paged – Halin is not for that use case.
For that, there are a bunch of other tools like Grafana, Stackdriver and Datadog. That makes the problem look a little bit different. Instead of visualizing what’s going on with your cluster, what you’re going to do is use Prometheus metrics and ship them over to a service like Datadog. Datadog, as a separate interface and application, would allow you to set thresholds and reminders and so on. Datadog could do things like automatically page your admin if the database is having trouble.
Monitoring Alternatives for Neo4j
Halin is not the only game in town. There are some articles on Medium that I’ve found to be resourceful.
There is an option to build operational dashboards with a tool called Hawtio.
There is a way of shipping monitoring metrics with Prometheus. With Prometheus you will produce a feed of metrics from Neo4j to some third party tool.
There’s also a number of options for Grafana. Grafana is a monitoring tool that takes Graphite. If you are an enterprise customer I believe we have some internal dashboard code where we could help you with a preconfigured Grafana dashboard. However, there are a lot of other customers that are using these data feeds to build their own according to their own internal needs and we think that that’s also a great option.
Share Article


Explore
Related Articles

What Are the Different Types of Graph Algorithms & When to Use Them?