
The Neo4j BI Connector: Introduction

Senior Director of Developer Relations, Neo4j
1 min read
Graph database adoption is on the rise. But does this mean that people have to give up their favorite BI tools? The answer is a resounding no.
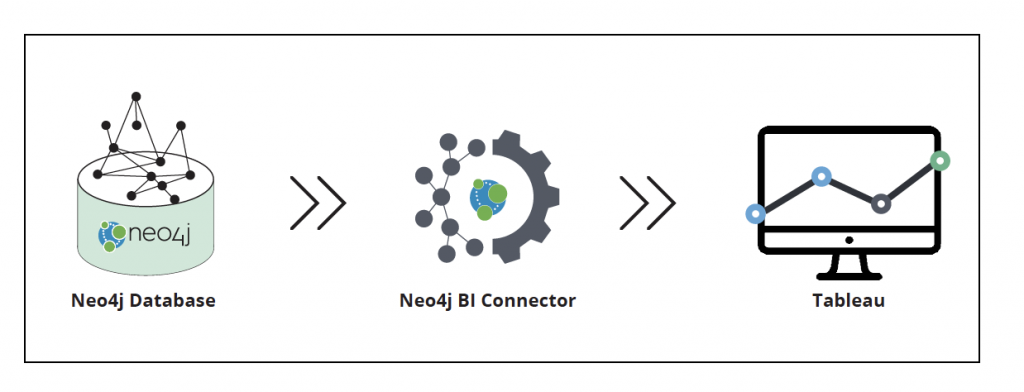
The Neo4j BI Connector delivers direct access to Neo4j graph data from business intelligence (BI) tools such as Tableau, Looker, TIBCO Spotfire Server and Microstrategy. It’s the first enterprise-ready, supported product to deliver connected data results to BI users.
In this first blog of our five-part series, we cover what the BI Connector does behind the scenes and why business intelligence and graphs are both in high demand.
The Neo4j BI Connector: Introduction
With the Neo4j BI Connector, you can deliver direct access to Neo4j graph data from business intelligence (BI) tools such as Tableau, Looker, TIBCO Spotfire Server and Microstrategy. The BI Connector is enterprise-ready and supported to deliver seamless, real-time results. avoiding
coding, custom scripting and ungoverned access.
Capabilities
The BI Connector enables data analysts, investigators and data scientists to:
- Connect to a Neo4j database in real time
- Select graph data in the same manner as relational and NoSQL data
- Query using SQL to retrieve data from Neo4j in tabular form
- Analyze and visualize
Availability
The BI Connector is available at no extra charge for Neo4j Enterprise Edition customers.
Functionally, the product:
- Builds on the Java Database Connectivity (JDBC) standard
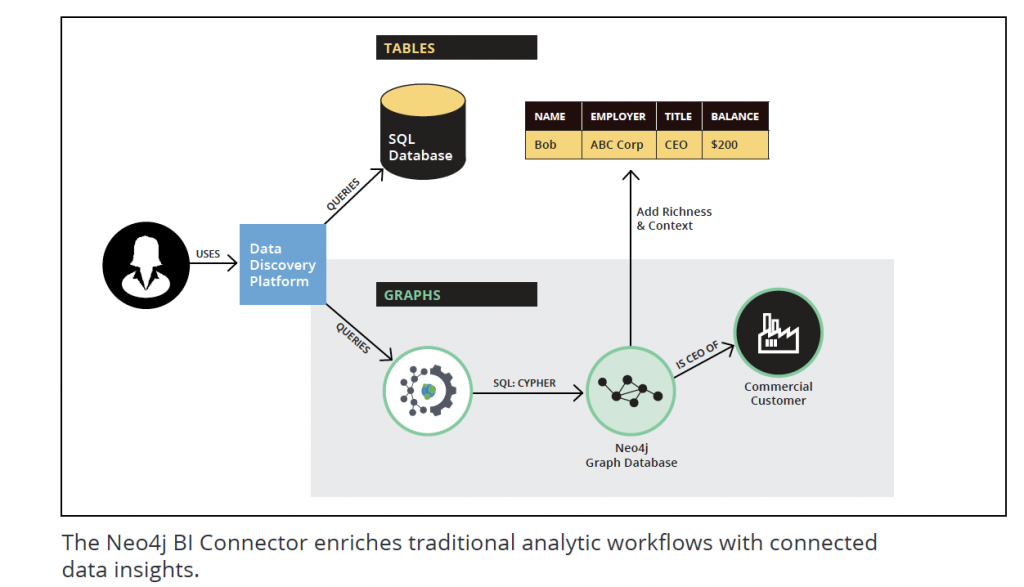
- Translates SQL into Neo4j’s native, graph-optimized Cypher language
- Makes connected data insights accessible in real time
- Is fully supported and ready for production and ready for enterprise deployment
Why BI and Graphs Are in Demand
Business intelligence (BI) tooling has been used for years to inform key decisions. The idea is simply to gather information from around an enterprise, fuse it and build decision-oriented dashboards around that information. This gives executives a view of KPIs and what’s happening throughout a complex enterprise.
Drive Decision-Making with Graph Insights
Neo4j and graph approaches, on the other hand, represent a powerful set of capabilities for getting insight into data. But what use is that insight if it cannot be readily combined with existing decision processes?
The Neo4j BI Connector acts as a bridge that makes it easy to get your graph data into other tooling, but the raw technology isn’t the story. The real benefit lies in improved decision-making based on better information and key graph insights.
Customers get substantial value out of these graph insights just on their own, but they become even more powerful when they are mixed, matched and integrated with other data sources elsewhere in the enterprise.
Connect the Dots within Organizations
In very large organizations, it’s also valuable to share data between organizational units in a simple way. Many Neo4j customers have fraud analytics applications, or other uses of graphs, which are specific to a particular department or project within their enterprise. Business
intelligence, however, is often organized as a cross-functional project elsewhere in the enterprise.
The BI Connector acts as a bridge between these units in the enterprise, making it easy for a project to expose their fraud insights to a different BI group, inform other processes and drive decisions. In this scenario, Neo4j is put on equal footing with other databases or data
warehouses – such as Oracle. Any of these data sources can be used with equal ease to drive dashboards and insights.
Low Code / No Code Integration
Low-code software development trends favor increasing use of BI platforms over time. There has been an explosion of available information, and tooling allows business analysts to contribute without a deep software engineering background. The tooling, the wide base of analyst talent, and just a little bit of SQL are enablers for getting value out of data. Exposing graph data in a way that is friendly to the relational / BI world simply adds fuel to the fire.
Prior to the BI Connector, graph data was accessible to those who knew Cypher and had graph tooling, but harder to access for non-graph users. Custom code was required, and the state of the art was to develop scripts to export data to CSV periodically.
Conclusion
BI tools are gaining traction across the business, and so are graph databases that store data with all of its connections. The BI Connector bridges the gap between the tools people love and the query language those tools use (SQL) and the growing universe of data stored in graph databases like Neo4j.
Next week, in blog two of our five-part series on the BI Connector, we will cover some of the ways people use the BI Connector, from fraud detection to business impact planning to retail sales.
Share Article


Explore
Related Articles


What Are the Different Types of Graph Algorithms & When to Use Them?

Top 10 Graph Database Use Cases (With Real-World Case Studies)

15 Best Graph Visualization Tools for Your Neo4j Graph Database
