The Neo4j BI Connector: Many use cases

Senior Director of Developer Relations, Neo4j
6 min read
More people than ever have important data in a graph. So how can they view that data in their favorite BI tools?
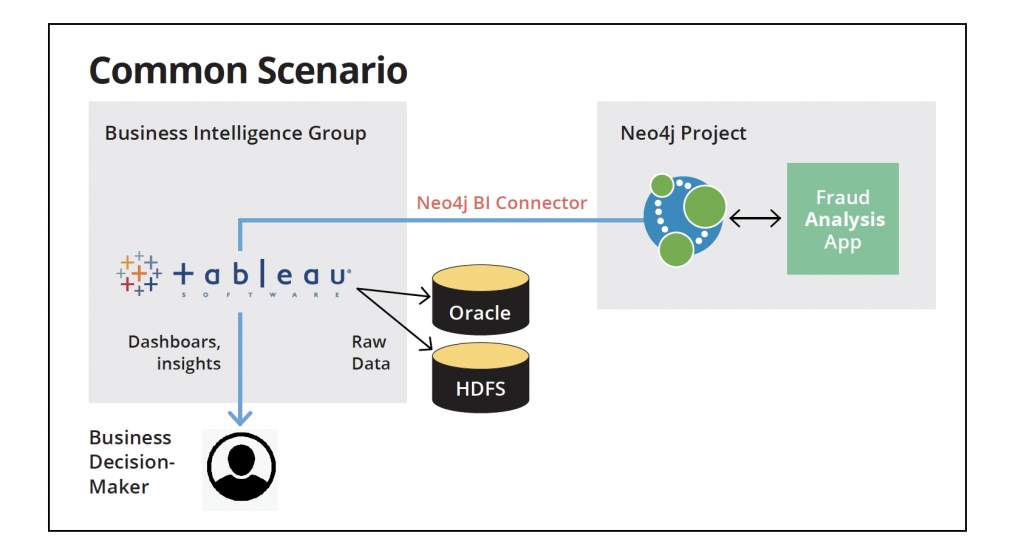
The Neo4j BI Connector delivers direct access to Neo4j graph data from business intelligence (BI) tools such as Tableau, Looker, TIBCO Spotfire Server and Microstrategy. It’s the first enterprise-ready, supported product to deliver connected data results to BI users avoiding coding, custom scripting and ungoverned access.
In this second blog of our five-part series on the BI Connector, we cover how it can assist you in rooting out money laundering, aiding in business impact planning and helping retail companies run BI visualization scenarios.
Money laundering and financial fraud
Consider a customer that uses Neo4j for money laundering detection. Within such a project, Neo4j performs well. In a wider enterprise scope, however, we need to know whether the overall fraudulent activity is up relative to last year or whether the detected activity is related to what other businesses or governments have reported.
Business impact planning
Another customer uses graphs to inform KPIs and business impact planning. In the case of a large supply chain or economic shock, businesses need to know their exposure. By using graph techniques, they can determine the total value of a complex web of relationships between companies. They can then use that total value to inform business decisions on how to adapt to the shock, whether it’s a supply chain shock caused by a natural disaster, a pandemic like COVID-19 or a financial crisis.
Network and IT operations
In the Network and IT Management use case, customers use graphs to model the structure of their critical computing infrastructure. This is a different form of impact planning, where we can tie hardware outages within a particular data center up to the business consequences caused by the lack of availability of a certain system.
In the next section, we’ll take a deeper look at one business use case – product recommendations – and building a retail promotional discounting program to see how all of the dots connect.
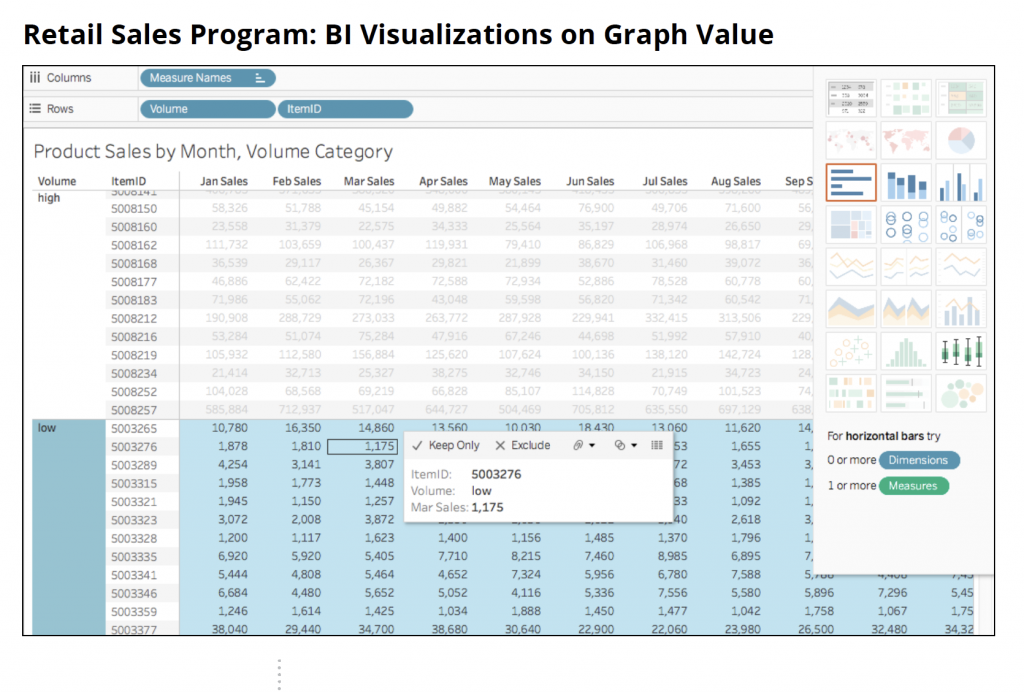
Retail sales program: BI visualizations on graph value
Let’s imagine we’re working with a big online retailer with a lot of data about household purchases on their site. In the above image, we’re presenting basic sales figures for available items, along with a classifier of whether they are high or low volume items. This is just a basic starting point though; it would be good to see which households have similar purchase behaviors, across our entire dataset, to better understand purchasing patterns and create a promotional sales program.
Household purchasing patterns
Graph value comes in when you need to understand those similar purchasing behaviors.
In the following traditional BI visualization example, you see we’ve done exactly that. We’ve
grouped all the households into communities based on purchase behavior, and then show
how many different items each community bought.
This community grouping data is made possible by Neo4j, which is currently in use by this
retailer for product recommendations.
Product recommendations are a very “graphy” use case, because doing it right requires
information about the connections between all households, items and purchasing patterns
over time.
Below is a behind-the-scenes graph driving that household communities visualization.
There are two kinds of things here: households buying things and the items they buy. The
relationships between them represent who bought what.
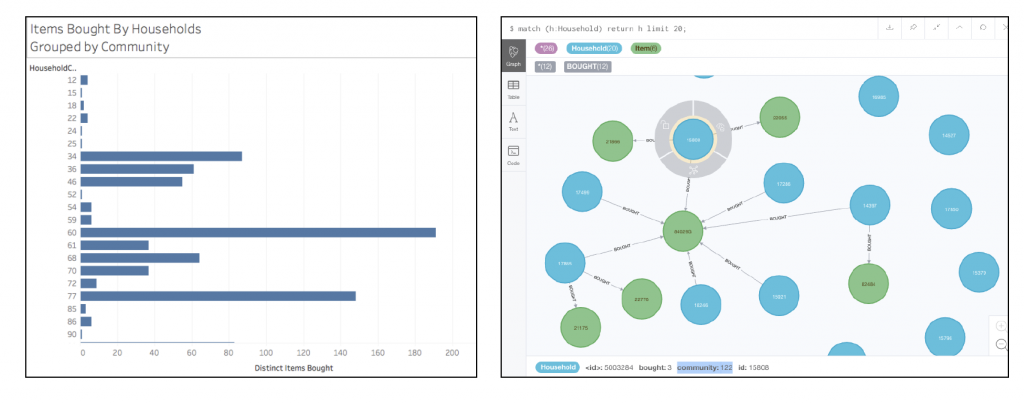
By inspecting each of the items, we can see sales figures for those items.
Looking at each
of the households, we can see they each have an ID and a community identifier as well. The
community identifier was calculated by using the Neo4j Graph Data Science Library to do
Louvain Community Detection on the households.
By having this graph and seeing the pattern of which households are buying which items,
the retailer can make great recommendations for their online experience. (Customers who
enjoyed this item also enjoyed these other items, and so forth.)
Building a promotional discounting program
Now let’s imagine that a retail analyst is looking at this data and trying to build a
program to increase sales for the site. One of the ways we might do this is to look at low-volume
items that are bought by profitable communities. We can look at those communities
and pull out the communities that are particularly profitable.
If we focus on profitable communities that buy a lot, we can then look for low-volume items
that appeal to them and run a promotional discounting program on those items.
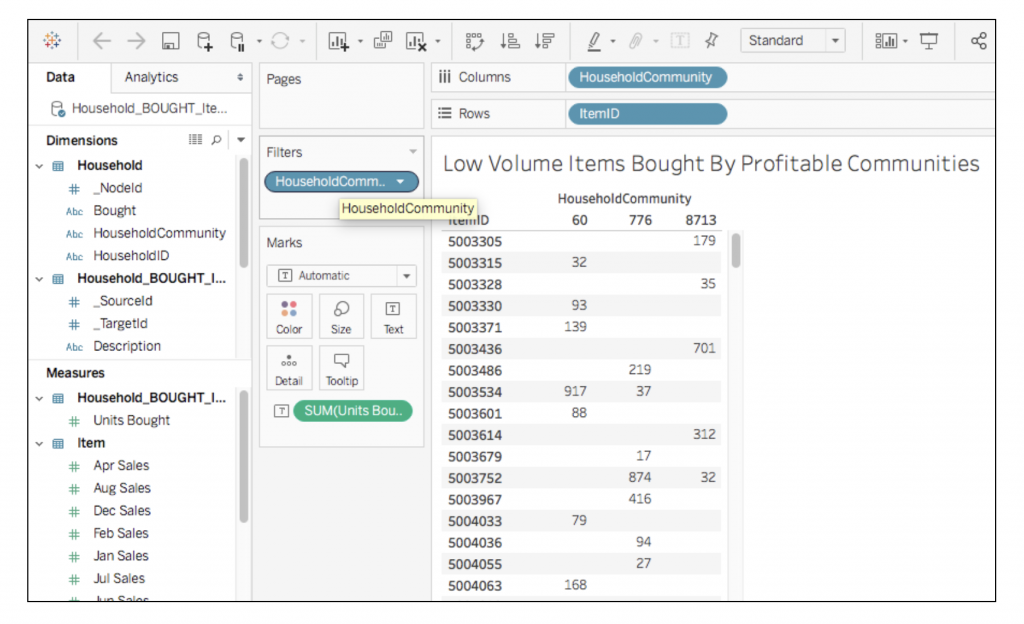
On the top we have communities, and on the left we have IDs. We see that a particular
household bought a particular item. We know that certain households have a tendency to buy
those items already, and we know they’re generally profitable. When they get on a retail site,
they’re likely to buy other things as well, which is part of our strategy.
One of the ways you can tell Neo4j did a good job with identifying distinct communities in
the data is that there is little overlap between their buying patterns. Community 8713 buys
a certain item quite a bit, but the other communities didn’t buy that item at all. This is to be
expected. Because we grouped households into communities, their behavior is different.
Technical use case: JDBC data integration
The Neo4j BI Connector is a JDBC driver. Fundamentally, what it does is expose graph data
via a “virtual relational schema” so that other tools that know how to work with JDBC data can
access the graph.
In this sample code repository, a worked example is provided of how to write Java applications
that query Neo4j with SQL. While many graph workloads benefit from the use of an official Bolt driver and the Cypher query language through Java, certain applications have the requirement to use JDBC, either as part of an application integration scenario, legacy code or other approach.This may include the use of ETL tooling such as Informatica, Ab Initio and others, but will require some testing on your part to see how this approach fits into your data integration architecture.
The primary limitation to bear in mind is that the Neo4j BI Connector is a read-only connection;
that is, you can query tables, but INSERT, UPDATE and DELETE are not supported operations.
Conclusion
With more people hungry to view connected data, the BI Connector bridges the gap between the tools people love and the growing universe of data stored in graph databases like Neo4j.
Next week, in blog three of our five-part series on the BI Connector, we will cover how the BI Connector works and when to use it.
Share Article


Explore
Related Articles


Hey LLM, you’re using OPTIONAL MATCH wrong. Here’s the Cypher that actually works.


Finding the fastest way out: How Dijkstra’s algorithm finds shortest paths