


Neo4j Bloom Tips and Tricks for Domain Knowledge Experts

Developer Advocate Neo4j
10 min read

Editor’s Note: This presentation was given by Lju Lazarevic at GraphConnect New York City in September 2018.
Presentation Summary
In this talk, Dr. Lazarevic will share some Neo4j Bloom tips and tricks for domain knowledge experts who don’t necessarily have a background in SQL and/or Cypher-led data exploration.
Neo4j Bloom is a breakthrough data visualization tool designed not only for graph experts or developers but for any user. Bloom has the ideal interface to illustrate and communicate data with co-workers, managers or executives regardless of their technical expertise.
Dr. Lazarevic will first explain the importance of choosing the right data model to ensure the best domain representation. Then, she’ll dive into the six generic Bloom patterns that come in handy in many situations: specific path, shortest paths, paths between nodes, exploring depth, commonality and extended commonality.
Full Presentation: Neo4j Bloom Tips and Tricks for Domain Knowledge Experts
I’m Lju Lazarevic, one of the Sales Engineers at Neo4j. What I’m going to talk about today includes what a good data model is, why it’s important in Bloom, how you can make it work, and finally some tips and tricks from six generic patterns that you can use to explore your data in Bloom.
What Is a Graph Data Model?
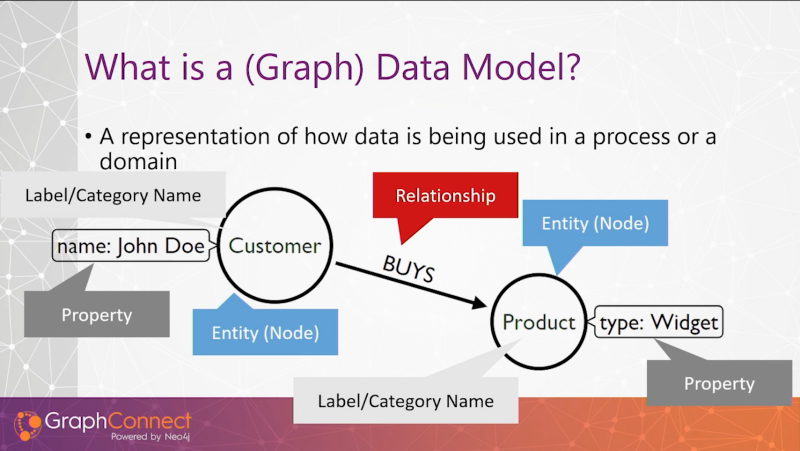
A model is a representation of a thing or a concept. A data model is a representation of how data is going to be used in a process or a domain. Very briefly let’s introduce or review the anatomy of a graph data model.
The first concept of the graph data model is an entity, which we call a node in Neo4j. Nodes are going to have a label or category name. So we could have a node label for customers, products, etc. Customers have names, products have types; so we are then going to attribute these nodes with properties. Last but not least, we also want to describe how these entities are connected; we call them relationships. In this business example below, a Customer node is connected to a Product node with a BUYS relationship.
Why a Good Data Model Is Important
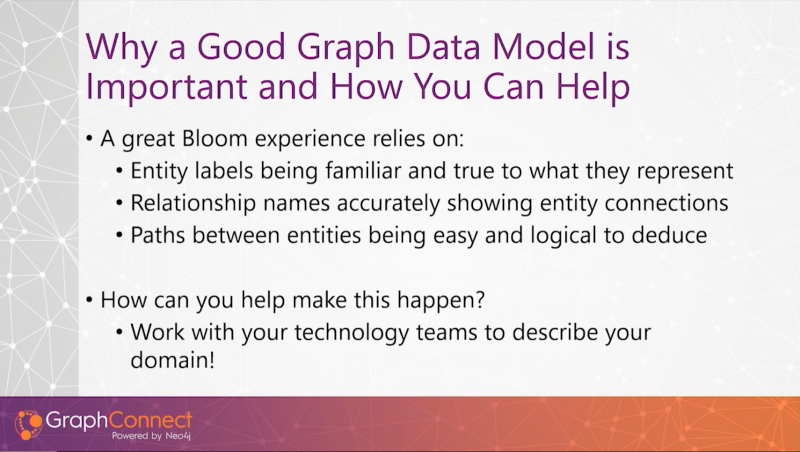
Effectively, a great Bloom experience is dependent on a good data model. Because what Bloom does when it starts up is, it will talk to the database, have a look at the schemer and you want to make sure that entities, the node names that you use are close to your domain. In other words, they represent what your domain uses to refer to them.
Relationships not only link entities together but are also often deductive; the paths or the journey that you’re going to use to connect to your business entities need to be logical to deduce. For example, if we want to have a look at how a product catalog relates to a customer, we would deduce a route where a customer, buys, a product – which is a possible product catalog.
All these elements make the Bloom experience great. As people and experts of your domain, you can work with your technology teams to make sure they’re capturing the requirements from you and understanding what your domain looks like so that they can build a data model that is representative of it.
Six Bloom Patterns to Explore Your Data
Next, I’m going to show you some generic Bloom patterns that you can use to explore data. We’ll have a look at how we get information of interest using near-natural language, how we can traverse through our data based on our domain knowledge of it. I’m also going to flag up some “be aware” situations where you may face situations that you weren’t expecting when you’re writing your Bloom patterns to explore your data.
We’ve taken some Olympic data from Kaggle and built a data model. Effectively, what we have here is the concept of a team:
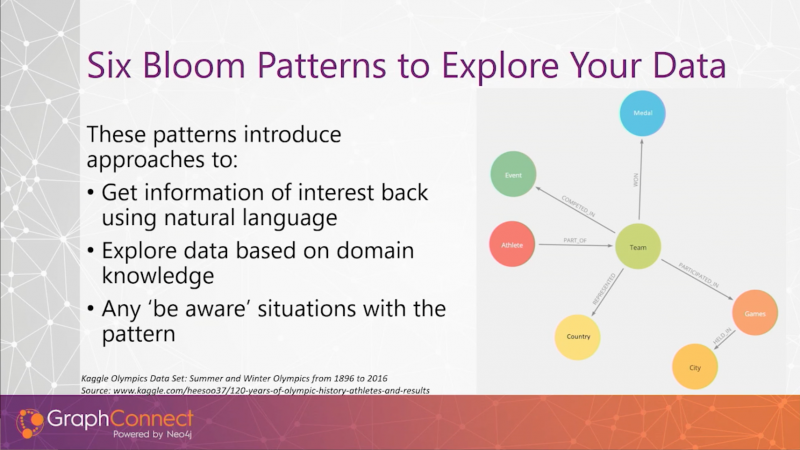
Team is the center of our model. Athlete is a part of Team, which could be, say, a Hockey team, or an individual in the Sprint team. They may have COMPETED_IN an Event and WON a Medal. They may have REPRESENTED a Country, when they PARTICIPATED_IN Olympic Games, which was HELD_IN a City.
Pattern 1: Specific Path
The first Bloom Pattern is finding a specific path. In this situation we have to define a start point. We need to know why we want to look, what questions we want to ask, and have a specific pattern.
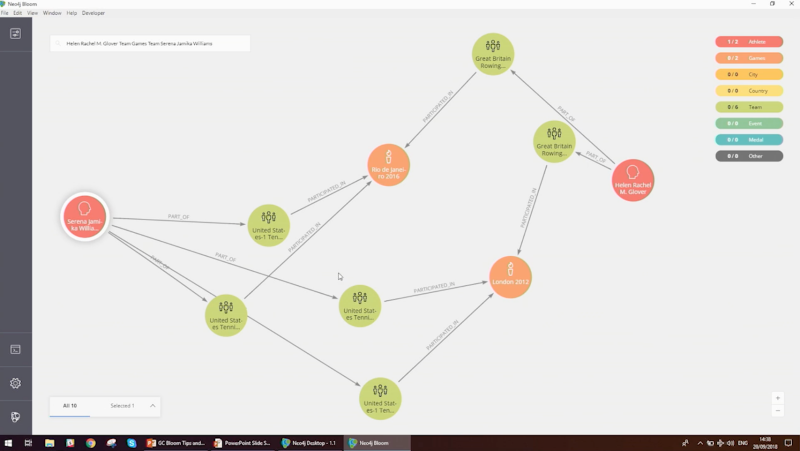
For example, I may want to ask the question: What games and teams did the British rower Helen Glover compete in?
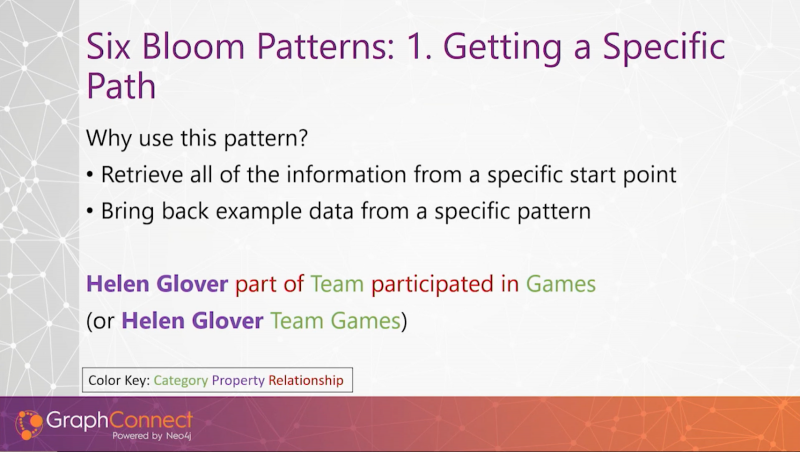
The statement above about Helen Glover codes properties in purple, relationship in red, and nodes in green. The thing with Bloom is that it will fill the gaps so that you don’t necessarily have to put in all the relationships and things, as the domain knowledge. If you understand well, you know that there is an Athlete that’s linked to a Team that’s linked to a Game.
Let’s take a look at that in Bloom. We put in our pattern and got our response back:
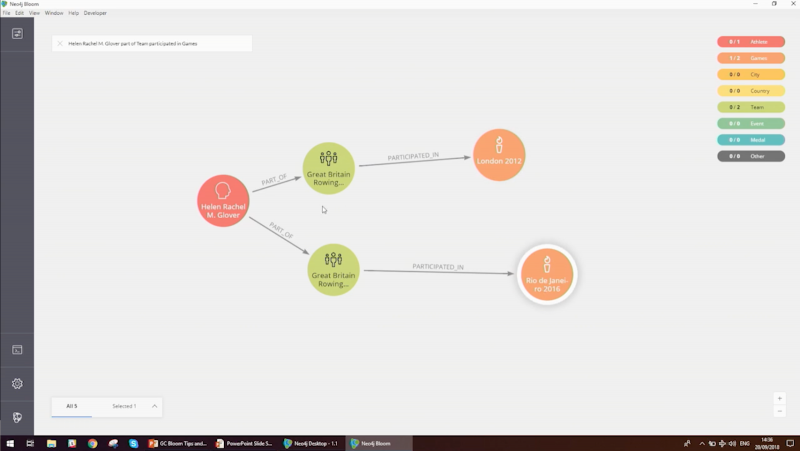
We can see that Helen Glover competed in rowing events, as women’s pairs, in both London 2012 and Rio de Janeiro 2016.
Pattern 2: Shortest Paths
The next thing we can look at is routing the shortest paths. This is great when we have a start and end point, and we want to know the shortest route that joins them.
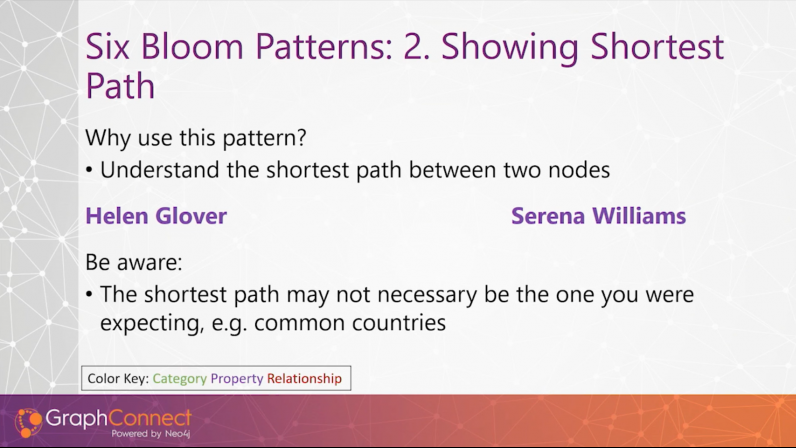
The first “be aware” here is that the shortest path available in the engine may not be the one you were expecting. For example, if we are looking to see how two customers may be joined by a product catalog, it could be because they’re from the same country.
As an example, we’re going to take a look at the shortest path between American tennis player Serena Williams and British rower Helen Glover:
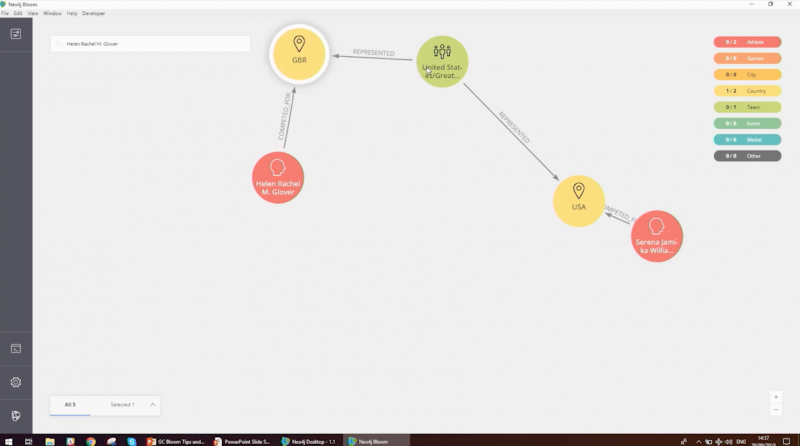
With the built-in shortest path function in Bloom, we can see something interesting: they’re linked by this joint team in the 1900s where they had a Tennis double. So, we’ve found a link but that wasn’t necessarily the path we were expecting.
Pattern 3: Paths Between Nodes
This brings us to our third pattern: paths between nodes. Having defined a start point and an end point and specific categories we want to look through, we want to understand the different paths down this particular route between the two points.
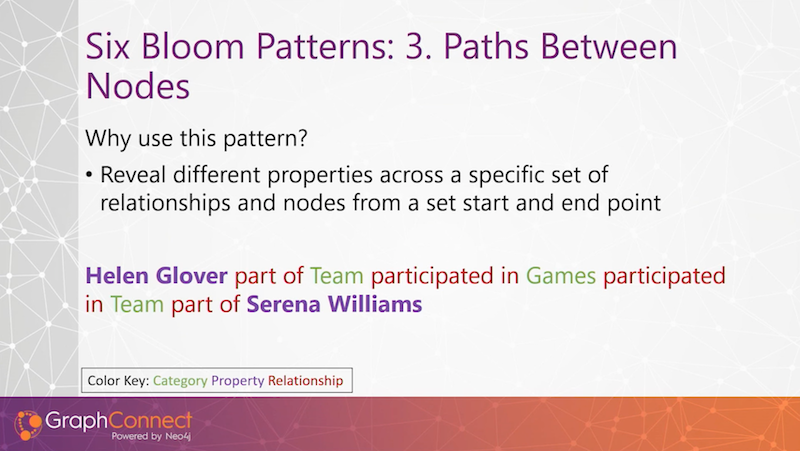
For our example, we’re bringing back Helen Glover and Serena Williams:
Straight away we can see that they have both competed in the Olympic games in London 2012 and Rio De Janeiro 2016. We can also see which tennis events Serena Williams participated in and which rowing events Helen Glover took part in.
Pattern 4: Exploring Depth
Another really powerful pattern that you can use in Bloom without having to write any Cypher queries is exploring depth. This is useful when we want to get an understanding of hierarchies or dependencies present in our data.
For instance, in a supply chain, there is a starting point: an organization. The organization will have a supplier, and the supplier will have a supplier, and the supplier-supplier will have a supplier, and so forth.
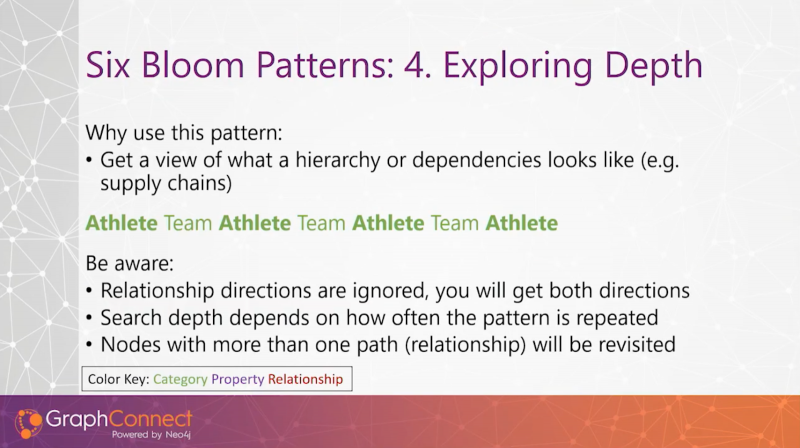
How we do it in Bloom is we’ll have some kind of repetition in the pattern going on in our phrase. The depth is dependent on how many repetitions of the pattern you have. So if you want bigger depth, you put in more repetition of the pattern.
The “be aware” at the moment is that Bloom ignores direction. The idea of organizations and suppliers means that an organization could be a supplier to another one. Therefore, when you’re on the query, remember to check the direction of the relationships of the results.
Another thing to bear in mind is, if you have nodes or relationships pointing to each other when you’re exploring depth, they will cycle around.
The example in our dataset is going to show us the dependencies of players within teams. For example, a Japanese hockey team comes up where it will have players playing across different Olympic teams. Then we can start to see which events were dependent on certain players. When we zoom into the results:
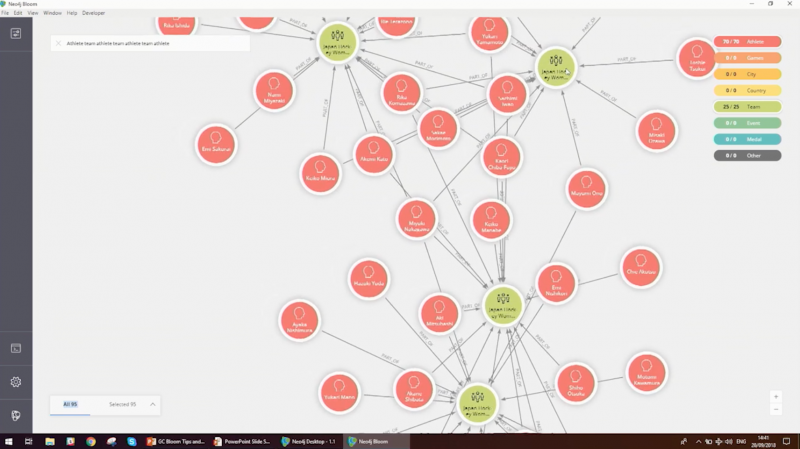
We can see players, who are dependent on other players, who are all sitting through multiple different teams. We’re getting a nice idea of seeing the dependencies in the data.
Pattern 5: Commonality
The next pattern covers how we can bring back data with commonalities.
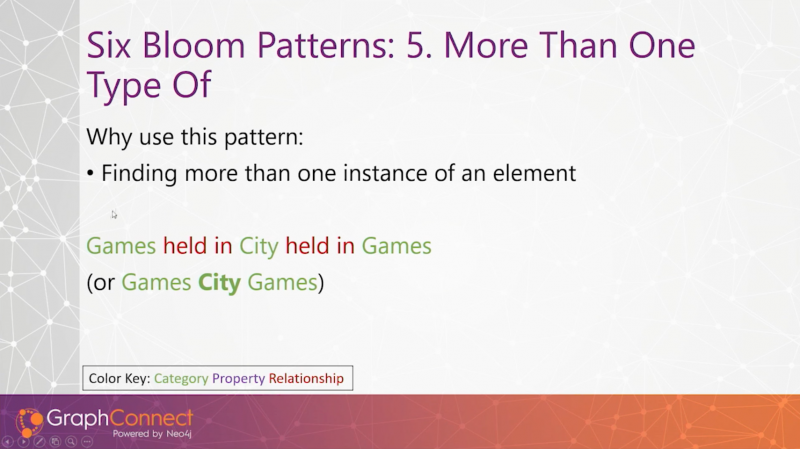
Getting an idea how we can do the commonality queries, for example, if the question we’re asking is which cities have held more than one Olympic games, we can have a palindrome pattern like this: Game City Game.
The thing we want to find out if there’s more than one is placed in the middle like a pivot point. We can ship out the relationships and Bloom will fill those gaps for us.
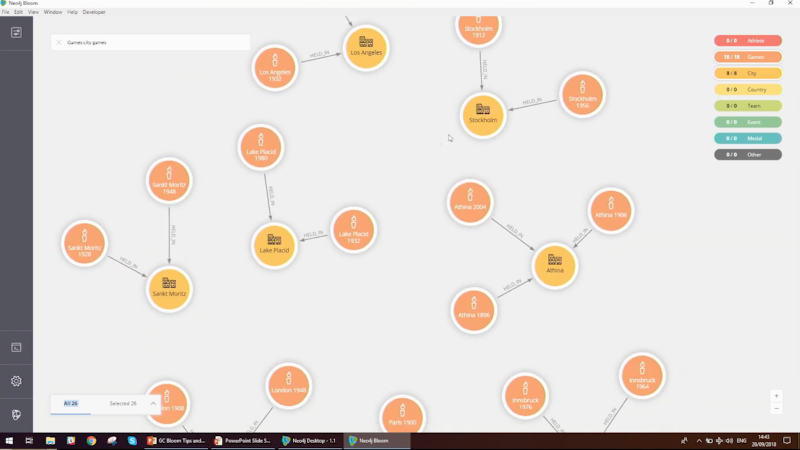
We can see that Placid has held two Olympic games, and Athens three.
Pattern 6: Extended Commonality
We may also want to know that a more-than-one-of that isn’t directly joined to the path where we have to stretch the path out, which is not a problem in Bloom.
For example, if the question we’re looking to ask is which athletes have won more than one gold medal, using the same principle, we place Athlete in the middle, and then walk the path. So we state that Athlete is part of a Team that won a Medal of type Gold and then we just repeat on the other side.

Again, the same “be-aware”s. If you have nodes to each other you may have a recursion pattern. Bloom may also put some internal limits if you have a very large dataset to improve the performance, so you may get a subset coming back.
Let’s find these athletes that have won more than one gold medal.

Zooming in and picking an athlete, here we have Masseroni, who was in the Japanese men’s swimming team. He’s won two gold medals.
Conclusion
In summary, a data model is a representation of how data is going to be used in a process or a domain. The better described your graph data model is – from labels that are reflective of your business to relationships that are representative of how these entities connect together and so forth – the better your Bloom experience is going to be.
You have a massive opportunity to work with your tech teams to make sure that the graph data model produced is accurate to your domain. To add up, we’ve also gone through some generic Bloom patterns that you can use to ask different types of questions with your data, without having to write any Cypher queries.
Ready to learn more about graph data visualizations? Check out the On-Demand Webinar Neo4j Bloom: Data Visualization for Everyone.
Share Article


Explore
Related Articles
Bolster Your Cybersecurity by Visualizing Attack Graphs With Neo4j & G.V()


15 Best Graph Visualization Tools for Your Neo4j Graph Database

