
Using Neo4j & Structr to Measure the Impact of 1 Tonne of Carbon

Founder, Keynumbers
4 min read

Structr is a Silver sponsor of GraphConnect San Francisco. Meet their team on October 13-14th at the Hyatt Regency SF.
It’s on the news all the time: climate change, global warming, etc. Advocated by politicians like Al Gore and President Obama; championed by celebrities like Leonardo DiCaprio; and even IT geeks like Elon Musk, Bill Gates and Mark Zuckerberg occasionally get in on the act.
But what is it? We know how much it weighs but what area or volume does it cover or what is the environmental impact if it’s one tonne or one megatonne?
But before you go to Google, what came to the top of your mind? Maybe a whirl of headlines and emotions or maybe a sense of apathy. Don’t worry, you’re not alone. We live in a world bombarded with information and while using big words and prefixing numbers with mega and giga gets our attention, the downside is we lose focus from the key issues and numbers.
So how much is one tonne of carbon?
It’s easy: 50 trees.
Breaking Down the Key Numbers on Climate Change
That’s the number that needs to be planted and grown for a year to offset one tonne of carbon. It’s also the emissions from using 420 litres of gasoline. It’s not a perfect figure, but it gives us a concrete idea of the what needs to be done.
Taking it a step further, you can fit 1000 trees per acre so divide the carbon by 20 gives me a sense of space required and when that number gets too big I divide it by the area of Sweden to get a sense of magnitude. Sweden is 100 million acres so makes the arithmetic a touch easier!
Using Neo4j to Connect the Dots
So what’s was my real problem? I’m old and my brain can only handle so many numbers. I figured there must be a system that handles this kind of stuff but I searched and couldn’t find any relevant resources. Going back to my database days I looked at SQL and realised it was too rigid. Excel came to mind but it’s a lazy tool and things easily get lost.
Finally I stumbled upon Neo4j and the world of graph database. This was it: a flexible structure, able to connect the dots yet still maintain a lot of functionality of a relational database such as ACID transactional integrity.
I started sketching out the business case of how I wanted the system to work. It had to capture any value and unit of measure combination, allow the user to combine and aggregate anything that was mathematically possibly and finally, present the numbers how the user wanted to see them. Checking this against Neo4j, it was as near to a perfect fit as I could want.
Building on Neo4j with Structr
Then there was my second real problem! I’m not a programmer, nor do I want to be one. With age comes the smarts to realise you need to find people better than yourself. When starting a company, many components need to come together especially around the technical solution: database, application layer, interfaces and APIs all connected through a seamless UI. The more that can be done with less, the better for all.
And this was where I got my big break. I discovered Structr! Calling it “just” an enterprise content management system would be a disservice. It’s an application framework for Neo4j with all the boring stuff preconfigured. And it make my work easier.
From the moment, we started modelling the requirements in the schema editor, I realised that this is a system focused on fast-tracking prototypes but with the robustness to easily convert them into production-ready applications. In our case, adding components such as bootstrap templates, jsPlumb and jsPanel were seamless and, to be honest, I can’t tell you too much about them because the system dealt with those issues so easily.
Then the hard part: Those with experience in traditional systems feel a natural lean towards the comfort of lists and table normalisation. Our mantra quickly became: Is it graphy enough? When we changed the schema to add triples, it naturally lent to understanding the impact of converting energy to emissions.
When we scratched our head to figure out how people would search the graph for key numbers, we added a social network. Each change that made it more graphy naturally reflected the business logic and gave us that extra bit of confidence that we were heading in the right direction.
We still have much to develop, but from a business perspective, I’m saving time and money while minimising the risk of showstoppers. Structr and Neo4j is a proven combination and will soon allow me focus on our Keynumbers project without having to do the mental arithmetic.
P.S. If you’re confused, like I was, by the chemistry of how 420 litres turns into 1 tonne, it’s basically 1 carbon atom + 2 oxygen atoms…CO2 : )
Share Article


Explore
Related Articles

What Is Data Lineage? Tracking Data Through Enterprise Systems
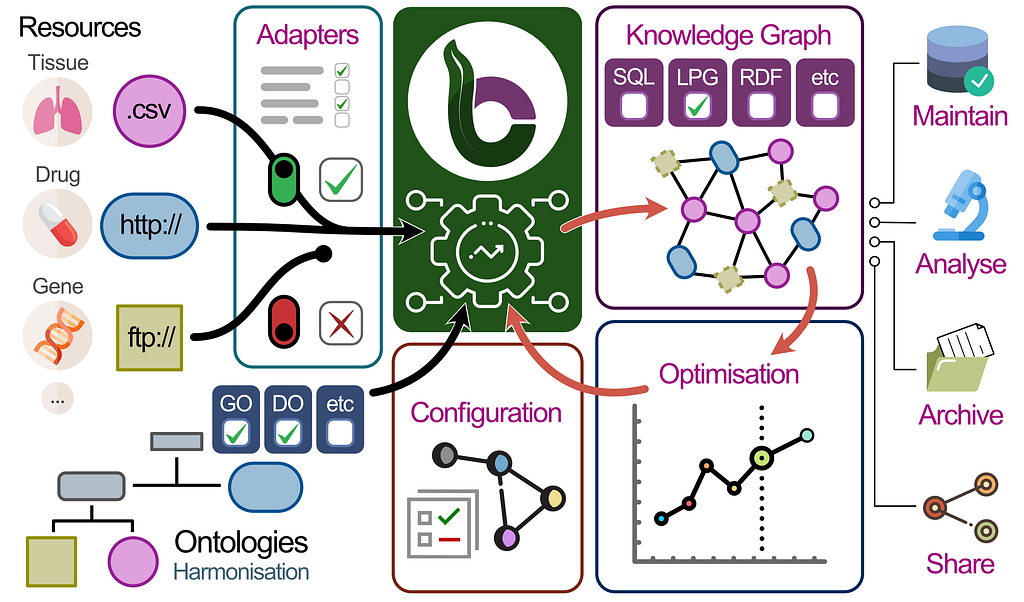
BioCypher: Unifying Framework for Biomedical Knowledge Graphs

Graph Data Science for Drug Discovery: The 5-Minute Interview With Ufuk Kirik


Graphs for Information Services: The 5-Minute Interview With Cyndi Streun
