Featured Post
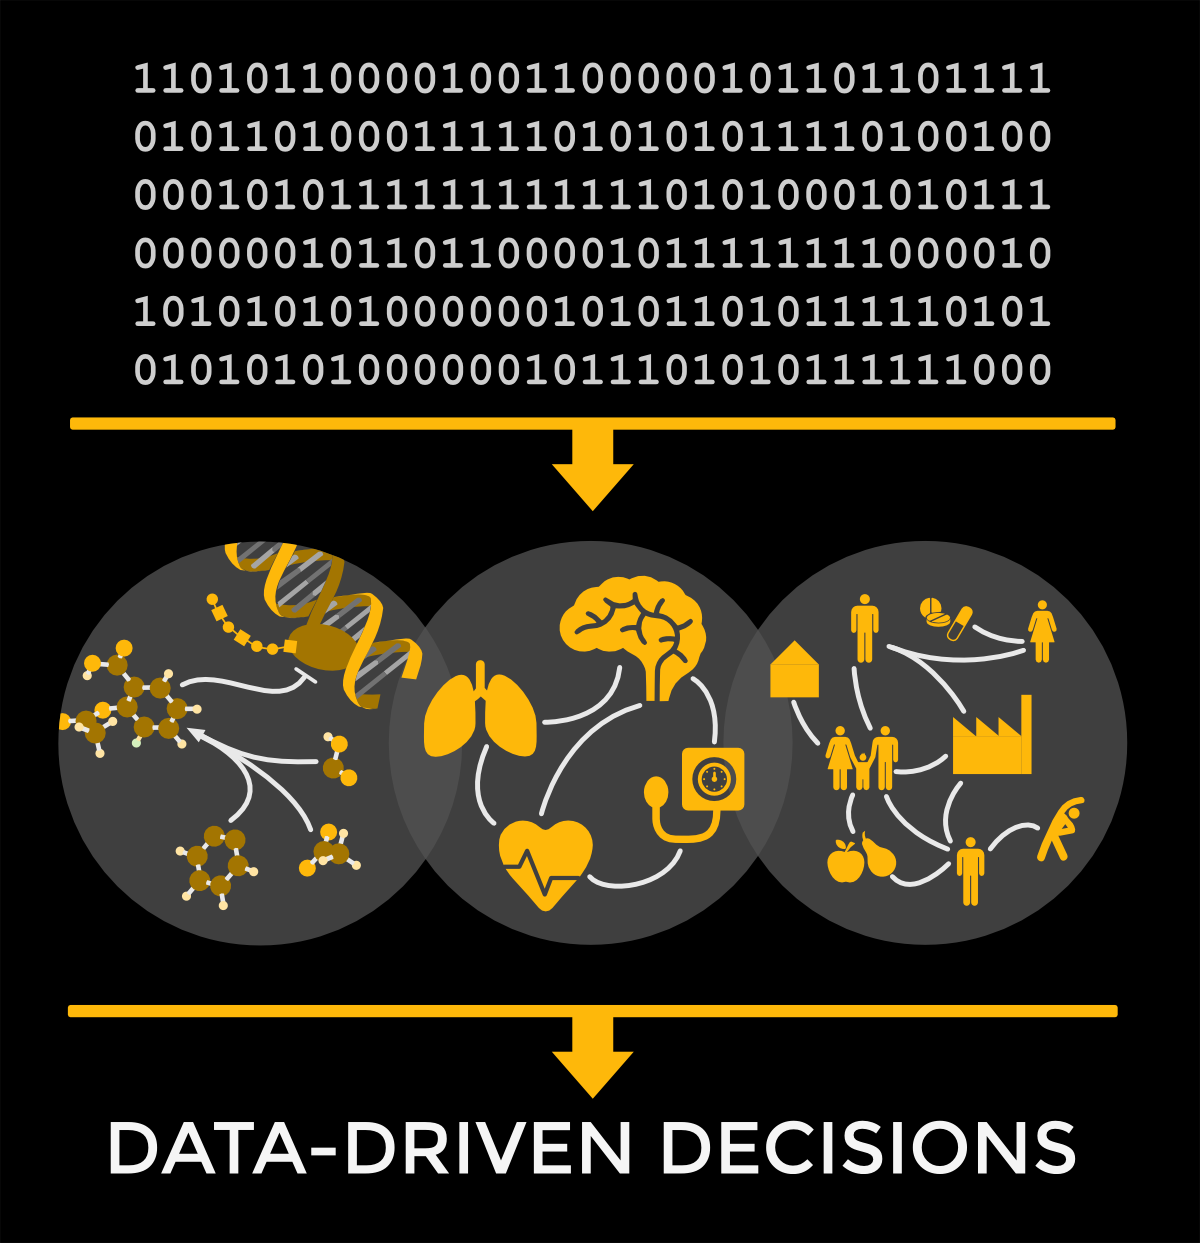
Learn more about graph technology is used in government agencies.

Graphs in Government: The Power of Graph Technology

The use cases for a graph database in government are endless. Graphs are versatile and dynamic. They are the key to solving the challenges you face in fulfilling your mission. Using real-world government use cases, this blog series explains how graphs solve a broad range of complex problems... read more


This Week in Neo4j – Graphs to fight diabetes, Overhaul to visualization tools page, Eventing Graph Data With Neo4j & RabbitMQ, Arrows Tips and Tricks

This week we learn how graphs are being used to fight diabetes and we have an overhaul to the graph visualization tools page. Michael shares his favourite tips and tricks for using the Arrows graph modelling tool, Vinodh Subramanian shows how to consume and produce events for RabbitMQ, and... read more


Watch Michael Moore and Omar Azhar's presentation on transforming the enterprise AI at scale with Neo4j

Transforming the Enterprise: AI at Scale with Neo4j

Editor’s Note: This presentation was given by Michael Moore and Omar Azhar at GraphConnect New York in September 2018. Presentation Summary EY has embarked upon an ambitious graph enterprise AI and machine learning initiative to more effectively uncover fraudulent activities for their... read more


Discover how graph technology is being used in government.

Graphs in Government: Introduction to Graph Technology

The use cases for a graph database in government are endless. Graphs are versatile and dynamic. They are the key to solving the challenges you face in fulfilling your mission. Using real-world government use cases, this blog series explains how graphs solve a broad range of complex problems... read more


This Week in Neo4j – Content-Based Recommendations using Knowledge Graphs, Augment Intelligence with Graph Power, Graph Algorithms in Practice

This week we learn how to build a content recommendation system using knowledge graphs, augment business intelligence with graph power, and learn how to use BloodHound to assist with an analysis of password hashes from two different domains. Featured Community Members: Global Graph... read more


Check out this 5-minute interview with Sebastian Müller, CTO of yWorks.

More Data, More Visualizations: 5-Minute Interview with Sebastian Müller

"Graphs want to be visualized," said Sebastian Müller, CTO of yWorks. Developers are looking to understand the data in graph databases, explore it and create applications that offer interactive interfaces to that data. yWorks is a developer tool for creating visualizations of graph data. In... read more